


 Arguments


The Problem with Percentages
Posted on 15 February 2023 by Evan
This paper demonstrates the peer review process that occurs at Skeptical Science. Several commenters in the comment thread pointed out an error in the analysis and made other suggestions. Whereas I suggest that renewables are likely to only contribute 30% of the near-term growth of electric-energy demand, in fact, renewables are likely to makeup all of the near-term growth in electric-energy demand. I will be redoing this paper to correct this error and to refine the analysis. However, the basic tenets of this paper will not change: 1) percentages can be used to hide the actual trend and 2) renewable energy is currently only supplementing, and not supplanting fossil fuels.
At a young age I learned that global population was increasing and worried about whether there would be sufficient resources for all of the new mouths added each year. I was relieved when I learned that overpopulation would be solved within my lifetime because population growth was decreasing. I put that problem out of my mind.
That was when the global population was 3 billion and I was naïve. Whether intentional or not, I had been snookered by the media because they were broadcasting population growth as a percentage of current population, shown in Fig. 1. In absolute terms, however, population growth has been increasing my entire life and we are still nowhere near solving this age-old problem (no pun intended).
This exemplifies how percentages can be misleading.
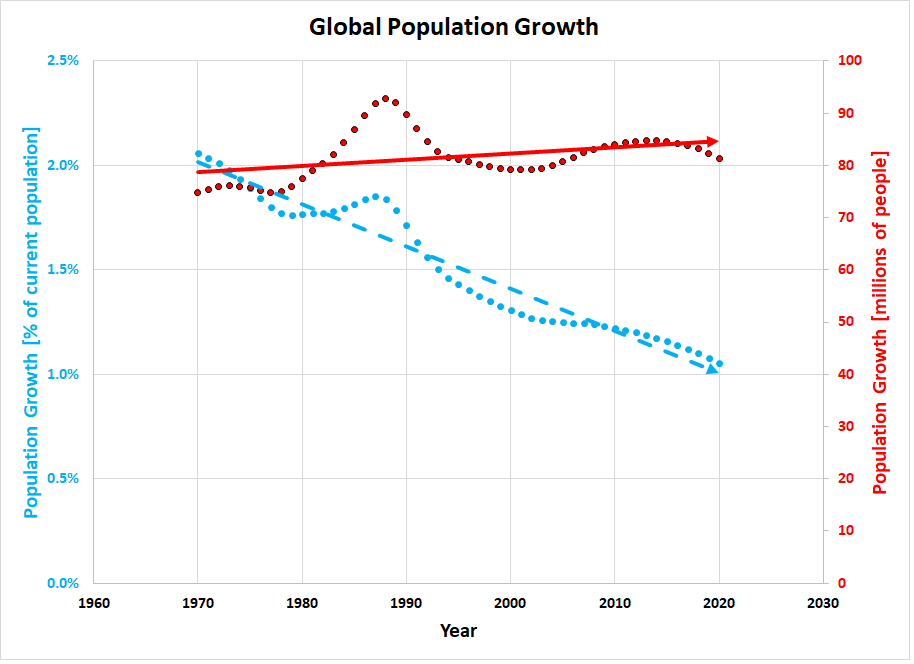
Figure 1. Annual, global population growth as a percentage of current population (dashed line) and as actual growth (solid line). Data is here.
Our “progress” towards reaching net-zero emissions is being communicated using methods that can similarly cloud our actual progress. We are awash with optimism about how well the energy revolution to renewable energy is going, at a time when global fossil-fuel usage is still increasing. An article in the New York Times (read here) recently noted that Europe already gets 22% of its energy from renewable sources and that globally renewable energy installations grew by 25% in 2022. Seemingly impressive numbers. At 25% growth/yr we might believe that Europe will be fully converted to renewable energy within a matter of years. Although it is unlikely such a revolution will occur that quickly in Europe, what is more important is understanding global trends, because that is ultimately what controls Global Warming/Climate Change (GW/CC) Let’s illustrate the problem using a simple example.
Figure 2 shows electricity generated from renewable energy, Fig. 3 shows trends for energy derived from fossil-fuels, and Fig. 4 compares energy demand over the next 10 years with that likely to be provided by renewable energy.
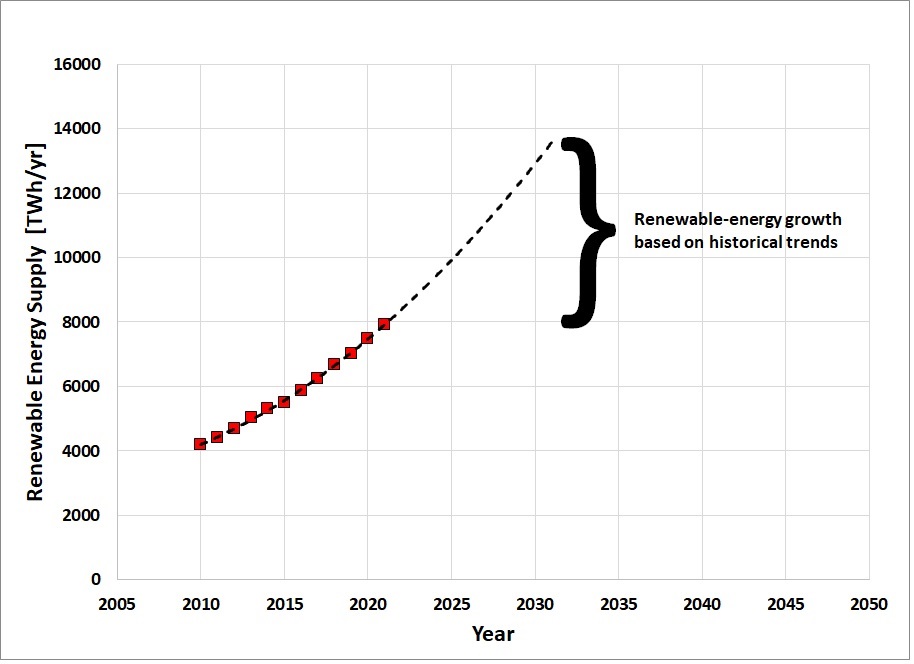
Figure 2. Renewable electricity generation during the recent, rapid growth of renewable energy. The continued rise over the next decade, based on historical trends, is also shown. Data is here,
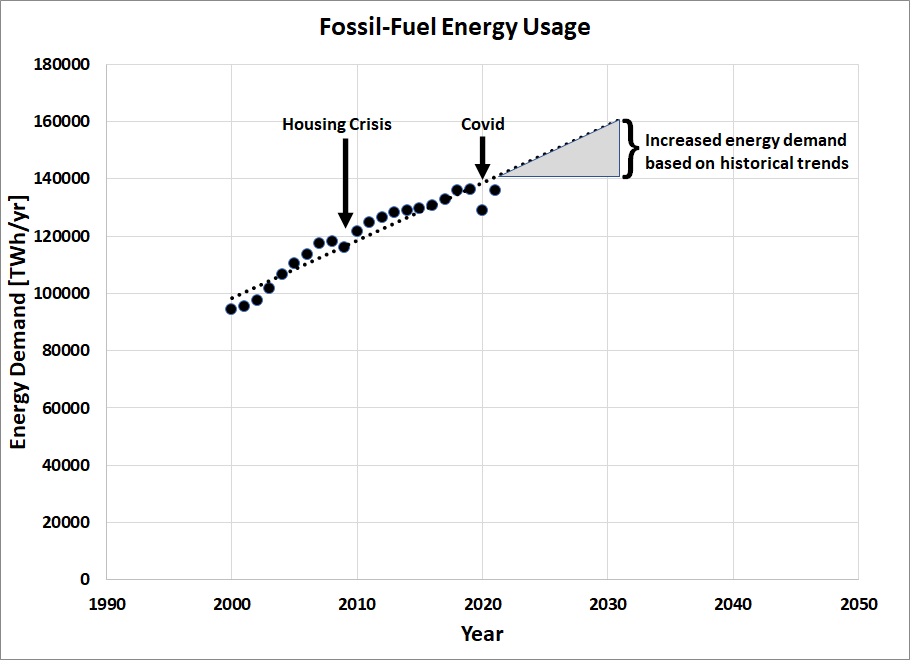
Figure 3. Global fossil-fuel usage from 2000 onward, showing the temporary effects of the housing crisis and of Covid on energy usage. The continued increase over the next decade, based on historical trends, is also shown. Data is here.
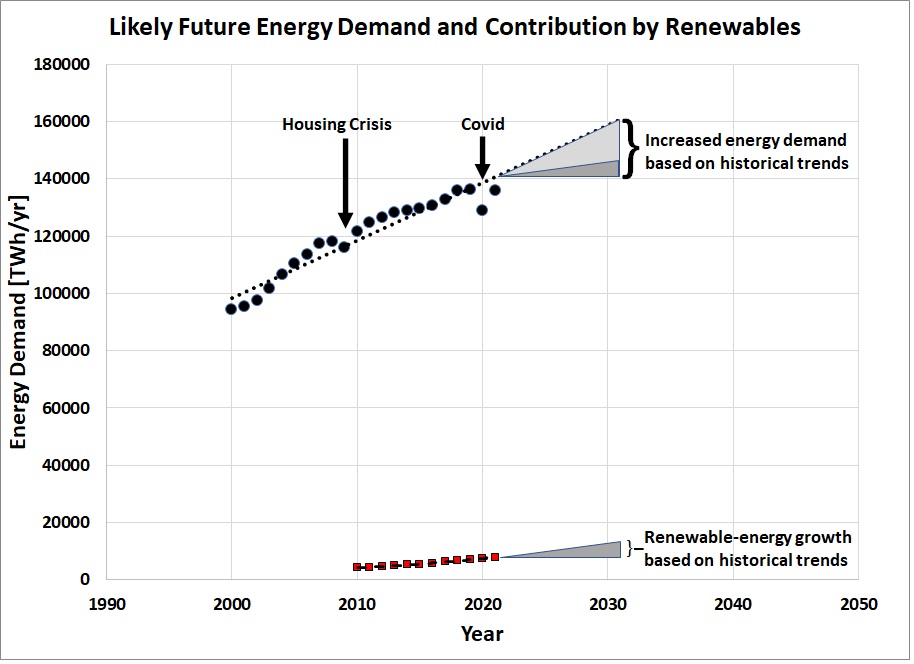
Figure 4. Using data from Figs. 2 and 3, comparison of likely growth of energy demand (light gray triangular wedge), showing the fraction provided by renewable energy (dark gray triangular wedge). The dark-gray wedge is superimposed on top of the light-gray wedge to indicate that based on historical trends, that renewable energy growth will likely only provide about 30% of the increased energy demand over the next 10 years.
There are many ways to extrapolate trends into the future. The method I show in Figs. 2 to 4 is to simply extrapolate recent trends into the future. Whether or not this is what actually happens over the next 10 years is, of course, not known. But because this method is based on what we’ve actually been doing in the recent past, extrapolating recent trends over a short time frame going forward provides a good means for assessing and adjusting our plans if such analysis shows us coming up short of our goals. Because GW/CC is a global issue, the following analysis uses global data only.
As of 2021, Figs. 2 and 3 suggest ...
- Global fossil-fuel usage about 140,000 TWh/yr.
- Global renewable energy electricity generation about 8,000 TWh/yr.
- Fig. 2 indicates renewable energy increasing about 6,000 TWh/yr over a 10-yr period.
- Fig. 3 indicates energy demand increasing about 20,000 TWh/yr over a 10-yr period.
- Based on recent, historical trends, Fig. 4 indicates that over a 10-yr period that renewable energy will only provide 30% of expected growth in energy demand.
Therefore, renewable energy is currently supplementing, and not supplanting fossil fuels. However impressive it sounds to say that global renewable energy grew 25% in a single year, recent, historical trends indicate that the growth of renewables is not even keeping up with growing, global energy demand.
If we were to define an energy revolution as one where renewable energy begins to replace fossil-fuel use, leading to a steady reduction in fossil-fuel usage, then this simple analysis suggests that although we may be laying the groundwork for an energy revolution, it has yet to begin. Think about this the next time you step into the voting booth. Think about this the next time you make a decision about home heating, home power, or what type of car to buy.
Do you see how working with percentages, even impressive-sounding percentages, hides the real problem? Fossil-fuel consumption continues to grow and the current growth of renewable energy is not keeping up with, much less replacing fossil-fuel use. What will it take to get to net-zero emissions?
Because the hope is that we will do better in the future than we've done in the past, such projections need to be continually updated. The main point here is to not rely on isolated, impressive-sounding percentages, because they can easily hide the trends that matter, especially when they relate to regional trends only.
Putting Europe's 22% Renewable Electricity Generation in Context
In 2022, the state of Texas in the US got 28% of its energy from renewables (read here). Thus, in 2022 Europe, with its reported 22% of electricity coming from renewables, is lagging behind one of the “oil capitals” of the world in terms of renewable-energy installations. If an oil-rich, Republican stronghold is ahead of Europe in the amount of energy it gets from renewables, perhaps this number of 22% is not as impressive as it sounds. Is it possible that the renewable energy in Texas is supplementing fossil-fuel generation rather than replacing it? Can the same be said for renewable-energy installations elsewhere? Has the shift from fossil-fuels to renewables really begun, or is the growth of renewable energy up to now merely providing surplus generating capacity to fuel our ever-expanding lust for power? In the context of our goals to reach net-zero emissions, how easy will it be to get to meaningful annual renewable percentages like 50%, 75% or more? Do a search on the percentage of the power created by renewables in any given geographical location. You will repeatedly find numbers in the range of 20-30%. If you read that such and such a place generated all of their electricity from renewables, it is usually only for a relatively short period of time. When averaged over an entire year, it is very difficult, without using energy storage, to generate more than about 30% of the energy from renewables. To get to net-zero emissions we must roll out renewable energy across the entire world, with energy storage, and simultaneously ramp down fossil-fuel use.
"Crossing The Chasm" Analogy
For those familiar with the business concept of “Crossing the Chasm”, what we’ve achieved so far can be likened to expanding renewable energy to early adopters. We’ve yet to cross the chasm to the mainstream: the rest of the world. Businesses sometimes fail because they project penetration of their product into the general market based on the rate of penetration into the early-adopter market. It may be that with renewable energy all that we’ve done so far is to pick the low-hanging fruit. To reach net-zero emissions, renewable energy must not only penetrate the general market, it must dominate the entire energy market and displace all existing, fossil-fuel based energy systems in a little over 25 years, if we’re to make our goal of reaching net-zero emissions by 2050.
The NYT’s article identifies the Chasm-Crossing problem as the cost of capital in emerging markets vs the cost of capital in developed countries.
“If you want to develop a solar project in Brazil or India, Birol said, you’re likely to pay three times more for financing than if you were to build the same project in Europe.
That has huge climate implications. The energy demands of these big emerging economies are growing fast. If they can’t finance renewables, they’ll turn to gas instead. Or worse, to coal.”
Clean Energy in China
There is a somewhat different problem in China. Although China is clearly a leader in developing and deploying renewable energy, their motivation likely has less to do with a desire to lessen the impacts of GW/CC and more to do with their own development goals. China is running out of water with which to cool traditional fossil-fueled power plants that have traditionally been behind their rapid economic expansion. Is renewable energy in China supplanting or supplementing existing fossil-fueled power plants?
At the same time, there is a strong push to transition to EV’s in to ease local pollution. It is much easier in China to get a license to operate an EV in a large city than to operate a gas-powered vehicle. The rise of EVs in China may not represent a decrease in emissions associated with people decreasing use of gas-powered vehicles, but rather an increase in the total number of vehicles. Because EV’s have a carbon footprint, albeit lower than gas-powered vehicles, whether there is a net drop in carbon emissions associated with increasing EV sales in China will depend on whether the decrease in operation of gas-powered vehicles outpaces the increase in EV’s.
Be careful about assuming that a growth in renewable energy and EVs in China implies a decrease in carbon emissions. The situation is more complex.


"renewable energy grew 25% in a single year, recent, historical trends indicate that the growth of renewables is not even keeping up with growing, global energy demand." Global energy demand may be accounted in terms if 'fossil energy in' rather than 'electricity out'. As mentioned a week ago on this website, 60-70% of 'fossil energy in' is lost as waste heat upon combustion, the remainder becomes electricity. For fossil energy, the 'energy in-to-power out' conversion is as low as 30%. For renewable energy, it's closer to 80%.
Hi there,
Unfortunately I'm posting because I noticed what can only be called bad trend analysis.
1. The renewable energy growth trend is simply badly done.
a) Renewable energy has four distinct components with different growth trends. Wind, solar, hydro and the rest (primarily bioenergy). Hydro and other renewables is following a linear growth trend, while wind and hydro are growing exponentially. However this exponentiality is hidden if you throw them in together: the dominant hydro represses the actual growth rates of solar/wind. This means your analysis is inherently flawed.
b) Solar is growing from 2011 to 2021 by 38,8% annually, while wind by 16,5%. Assuming hydro and other renewables continue linear growth they reach respectively 5000 TWh and 1100 TWh by 2032. By comparison if solar and wind retain 38,8% and 16,5% annual growth rates they will reach 37600 TWh and 9900 TWh respectively, so jointly renewables would have 53600 TWh by 2032. That would be the result of a proper trend analysis. Surprisingly you seem to have had a problem with percentages...
c) Now both solar and wind seem to be following more of an S-curve, so 38,8% and 16,5% growth rates seem unlikely to hold. Basic analysis of trends suggests average growth rate for 2022-2032 at 25,5% and 14% respectively, worst case scenario 20% and 11%. This average scenario would mean 26300 TWh renewable energy by 2032, while the worst case scenario 19000 TWh. As you can see all result put it much higher than your wrongly done trend analysis suggests.
2. The fossil fuel usage graph has an even simpler flaw. It suggests continued linear growth, but absolutely ignore the fact that fossil fuel usage seems to have stalled in 2018 and shown little growth. We seem to have hit peak oil consumption. IEA notes all these facts. No does this mean that fossil fuel usage will stop growing or even start falling? No. But you should have at least noted the recent stagnation of fossil fuel growth as the sudden jump from 2022 is odd to say the east.
It seems in all honesty that you should revisit the math, calculate wind/solar growth separately and then adjust this piece with the new numbers. I'm afraid that in its current form it is simply misleading. As to the possibility of fossil fuel generation stagnation - I expect this to at least be discussed.
China is somewhat of a special case, owing in part to the rather complex financial rivalries between provinces (despite Beijing policy).
PrzemStep @2/3 , you are right . . . predictions are difficult, especially of the future [as the saying goes]. Probably the Third World countries will continue to be open slather re fossil fuels, and even the First World countries will continue to use colossal amounts of gas/petroleum for decades. And . . . our mathematical trend analysis really needs to be firmly based on the underlying physical situation (plus guessable politics).
Can "hydro" expand linearly? Or must it plateau out soon? And will we eventually find domestic electric power supply being "shaped" by smart-meters (a la ISP download speeds) according to wind/sun ? Or will new-technology batteries come to the rescue? Crystal ball needed.
PrzemStep, thanks for your comments.
Fossil-fuel usage seems to have stalled before the housing crisis, then started back up again. I am aware of the apparent stalling during the Covid pandemic, and am also aware that economies are starting to ramp up again. Will fossil-fuel usage stall or start back up? I am not making predictions, but simply showing where the overall trends have been leading for a long time, and what looks like a plateu may in fact be a temporary trend. Nobody knows the future, but trends are useful for showing the general direction.
What I'm really suggesting in this post is that isolated, impressive-sounding percentages can often be misleading, and in the case of population, show the opposite trend to what is happening. I am suggesting that people look at the totals, and not just isolated percentages. I am not making specific predictions about the future, but rather showing that based on long-term trends, renewable energy is far from replacing fossil fuels, even though the impressive percentage growth of renewables makes it sound like renewables are replacing fossil fuels.
@Eclectic - Can "hydro" expand linearly? I don't know. That said growing linearly hydro from ca 4300 TWh would grow to ca 5000 TWh, so 700 TWh, so it is pretty insignificant given the scale of change needed. Or the numbers above. In total I assumed hydro and other renewables only add 1050 TWh by 2032. And as you said: you can only analyze the trend, you can't make an exact prediction. I'm just saying that there was an underlying mistake in the trend analysis, because hydro mutes wind and solar growth.
Evan, thanks for the feedback. I would underline that COViD is 2020, but fossil fuel energy used hasn't risen since 2018, so this could be a global trend - impact of EV and heat pumps should start being felt. Let's wait for 2022 stats, but I believe the picture will be similar. I still believe that the potential of stagnating growth or even a drop in fossil fuel energy use should have been mentioned.
As to the other point: In order for the argument to be more sound it would work better the actual numbers. And the fact is that by coupling wind and solar (degrading exponential) with hydro (linear) you muted the actual percentage growth of renewables. You reached 14000 TWh, I reached 26000 TWh. You must admit growth to 26000 TWh would look way more impactful on the above charts and over 100% of energy growth would be covered by renewables.
PrzemStep, thanks again for your feedback. After the 2022 numbers are in, I will consider reposting this article by breaking down the numbers further. Perhaps it would be useful doing trend analysis as I've done and comparing to trend analysis as you suggest: breaking the numbers down further and extrapolating each. But 2023 may be the first year where the world is operating at full capacity again (barring any severe recessions), so a recovery in fossil energy use may still be delayed beyond the 2022 numbers. Any of these projections are risky, because continued expansion of renewables beyond producing about 30% of power requires storage technology that must be deployed on a large scale and may compete for materials used in the transportation industry. Tough to predict.
Bottom line, the analysis I provide gives a feel for the magnitude of the problem. My real goal is to demonstrate that just covering the growth of energy use is a mammoth task, one we're struggling to accomplish. Actually replacing fossil energy use is yet to come, and will require even more commitment to change. If people read optimistic-sounding reports and feel that we are doing better than we actually are, then they may prematurely relax the pressure that needs to be continued to really get this energy revolution going. I am trying to provide perspective.
But I will consider your suggestions in a rewrite. I appreciate you taking the time to write your very informative comments.
Thanks! Will be waiting. And I commend you greatly for how you accepted my critique.
Important questions on this topic are going to be,
(a) what is the required penetration of grid storage?
(b) at what level will end-of-life auto batteries play into supplying those grid storage needs?
(c) how do you factor in both resources constraints and new technologies?
Recently, I was reading one energy researcher suggesting we'd only need ~10% storage, which was much lower than I would have guessed. (I think it was Andrew Dessler who said this, but I could be remembering wrong.)
Given the rapidly expanding volume of new EV models hitting the market, within the next decade those are going to all be batteries available for a second life on the grid. A big question mark in my own mind is related to how long EV's are going to last. Initial data suggests EV batteries are still performing well (<10% degradation after >150k miles, off the top of my head). Is that going to translate to people using cars longer, or is that going to mean EV batteries are going to have a lot of remaining life when placed on the grid?
Too often I read people discussing the constraints on resources producing an S-curve in deployment, which is an obviously important issue, but failing to acknowledge since those constraints are knowable new tech to address constraints is always in the works.
I think one of the big differences between legacy FF energy and renewable+storage energy is the expanded breadth of opportunities. There are limited ways to utilize FF combustion and we've probably exploited that potential to near theoretical maximums. Whereas, renewables+storage are announcing potential new materials and methods on a weekly basis.
Looking out even further, I'm fairly confident fusion technology is ultimately going to work, just not soon enough to address imminent climate change issues. But it's important to remember this framing: as likely as not, all of this is merely a bridge to 22nd century energy systems. The Herculean task our generation faces is building that bridge.
Rob@10, concur with your assessment and questions. I've also wondered how the EV batteries will supply the grid-level storate need. Or will a market emerge for installing them as home battery systems? An end-of-life EV battery still has plenty of power for home battery systems.
BTW, our EV has 125K miles and figure we've lost about 10% of the battery capacity. But we've no plans to retire the car nor do anything about the battery. We've owned the car for 6 years, and after that time and miles one adapts to the small loss of range. Our Tesla MS originally had 260 miles range (200 usable), and a 10% drop is not that big a deal. We still have plenty of range for the city commuting that dominates our lives.
Evan@11,
You are wandering into my area of "professional" expertise!
Do (in situ) EV batteries need to supply "grid-level storage" (AKA V2G) in future?
How about "microgrid-level storage" (V2B) or even "nanogrid-level storage" (V2H)?
Ex EV batteries are certainly already being used to provide "stadium-level storage":
https://V2G.co.uk/2018/06/3-mw-xstorage-now-live-at-the-johan-cruijff-arena/
Rob Honeycutt @10,
In terms of storage, I would expect excess electric power would be used to provide storeable things like hydrogen or ammonia. There will be losses in the conversions but the 'storage' problem is overcome, as would be the 'transport' problem.
Evan @8,
The point by PrzemStep@2 that individual forms of renewables should be projected individually is entirely correct. The OurWoldInData renewables page presents some very useful numbers on this.
Myself I see the big player in future being solar as it has less restrictions on its useful location. Its generation has been growing on average 30% annually since 1990 but in recent years this has dropped to perhaps 20% annually. A 20% annual increase woud give solar 200,000TWh/y by 2050 and if we could get back to increases of 30%/y that would be perhaps the 160,000TWh/y by 2032.
I see it as really depending on when we manage to put ideas like nuclear to one side and appreciate that 'mass' solar is the way to go, with for instance the Sahara powering Europe. (Some have already arrived at this conclusion with a £18 billion project to link Morroco with UK.)
Or Texas powering the US. I remember some time back a provocotive statement saying just 10,000 sq miles (or was it kms) of solar farms in Texas would provide the US with all its primary energy needs. The response from denialists was that 10,000 sq miles was far to big an area to cover in solar farms to which the reply was that it wasn't so big when 10,000 sq miles of the US had been strip-mined for coal. And now that strip-mined coal was gone. Solar farms are somewhat more sustainable than strip-mining as a power supply. (Whether numbers are here correct, or were ever correct, I know not.)
Al@13,

Have you ever considered that "distributed energy generation" associated with "distributed energy storage" in the form of both static and mobile batteries might well prove to be easier to implement than centralised bulk storage and distribution of assorted gases?
MA Rodger @13 thanks for the input. I understand the component curves for solar and wind, but also know it is speculative and risky to extrapolate continued high growth rates out as far as you are. I am not an expert in this area, but still wonder about material supply limitations, such as might occur when we start ramping up EV production. The curves you show remind me a lot of early-adopter curves when the renewable energy was picking low-hanging fruit, with no need for storage, and no competition from major EV manufacturing. The future requires more difficult renewable installations, with storage, and competing for resources with EV manufacturing. Hence, the landscape of the future is likely much more difficult than the past, even with the broad expanses of the Sahara. Even if Texas has the requisite land available, politics could get in the way.
I am not trying to make specific predictions into the future, but rather to indicate to readers that despite the impressive-sounding numbers being reported, the renewable-energy revolution we've all been dreaming of has not really yet begun. Perhaps we are meeting the electric-growth demand, but likely no more. The real point to readers is that if we are to keep those solar and wind curves pointed skyward, that will likely only happen if voters opt for the kinds of policies we need to keep the curves rising. It may be that the impressive growth represents low-hanging fruit, and that future impressive growth numbers require much more willpower than we've collectively been called on to give.
So I accept your comments and those of PrzemStep as a need to revise the analysis, but I am cautious about using a component analysis based on 10-year growth as a solid indicator of where we will be headed. Perhaps use it as a best-case scenario, bordered by a more conservative approach such as I showed. In 5 years we can update and see which of the scenarios has been followed.
My point is not to be optimistic nor pessimistic; It is rather to indicate to readers that we need to do much better than we have if we are to meet the Paris goals by 2050. Otherwise readers might assume that with all of these curves currently headed skyward that we are well on our way, when in fact, it appears to me that we are just exiting the starting gate in a very long race.
At the risk of swerving conversation outside of Evan's central point, Jim Hunt's remark about distributed storage is quite important. Perhaps going down this path may serve as a illustration that Evan's analysis is likely subject to emergent features, even while as a snapshot saying "we need to do better, faster" it should fall on listening ears.
Electrification of automobiles is happening at a time when we're reevaluating the dependency we've formed on private automobile ownership, the broad negative effects of that.
A rethink and redo of our automobile accident is both independent of and connected with our climate problem. It's another heavy load of policy freight, among other matters.
It needed decades and installation of a sprawling infrastructure and built environment to fold ourselves into what have effectively become prosthetic devices, machinery many of us must use in order to feed, house and clothe ourselves and our dependents.
It will require many years working at our fastest rate to undo our elaborate chain of dependency on automobiles. This work will need to incorporate and address not only purely material matters but also the economic dislocation problems attached to decommissioning the sprawling labor footprint of the automobile economy. It's not an easy problem at all, as a systems matter.
Now, today, while we're only just beginning to deal with our lack of choice regarding automobile ownership and then on a continuum as we do deal that, we're going to continue to "need" a lot of automobiles.
As electrification of automobiles progresses down the economic food chain, we'll be enrolling private automobile owners as volunteers in subsidizing improved grid compatibility with renewal energy sources. This will be an automatic process, more or less. The "vehicle to grid" horse is pretty much already leaving the barn, and the "subsidies" by private owners are as a matter of reality pretty much guaranteed, given that we're not going to see abandonment of private vehicles in many years, or even several decades.
Something to think about when we hear strident calls for the unrealistic ambition of skipping from cars to no cars instantly, as part of dealing with our climate problem. Not only is that effectively impossible, but it might in engineering terms be a nonsensical trade.
Some background information here (open access, Nature Communications):
Electric vehicle batteries alone could satisfy short-term grid storage demand by as early as 2030
Doug@16, your's and Jim's comments certainly resonate as an efficient power model where electricity is generated and stored locally. I sense there are some hidden gremlins in this, because when a central power source distributes power broadly, they are averaging out the demand over a broad user area. When individuals plan for the needs of a single house, then shortfalls must be either suffered through, or supplemented by generators. And surpluses do not benefit neighbors in the dark, unless connected to a micro grid, which requires a new level of infrastructure change.
To me all of these sound plausible, but I sense that there are engineering and policy issues that will take time to resolve. As you note, the V2H model is easy, because we adapt one home at a time and solutions are already readily available. For some. But we are still in the early-adopter stage, so no idea how this will scale.
Incidentally, we are building a house and I want it to be all electric. But in the end, we are having to run gas to the house because neither our generator nor any of the battery systems on the market can run the ground-source heat pump. Or so we've been told by the geothermal company doing the install. We don't have the money to try risky solutions, so we are putting in a gas-fired boiler that can easily be run by a modest battery system or by our generator.
I trust that 10 years from now there will be better solutions for providing suitable backup for ground-source heat pumps, but apparently not at this stage. There's nothing better that I would like than to have a small battery system or a Ford Lightning truck running our heat pump in the middle of the winter when we lose power, but unfortunately our 6-year old Tesla does not have V2H. We are caught in a number of transitions. :-(
Tell me if I'm wrong, because we have not yet installed the gas-boiler nor the gas line to the house.
Evan, to your particular needs and thinking in terms of "improve averages," hopefully you have solar DHW in the picture? I seem to remember we've discussed this elsewhere, maybe. Anyway, a new-build is a perfect opportunity for laying pipework suitable for a "drain back" system, which if at all possible should be first choice of implementation, it being the least complex and most reliable available. Can you get all your hot water from the roof? No, likely not. However, in the case of our home which is massively shade-challenged and at 47N in a famously cloudy location we derive about 50% of our water heat gain from our drain back system, which is 2 square meters in size, uses only two wearing parts (bog standard hydronic circulator pumps, cheap) and no glycol etc., and is at 12 years of age with zero service.
With regard to vehicle-to-grid, I'm thinking very much of "to grid" specifically, not "to home." Vehicle-to-grid (V2G) promises to replace the spinning mass advantages and overall rapid response capability of combustion thermal generation plant, with its capacity relatively easily scaled via voluntary subsidy of storage by vehicle owners, plant operators leaning farther into "make hay while the sun shines" with energy capture systems such as PV, wind.
V2G will not be as efficient in terms of loss and material input as centralized storage systems, but it carries the unique advantage of self-subsidy that is to some extent invisible in our economics.
(V2G is in fact an argument for continued subsidy of vehicle electrification, if public policy wants to put its thumb on the scale of an already advantageous emergence.)
Again, lest it be lost in the discussion, link to a paper penciling out where numbers on V2G may lead, quite swiftly. 2030? Probably not. 2040? Significant effects practically guaranteed, given the direction we're heading with vehicle electrification. This will result in retired combustion thermal plants, measurable retirement of the storage problem, leading to an accelerating process of improvement as depth of the resource grows, skill of use and confidence grows. Arguably it will help to bend the curves you've highlighted.
Doug@18, Good stuff and it seems plausible. Let's hope EVs continue to penetrate the market and V2G with it. Unfortunately we have to sit by and watch, for now, because of our old EV that has no V2G capability. The cost of being an early adopter. :-(
Evan,
I agree with your reluctance to be 'too positive' about the transition away from fossil fuels.
I have seen many reports indicating successful resistance to approvals of new electricity transmission infrastructure and new renewable generation facilities. The Story of the Week and first two comments 2023 SkS Weekly Climate Change & Global Warming News Roundup #7 indicate that significant efforts to impede the development of renewable need to be overcome. That will require a significant systemic transition that dramatically reduces the success of efforts to delay the required rapid transition.
The Hamburg Climate Futures Outlook 2023 that is Story of the Week in 2023 SkS Weekly Climate Change & Global Warming News Roundup #5
robustly evaluated the current state of affairs and considers it very unlikely that the USA (and many other developed nations) will meet their current Paris Agreement NDCs. And those NDCs that are unlikely to be met are weaker than what is required to limit impacts to 2.0 C.
The Hamburg Outlook appears to be a more justified perspective than perceptions based on speculation about the continuation of past rates of renewable development. It can be easy to produce a significant rate of increase when starting with a small amount. It is harder to continue that rate of increase, especially when efforts to resist the renewable developments are also increasing.
One final point ... tragically there is very little discussion and leadership promotion of the benefits of limiting 'unnecessary energy consumption'. Admittedly there are many people who need increased energy consumption to live basic decent lives. But they are not the problem. Their per-capita energy demand will be small. The problem is the high energy consumers who believe that 'More consumption is necessary for them to enjoy their life' and everyone who aspires to develop to be Great over-consumers like them.
If unnecessary energy consumption was significantly and rapidly reduced the curtailing of fossil fuel use would be more rapid sooner.
Evan,
Your article on renewable energy is so bad that it is not even wrong. Your claim that rneewables will only generate 30% of new demand for the next decade is simply fossil propaganda. The IEA released their Electricity Market Report for 2023 on February 8. Carbon Brief has a summary of the IEA report here. According to Carbon Brief:
"Carbon Brief analysis of the IEA figures shows that it expects global electricity generation to rise by 2,493TWh between 2022 and 2025.
The IEA expects the growth in renewable generation to cover the vast majority of this total, growing by 2,450TWh. This is equivalent to 98% of the overall increase in global demand. my emphasis
Do you really expect that renewables will replace 98% new energy demand for three years and then they will completely stop building renewables? Obviously in 2025 the IEA expecte renewables to replace all demand and significant existing fossil power. Obviously after renewables replace all new demand they will begin to replace existing fossil power. The Carbon Brief article cites several analysis that come to similar conclusions except they have renewables replacing all demand earlier than the IEA. I note that the IEA has a long track record of underestimating how much renewable energy will be built in the near future.
Likewise your claim that renewables cannot generate more than 30% of all electricity was proven incorrect over 5 years ago when several countries exceeded that amount. According to The Motley Fool, using the latest year of data on the USA (fourth quarter of 2021 and the first three of 2022), ten states produced more than 30% of their electricity from wind and solar alone. 3 states produced over 50% and Iowa produced over 62%. The analysis that I have seen indicate that over 80% of all electricity can be easily produced by renewables using existing fossil peaking plants as storage. Since new batteries are cheaper than existing peaking plants, Utilities will be building out batteries as fast as possible to save money.
Your post is a superb example of mathturbation.
This blog post is over 10 years out of date. It should be removed from Skeptical Science. It contains no references to support the absurd calcualtions and conclusions.
Although they're not obvious, Evan's data sources are in the figure captions for figs. 1-3. Although OWIND is not specialized along the lines of IEA or the like, it's not pitching data ideally suitable for producing "industry propaganda." OWIND's renewables projections seem to be substantially (for the precision required here given Evan's thrust) in agreement with the IEA, which admittedly have been conservative (as has been so much else assessment in this rapidly evolving scene).
This brings us to figure 4, which shows quite a bit of daylight betwen overall demand increase and the contribution of renewables to that— back to the point Evan is making about percentages.
Michael, using the conservative IEA source (it's better to pick one, and IEA seems to be a benchmark for most discussion) and so that we can better understand: do you think the overall demand projection in fig 4 is incorrect, given that the renewables portion appears largely commensurate with IEA's projection?
I think Michael may have been typing in haste and dropped a clause when he wrote "Likewise your claim that renewables cannot generate more than 30% of all electricity was proven incorrect over 5 years ago when several countries exceeded that amount," because Evan did not make that claim.
Also and notably with regard to the latter remarks, Evan's analysis is speaking of global energy demand, supply. It's not an apples-apples critique to employ a handful of wind-heavy US states to form a comparison with what's under discussion, the global situation. Not saying Michael's wrong, but it would be better to employ broader geography— the same whole globe that is the subject of Evan's analysis. Otherwise we're talking about quite different things.
I'm pretty sure that whatever misunderstandings there are over this can easily be resolved with some collaboration. It's possible that Evan is wrong. That can more easily be established in an atmosphere of calm. I feel certain Evan would be fine with making his analysis better if such is shown necessary. Probably a good step would be to agree on data sources, make sure the subject being discussed is the same, and that what Evan is claiming is clearly understood.
Michael Sweet, thanks for your comments. As ubrew12@1 pointed out, I did not properly account for efficiencies in comparing electric generation from fossil fuels to determine, as you also point out, that renewables are expected to cover the growth in electric energy demand over the coming years. Others here have pointed out other analysis they would like to see in such a post. I will be redoing this post to clean up the points everyone has made here. As much as it hurts to be reminded of weaknesses in my analysis and writing, I will correct them.
None of this will change the basic points of this article, however, that percentages can hide real trends, and that renewable energy has yet to replace fossil fuels in any significant amount. Don't expect the fossil-fuel industry to just let that happen without a fight. One of my purposes in writing is to help the reader see the true magnitude of the problem we face so that they can properly gauage their response when they decide what to buy, and how to vote. Renewables meeting growing electric energy demand, instead of only 30% as I noted, may be a good thing in terms of our progress towards ramping down fossil-fuel use, but it is not a reason for too much celebration if we are to meet the objectives of the Parid Accord. We must do much much better. I want readers to be aware that we've done the easy work with renewables, and that what comes next will likely be much harder.
So thanks all for your comments. I have work to do to rewrite this paper. I will try hard to regain your respect with the rewrite.
Ubrew12, PrzemStep, and Michael Sweet. I placed a green-box message at the start of this post noting the error in my analysis and also noting that I will be redoing this post. Thank you for your comments and for helping maintain the high-quality readers expect to find at SkS.
Doug,
I saw the reference. The entire point of the OP is derived from figure 4 which is the construction of the author and has no reference. Others have pointed out why this figure is not even wrong. According to the IEA report, global electricity demand will be approximately 29,000 TWh in 2025 not the 160,000 TWh shown in figure 4. It appears to me that the author has added a factor of ten to the world energy demand which makes it appear that renewable energy cannot replace fossil fuels. I note that checking the carbon intensity of the EU would immediately show that renewables have significantly reduced the amount of carbon released.
It appears to me that MA Rodgers analysis of figure 4 is correct. Wind and solar energy, especially solar which is the cheapest energy in the world today (only wind can come close to solar), are increasing exponentially. Averaging in hydro, which for all practical purposes has not significantly changed in the past 10 years, makes an exponential increase turn into a small increase.
In the OP it states "it is very difficult, without using energy storage, to generate more than about 30% of the energy from renewables." In comment 8 says " Any of these projections are risky, because continued expansion of renewables beyond producing about 30% of power requires storage technology that must be deployed on a large scale and may compete for materials used in the transportation industry." The published literature has analyzed this and there are sufficient materials for the foreseeable future available. There are bottlenecks that have to be overcome as more renewable energy manfacturing facilities are built. The claim that renewables can only generate 30% of all electricity was shown to be completely incorrect years ago.
The International Energy Agency report that I cited covers the entire globe. I used USA data to address the 30% claim because the data was the first hit on my Google search and met the criteria of wind and solar only. It takes some time to find renewable energy data where the hydro has been left out. The 30% claim was made without any supporting data. Data proving the 30% claim is false anywhere shows the 30% claim is false for the entire world.
The OP is terrible doomerism. The IEA data clearly shows that wind and solar currently replace essentially all of the increase in energy demand worldwide. The question is: can the installation of wind and solar increase fast enough to meet climate goals. Last year over $1 trillion (!!!!!) was spent by governments to subsidize the fossil fuel industry and only about 1/3 of that was spent (primarily by the free market) on building new renewables. How can the politics be overcome?
Renewables including storage are much cheaper than fossil fuels. In addition, fossil pollution kills over 5 million people every year worldwide. Switching to renewables will make everyone healthier because ofreduced pollution. It has been shown that even 2% of EVs replacing internal comustion engines results in less hospital visits for asthma.
The Paris accords could still be met if most governments worldwide subsidized renewable energy as much as fossil fuels.
The OP should be removed from Skeptical Science since the conclusions are false. It will be used as an example of environmental doomerism.
Michael Sweet@26, you note,
"The claim that renewables can only generate 30% of all electricity was shown to be completely incorrect years ago."
I am not saying that renewables cannot generate more than 30%. I am saying that going beyond 30% on an annualized basis is difficult and will likely require storage. Figures that show renewables generating in excess of 30% on an annualized basis are, to my understanding, based on relatively short-term events and not averaged over an entire year.
I am not trying to propogate doomerism. Rather, I am trying to convey to the readers the task that lays ahead if we are to meet the goals of the Paris Accord. You note yourself the headwinds we face ramping down fossil-fuel use. Yes, I made a mistake in my analysis summarized in the first comment, and I will correct this. I will refine the rest of the text. But the main conclusions remain. Getting renewables to the point where they begin to supplant, and not supplement fossil fuels is still ahead of us and will not necessarily be easy. I read your comment as saying essentially the same thing.
Evan,
Renewable energy has only been the cheapest energy for about 5 years. For the first couple of those years renewables were only a little cheaper than fossil fuels and there were many locations where fossil was still cheaper. Now renewables are the cheapest everywhere. It takes 5-10 years to build most fossil plants. It takes years to build the factories that manufacture the panels and turbines for renewable energy. Your expectation that renewables will replace all fossil fuels instantly is misplaced.
We all need to work harder to get governments to stop subsidizing fossil fuels and make it easier to install renewabes. Environmental doomerism turne people off so that they do not take the actions necessary to turn the ship around before it hits the iceberg.
I am sorry, FIgure four shows 14,000 TWh of energy, similar to the IEA. I have difficulty reading series of zeros.
Michael Sweet@28, I am not suggesting that renewables will replace fossil fuels instantly. Rather, when the NYTs report impressive-sounding renewable-energy growth numbers, I want the readers to put those number into context and not get lulled into a false sense of success. We have a long way to go, and we need the readers to know that ramping down fossil-fuel use will not occur quickly, nor will it occur without putting pressure on governments. Regardless of how cheap renewables are, there is likely to be active lobbying for years to come to sustain the fossil-fuel industry. You note the we all need to work harder to get governments to stop subsidizing fossil fuels. I agree. We need readers to help apply pressure through their votes. What I want them to know is that although the renewable revolution is getting going, we are a long way from where we need to be and we need their help to get where we all want to be.
I will consider your's and all of the other comments in the rewrite. I am not trying to contribute to doomerism. Just trying to make sure people understand the full scope of the problem, because there is no time to waste in continuing the transition from fossil fuels to renewable energy.
Evan,
I think it would help to insert points along the line of your earlier post about the importance of watching the Keeling Curve for evidence that efforts to reduce climate impacts are being successful.
Examples of the type of items to include would be trends of:
And the future of the trends should only be speculated about based on evidence of effective helpful transitions of social drivers as presented in the Hamburg Climate Futures Outlook: The plausibility of a 1.5°C limit to global warming - social drivers and physical processes (Story of the Week in the 2023 SkS Weekly Climate Change & Global Warming News Roundup #5).
And the severity of the challenge can be highlighted by examples like the massive new coal plants in South Africa that are planned to be operated until the 2070s.
Blooberg report: Giant New Power Plants Undermine South Africa’s Emissions Pledge
Who will pay to compensate the investors and South Africans for their lost opportunity to profit and benefit from these facilities for 50 years?
That is an absurd question. The people who made a bad bet should lose their bet. But all the people making Bad harmful bets know that the history of humanity is loaded with examples of wealthy people, and powerful large groups of people, being well compensated when they lose an opportunity to benefit from being harmful to Others (because they won't stop being harmful until they feel they are adequately compensated for not being allowed to continue believing and doing what they developed a liking for).
A recent article in Carbon Brief says that:
"The Global Carbon Project points out that “the latest data confirm that the rate of increase in fossil CO2 emissions has slowed, from +3% per year during the 2000s to about +0.5% per year in the past decade”.
Newspaper reports suggest that the increase last year (2022) would have been about 3 times higher without new installations of renewable energy. That means that in 2022 2/3 of all CO2 increases were erased by new renewable energy insallations. The increase in CO2 over the past 5 years has dramatically decreased due to new renewable energy .
In order to resolve the AGW problem emissions of CO2 must dramatically drop. This has not yet started and all of us have to work hard to achieve this goal.
I remember 10 years ago when renewable energy was much more expensive than fossil energy and the situation looked compeltely hopeless. That is no longer the case. Renewable neergy is the cheapest energy and is being built out everywhere. Since it takes 5-10 years to plan and buid a fossil power plant there are still some plants being completed that were planned before renewable energy was cheapest.
Fossil interests have a lot of political power and are holding us back. In addition, it takes years to plan and build out the manufacturing plants for renewable energy. Everyone has to work to move renewable energy along.
The faster we convert to renewable energy the less damage we will have to deal with.