Climate Science Glossary

Term Lookup

Enter a term in the search box to find its definition.

Settings

Use the controls in the far right panel to increase or decrease the number of terms automatically displayed (or to completely turn that feature off).

Term Lookup

Settings


All IPCC definitions taken from Climate Change 2007: The Physical Science Basis. Working Group I Contribution to the Fourth Assessment Report of the Intergovernmental Panel on Climate Change, Annex I, Glossary, pp. 941-954. Cambridge University Press.

Home Arguments Software Resources Comments The Consensus Project Translations About Support

Bluesky Facebook LinkedIn Mastodon MeWe

Twitter YouTube RSS Posts RSS Comments Email Subscribe


Climate's changed before
It's the sun
It's not bad
There is no consensus
It's cooling
Models are unreliable
Temp record is unreliable
Animals and plants can adapt
It hasn't warmed since 1998
Antarctica is gaining ice
View All Arguments...


Username
Password
New? Register here
Forgot your password?

Latest Posts

Archives

Climate Sensitivity: The Skeptic Endgame

Posted on 2 March 2011 by dana1981

With all of the distractions from hockey sticks, stolen emails, accusations of fraud,  etc,. it's easy to lose sight of the critical, fundamental science.  Sometimes we need to filter out the nonsense and boil the science down to the important factors.

One of the most popular "skeptic" arguments is "climate sensitivity is low."  It's among the most commonly-used arguments by prominent "skeptics" like Lindzen, Spencer, Monckton, and our Prudent Path Week buddies, the NIPCC

"Corrected feedbacks in the climate system reduce climate sensitivity to values that are an order of magnitude smaller than what the IPCC employs."

There's a good reason this argument is so popular among "skeptics": if climate sensitivity is within the IPCC range, then anthropogenic global warming "skepticism" is all for naught.

As we showed in the Advanced 'CO2 effect is weak' rebuttal, a surface temperature change is calculated by multiplying the radiative forcing by the climate sensitivity parameter.  And the radiative forcing from CO2, which is determined from empirical spectroscopic measurements of downward longwave radiation and line-by-line radiative transfer models, is a well-measured quantity known to a high degree of accuracy (Figure 1).
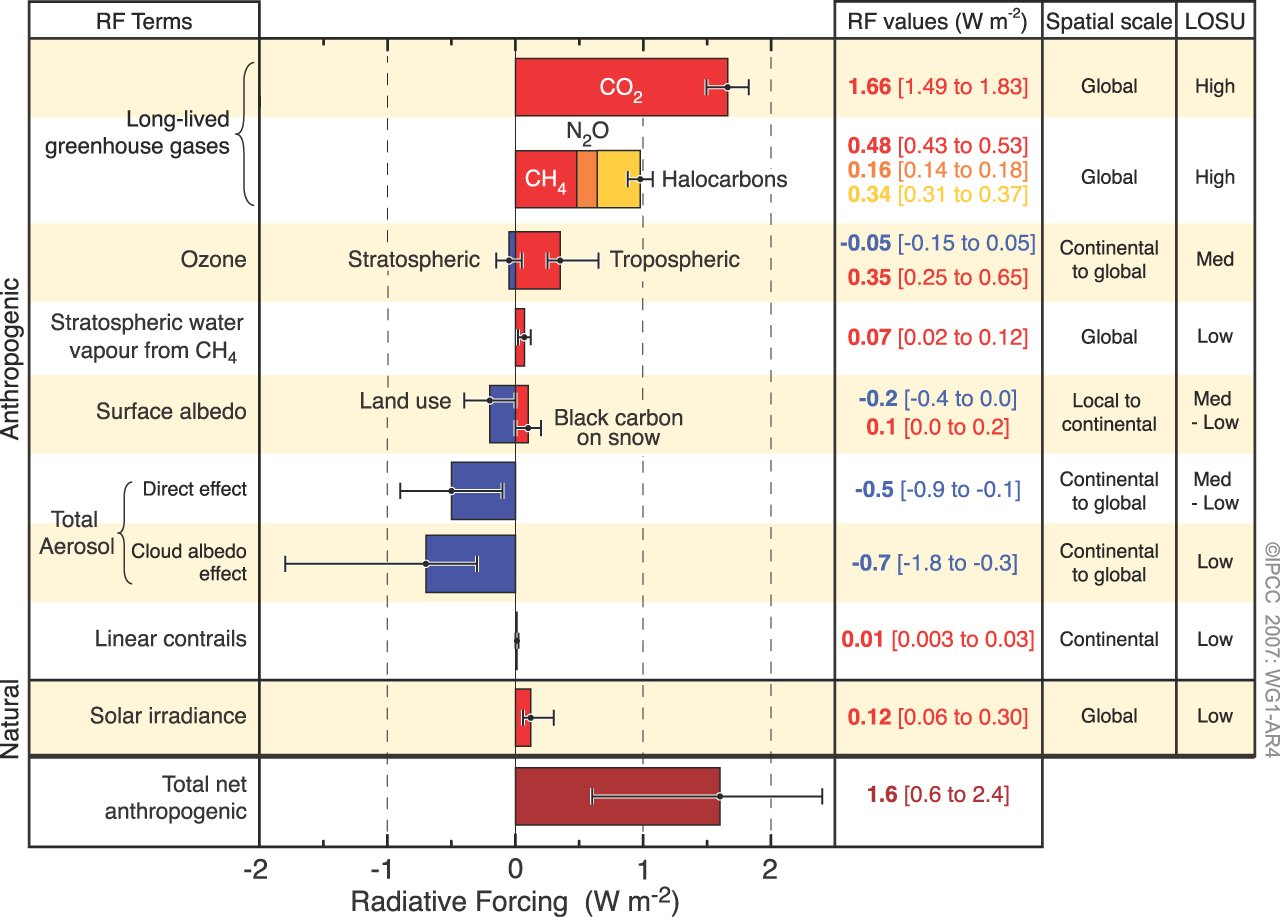
Figure 1:  Global average radiative forcing in 2005 (best estimates and 5 to 95% uncertainty ranges) with respect to 1750.  Source (IPCC AR4).

So we know the current CO2 radiative forcing (now up to 1.77 W/m2 in 2011 as compared to 1750), and we know what the radiative forcing will be for a future CO2 increase, to a high degree of accuracy.  This means that the only way CO2 can't have caused significant global warming over the past century, and that it will not continue to have a significant warming effect as atmospheric CO2 continues to increase, is if climate sensitivity is low.

Global Warming Thus Far

If the IPCC climate sensitivity range is correct, if we were to stabilize atmospheric CO2 concentrations at today's levels, once the planet reached equilibrium, the radiative forcing would have caused between 0.96 and 2.2°C of surface warming with a most likely value of 1.4°C.  Given that the Earth's average surface temperature has only warmed 0.8°C over the past century, it becomes hard to argue that CO2 hasn't been the main driver of global warming if the IPCC climate sensitivity range is correct. 

For the equilibrium warming from the current CO2 radiative forcing to be as small as 0.5°C, the climate sensitivity could only be half as much as the lower bound of the IPCC range (approximately 1°C for a doubling of atmospheric CO2).  In short, there are only two ways to argue that human CO2 emissions aren't driving the current global warming.  In addition to obviously needing some 'natural' effect or combination of natural effects exceeding the CO2 radiative forcing, "skeptics" also require that either:

  1. Climate sensitivity is much lower than the IPCC range.
  2. A very large cooling effect is offsetting the CO2 warming.

The only plausible way the second scenario could be true is if aerosols were offsetting the CO2 warming, and in addition some unidentified 'natural' forcing is having a greater warming effect than CO2.  The NIPCC has argued for this scenario, but it contradicts the arguments of Richard Lindzen, who operates under the assumption that the aerosol forcing is actually small

In the first scenario, "skeptics" can argue that CO2 does not have a significant effect on global temperatures.  The second scenario requires admitting that CO2 has a significant warming effect, but finding a cooling effect which could plausibly offset that warming effect.  And to argue for continuing with business-as-usual, the natural cooling effect would have to continue offseting the increasing CO2 warming in the future.  Most "skeptics" like Lindzen and Spencer rightly believe the first scenario is more plausible.

Future Global Warming

We can apply similar calculations to estimate global warming over the next century based on projected CO2 emissions.  According to the IPCC, if we continue on a business-as-usual path, the atmospheric CO2 concentration will be around 850 ppm in 2100.

If we could stabilize atmospheric CO2 at 850 ppm, the radiative forcing from pre-industrial levels would be nearly 6 W/m2.   Using the IPCC climate sensitivity range, this corresponds to an equilibrium surface warming of 3.2 to 7.3°C (most likely value of 4.8°C).  In order to keep the business-as-usual warming below the 2°C 'danger limit', again, climate sensitivity would have to be significantly lower than the IPCC range (approximately 1.2°C for a doubling of atmospheric CO2).

Thus it becomes very difficult to justify continuing in the business-as-usual scenario that "skeptics" tend to push for, unless climate sensitivity is low.  So what are the odds they're right?

Many Lines of Evidence

The IPCC estimated climate sensitivity from many different lines of evidence, including various different instrumental observations (AR4, WG1, Section 9.6.2).

"Most studies find a lower 5% limit of between 1°C and 2.2°C, and studies that use information in a relatively complete manner generally find a most likely value between 2°C and 3°C…. Results from studies of observed climate change and the consistency of estimates from different time periods indicate that ECS [Equilibrium Climate Sensitivity] is very  likely larger than 1.5°C with a most likely value between 2°C and 3°C…constraints from observed climate change support the overall assessment that the ECS is likely to lie between 2°C and 4.5°C with a most likely value of approximately 3°C.”

The IPCC also used general circulation models (GCMs) to estimate climate sensitivity (AR4, WG1, Chapter 10),

“Equilibrium climate sensitivity [from GCMs] is found to be most likely around 3.2°C, and very unlikely to be below about 2°C…A normal fit yields a 5 to 95% range of about 2.1°C to 4.4°C with a mean value of equilibrium climate sensitivity of about 3.3°C (2.2°C to 4.6°C for a lognormal distribution, median 3.2°C)”
Combining all lines of evidence, the IPCC concludes (emphasis added):
“the global mean equilibrium warming for doubling CO2...is likely to lie in the range 2°C to 4.5°C, with a most likely value of about 3°C. Equilibrium climate sensitivity is very likely larger than 1.5°C.

IPCC AR4 WG1 Chapter 10 also contains a nice figure summarizing these many different lines of evidence (Figure 2).  The bars on the right side represent the 5 to 95% uncertainty ranges for each climate sensitivity estimate.  Note that every single study puts the climate sensitivity lower bound at no lower than 1°C in the 95% confidence range, and most put it no lower than 1.2°C.
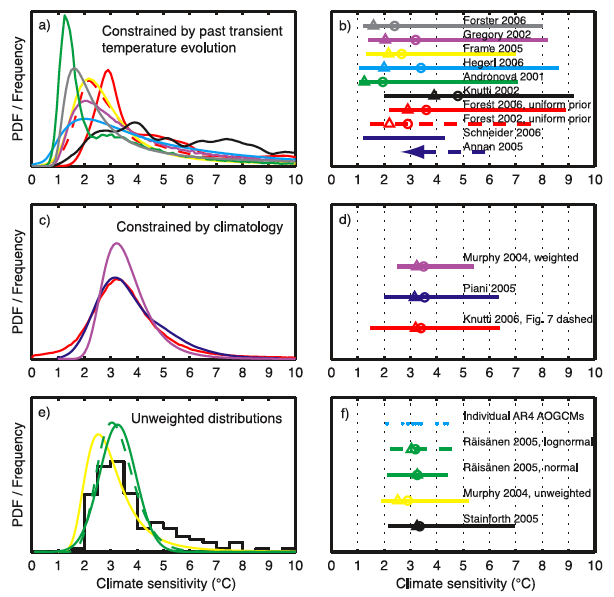
 

Figure 2: IPCC climate sensitivity estimates from observational evidence and climate models

Knutti and Hegerl (2008) arrive at the same conclusion as the IPCC, similarly examining many lines of observational evidence plus climate model results (Figure 3).
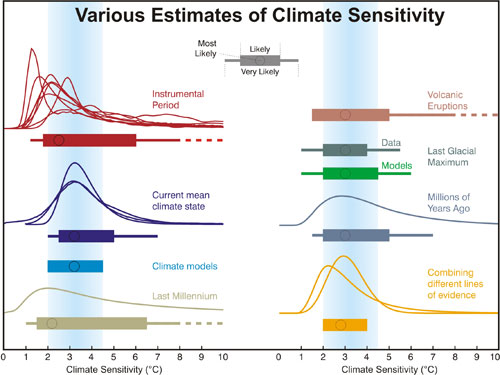
Various estimates of climate sensitivity

Figure 3: Various estimates of climate sensitivity (Knutti and Hegerl 2008).

Game Over?

To sum up, the "skeptics" need climate sensitivity to be less than 1.2°C for a doubling of CO2 to make a decent case that CO2 isn't driving global warming and/or that we can safely continue with business-as-usual.  However, almost every climate sensitivity study using either observational data or climate models puts the probability that climate sensitivity is below 1.2°C at 5% or less.

The bottom line is that the 1.77 W/m2 CO2 forcing has to go somewhere.  The energy can't just disappear, so the only realistic way it could have a small effect on the global temperature is if climate sensitivity to that forcing is low.

Thus it's clear why the "skeptics" focus so heavily on "climate sensitivity is low"; if it's not, they really don't have a case.  Yet unless estimates from climate models and every line of evidence using numerous lines of empirical data are all biased high, there is less than a 5% chance the "skeptics" are right on this critical issue. 

I don't like those odds. 

0 0

Printable Version  |  Link to this page

Comments

1  2  Next

Comments 1 to 50 out of 61:

  1. Thank you so much for referring to "skeptics" in quotes. They act like purposefully cultivated disinformation campaigners. But so called "skeptics" says it OK. But none-the-less, by addressing the specifics of the science issues - you do a great service. Thank you.
    0 0
  2. Since being on this site and reading all the bits and pieces coming up, everything reads that CO2 is forcing global warming. Mostly from modeling which can only translate data put in by human effort. It cannot predict with infinite reliability future events as nothing is constant. I have always been of the belief that CO2 increase was a direct result of warming, hence why Co2 has continued to increase for a period when cooling came into operation. Once land masses were refrozen then the CO2 would drop and continue to drop even when warming again began to increase. So surely there must be another factor that is not being factored into the equation or modeling? Why can neither side come up with a definitive answer that would satisfy the masses and destroy governments greed for wanting to tax a probability.
    0 0
    Moderator Response: Then you need to read more than "bits and pieces." Start with "Models are unreliable," "CO2 lags temperature," "There’s no correlation between CO2 and temperature," "CO2 is not the only driver of climate," and "The science isn’t settled."
  3. Sorry did not finish. Or is it a fact and not a probability. I recognize pollution is a problem of mankind and something needs to be done, but CO2 is not necessarily a pollutant as it has many benefits for sustaining life and plant growth.
    0 0
    Moderator Response: See "CO2 is not a pollutant," and comment further there, not here.
  4. Since CO2 levels were 310 ppm in 1950. It was only after 1960 that the CO2 levels started to significantly increase. The claim that warming prior to the increase in CO2 levels is caused by CO2 levels is incoherent. Since more than half of the warming in the past century took place before 1950 I see a flaw in your argument that CO2 has caused all the warming. There was also no significant trend in global temperature from the 1958-1995 while CO2 levels in the same period increased from 310-360ppm. The early date is used only because that is the start of reliable CO2 data. http://theinconvenientskeptic.com/wp-content/uploads/2011/03/CO2-1958-1996.png No temperature trend for almost 40 years while CO2 was climbing. There was significant warming after the 1998 El Nino and there was warming in the 1930's when CO2 was low and stable. But the period that showed the most change in CO2 did not show warming. That shows an interestingly low climate sensitivity to CO2.

    0 0
    Response:

    [dana1981] First of all, the global average surface temperature has increased 0.8°C over the past century, and almost 0.6°C since 1970.  So the claim that "more than half of the warming in the past century took place before 1950" is factually incorrect.  As the link above shows, the claim of "no significant trend in global temperature from the 1958-1995" is also factually incorrect.

    Unfortunately these factually incorrect statements led you to an incorrect conclusion.

  5. I'm sure others will address some of the other issues in the comments above, but I'd like to address this one: "no significant trend in global temperature from the 1958-1995" Well, TIS, this graph [woodfortrees.org] suggests there's been plenty of warming from 1958-1995. It's even more interesting when you increase the time range to 1955-2000. You get to see that 1958 was a particularly warm year, for the 1950s, and that 1995 was an average-to-cool year for the 1990s. Has there been some cherry picking going on?
    0 0
  6. Oh, and nice article, Dana - well written & clear. I think it illustrates well that the 'skeptic' position re sensitivity is a very weak one, at best.
    0 0
  7. Bern, If you have CO2 monthly data earlier than March of 1958 I will gladly use it, but since it was 315 ppm in March of 1958 and the previous 50 years prior to that showed little CO2 increase it is a safe to assume that the rate of CO2 increase prior to 1958 is lower than since then. As for the temperatures, if I use your same source, the period from 1908-1958 shows more warming than the years I used and clearly the CO2 was not increasing at the same rate. If you are arguing that the CO2 increase from 305 to 310 caused more warming than the jump from 310 to 360, that is a different argument though.
    0 0
  8. HuugyPopsBear #2, The relationship beween CO2 and global warming is not solely based on modeling. The equations connecting CO2 and IR radiation hve been well understood and dmeonstrated for many years. They form the basis for the operation of devices like CO2 lasers and air-to-air heat-seeking missiles. If the rise in CO2 in the atmosphere had NOT been accompanied by temperature rise, physicists would be questioning thir understanding of basic radiation physics. If you search the Skeptics Arguments you will find answers to your points on CO2 lagging temperature, and CO2 as a plant food.
    0 0
  9. Incovenient Skeptic: Here is a table of annual CO2 levels from 1800, with 50 year values back to 1000: Link. It also gives CH4 levels. If you need monthly values, then interpolation (with an annual profile superimposed if necessary) should give you a good estimate. I could help you in preparing such a file. However as you know if you want to attribute temperature changes over the 19th/20th century you don't just need CO2 and CH4 - you will also want to take into account the variation in insolation (and possibly aerosols).
    0 0
  10. I have some trouble with the concept of "unique" "equilibrium sensitivity" : if there were such a quantity, shouldn't the average global temperature follow very closely (within a relaxation timescale, which is supposed to be short if the current 30-years increase is supposed to be linked with an increase of radiative forcing) the global forcing ? so shouldn't we expect the temperature curve to closely follow, for instance, the milankovitch cycles? well, there is an obvious correlation with astronomical parameters, but nothing very close to them. Why ?
    0 0
  11. Huggy Pops bear #2 A definitive answer is impossible as you cant put the planet in a laboratory. Its really that simple. All you can get is probabilities. Modelling is a substitute for not being able to put the planet in the lab. Its frustrating but thats the reality, and you just have to live with it or risk the ruin of the planet.
    0 0
  12. Kevin, I have plenty of annual data, but imagine if I tried to interpolate monthly data with the annual variation included. In addition I strongly doubt that accuracy of the CO2 data you linked between 1937-1950. I struggle with the idea that there was no increase in CO2 during that period. There was enormous production during that period with massive quantities of CO2 released. Every production facility in the world was working at maximum capacity for portions of that time. I do appreciate the link though. Insolation changes over the past 100 years should be warming the winters and reducing the temperature difference between the poles and the equator as the tilt is very slowly decreasing.
    0 0
  13. TIS #12, Surely you exaggerate the "massive quantities" of CO2 released in 1937-1950. The world economy was far smaller than it is now - heavy industrial production was largely confined to a few countries in Europe, and to the US. The late 1930s saw a resurgence of depression in the US. That was reversed in the war, but the latter end of 1939-45 saw total devastation of German and Eastern European industry. Britain was still under rationing until the late 1940s. BTW, I though ice cores gave an accurate picture of CO2 levels prior to recorded observations from 1957 or so. Getting the data in this video should help Visualizing the History of CO2
    0 0
  14. 3. HuggyPopsBear "I recognize pollution is a problem of mankind and something needs to be done, but CO2 is not necessarily a pollutant as it has many benefits for sustaining life and plant growth." There is nothing which is necessarily a pollutant. Things are just pollutants when they are in the system in such quantities as to cause harm in some way. Noise and light are not necessarily pollutants but we're quite happy that they can be polluting. Equally many heavy mettles are more clearly pollutants but exist all over the show in small quantities. It's an oft used fallacy that because something is required for life it can't be a polluting; and even if, to some degree, more is better - it doesn't follow that to a higher degree, much much much more is better. Sure CO2 is required for life and, to some degree, more CO2 is good for plants directly. That makes no difference to it's impact on the climate and overall environment! Same's true for oxygen. We - and most animals - need it. To some degree we can perform a little better with a bit more. However we can't use more than our blood can carry on the one hand; and on the other hand oxygen is extremely dangerous and our bodies have to work very hard to avoid being harmed by it. You really have to understand the system under consideration to understand pollution! As for your previous comment "tax a probability" - really? Most countries have armies which are not fully destroyed, because there's a probability the'll be needed or a probability they will deter aggression. Many people have health insurance - and many countries have compulsory health insurance - at a level based on the probability of getting ill, with the impact of illness factored in. etc. etc. Finally, as for "governments greed" ... who knows - certainly not the arctic ice. It doesn't know whether your or my government is greedy or not, it just keeps on melting...
    0 0
  15. TIS-there are studies that shows an 80% correlation between solar activity & temperature variation for the period of 1900-1950. For the period of 1950-2000, that correlation fell to less than 40%. This drops to less than 20% for the period of 1980-2000. Put another way-sunspot numbers rose significantly during the first half of the 20th century, causing a relatively slow rise in global temperatures over this period. In the second half of the 20th century, sunspot numbers have remained either static-or have fallen-yet temperatures have risen *faster* than in the first half of the century.
    0 0
  16. Shoy, A few data points on a video are not convincing that WWII had no impact on CO2 levels. Regardless, there is little temperature rise from the start of monthly CO2 data until the 1990's. CO2 did rise a great deal in that same period of time.
    0 0
  17. #15 Marcus, Solar activity (I assume you mean sunspots) has never really been too convincing to me. I have run plenty of comparisons, but it always seems weak. Some of that poor correlation you refer to is high activity with low temperature. If the activity in the 1938 caused the warm 1940 period, then the peaks in the 50's and 60's should have caused more. The 1956-1960 sunspot activity might be the most active period in thousands of years, but the temps were not high. That is poor correlation.
    0 0
  18. Ah, TIS, I see that your "skepticism" is extremely selective. So because a few short years don't fit your "expectations" of what CO2 should have done-in spite of the fact that it can be easily explained by the fact that the bulk of the planet's 2.5 billion people didn't even *have* electricity at that time-or cars-& at least half of the remainder were off fighting a war in foreign countries. As has already been pointed out, the fact that most of Europe's economy was constrained by *rationing* is a *known* *historical* *fact*. As to your other claim, it's a load of rubbish. In spite of an overall decline in sunspot activity for the period of 1961-2000, temperatures rose at a rate of almost +0.12 degrees per decade. By contrast, when the rise in CO2 was a lot smaller, but sunspot numbers were rising extremely quickly (1901-1940), temperatures warmed at a rate of only +0.08 degrees per decade. How do explain that if sensitivity to CO2 is so low-or is this another claim made by "skeptics" that can't be backed up by hard facts?
    0 0
  19. TIS, to be honest, none of your claims to date have been very convincing to me. I've checked all your claims, & found them *all* to be wanting. See, TIS, I can dismiss your claims without proof just as easily as you. Fortunately, though, I *Have* provided proof of what a load of rubbish most of your claims are-you still haven't provided a single shred of *evidence* to back your claims-which puts you squarely in the same category as "Lord" Monckton.
    0 0
  20. So, to sum up The Inconvenient Skeptics technique. Make a number of ludicrous, unfounded claims then-when people point out how they're clearly *wrong*, dismiss it all with a trite "I don't find that convincing"-without ever needing to provide a shred of evidence to back that claim. What does he think this is, WUWT?
    0 0
  21. TIS #4 It's nearly a Gish Gallop, but addressing only this paragraph: Since CO2 levels were 310 ppm in 1950. It was only after 1960 that the CO2 levels started to significantly increase. I assume you consider a 10% increase (280-310ppm) "non-significant". Then the "significant increase" of CO2 after 1960 is considered to have happened after the significant increase of temps that began in the 70s. It's quite a feat to compress so many unsubstantiated claims in such a small text.
    0 0
  22. 10, me.. "armies which are not fully destroyed" should, of course have been "armies which are not fully deployed"
    0 0
  23. It seems clear that TIS is cherry-picking data - choosing a period for examining temperature rise that starts in an abnormally warm year (the "1998 of the 50's", looking at the chart) and ending on a moderately cool one. It looks like exactly the same technique used by 'skeptics' to argue there has been no warming since 1998, and by a certain ex-astronaut to argue there's more arctic sea ice than there was 20 years ago... Others have touched on the other erroneous assumptions in TIS' posts - assuming that CO2 is the *only* driver of climate, for example. But all this is off-topic to this post (apart from the common thread of denying reality)...
    0 0
  24. Gilles at #10: if you look at Dana's Figure 1 in the article, you'll see there are a number of different factors that can influence climate in quite significant ways. There's no reason why all of these should react similarly to Milankovic forcing - indeed, some of them (such as aerosols) are depending entirely on other sources, such as volcanism. It's the combination of all these, the total net forcing, that determines how the planetary climate responds to Milankovic forcing. For example, this SkS post explains how the additional CO2 we're dumping into the atmosphere may well over-ride the Milankovic forcing for tens or even hundreds of thousands of years. When climate scientists look at how the planetary climate reacted to Milankovic forcing in the past, and try to predict how it will react in the future, they need to take all these other factors into account.
    0 0
  25. thank you, bern, but this is still a little bit puzzling : how can you measure a sensitivity in the past if many ill-known factors contribute "significantly" to the forcing ?
    0 0
  26. Gilles - Actually, many of the factors are reasonably well known. Ice cores record plenty of information; CO2 levels, aerosols, local temperatures, proxies for solar activity, etc. The Milankovic forcings are tied to orbital dynamics, and those are predictable for millions (if not billions) of years into the past and future. I suggest that a look at the Climate Sensitivity is low/How Sensitive is our climate page might be useful. The intermediate version of the page points to a dozen or so separate papers estimating climate sensitivity in various ways, and the advanced version graphically shows the results they got.
    0 0
  27. The Inconvenient Skeptic, Where do your temperature data in the link from 4 come from? To me, it seems like they have been detrended.
    0 0
  28. Very nice article, and, as always on SkS, the comment section is "interesting". My guess is that we'll be seeing much more of this argument that sensitivity is conveniently (for the deniers) low. The simple fact is that as real world events and scientific advances keep piling up not just evidence that ACC works exactly as we currently understand it, but evidence that's painfully clear to non-experts, the deniers will increasingly fall back on sensitivity. The fact that this argument leads to contradictions among their various positions and that it requires them to come up with other explanations for observed phenomena won't stop them. Such logical issues haven't been a hindrance in the past, after all.
    0 0
  29. Lou - thanks. Agreed, I think "sensitivity is low" will become the go-to "skeptic" argument, because frankly there's just no other way to argue that we shouldn't reduce CO2 emissions. And the refusal to support CO2 emissions reduction measures is the basis for almost all global warming "skepticism".
    0 0
  30. Dana, Thanks. Keep at it-- the "skeptics" have nothing but obfuscation and it shows. Typo first line , second para (see bolded text below): "One of the most pAropular "skeptic" arguments is..."
    0 0
  31. KR : well , on the other hand, simple inspection of the Fig 2 in this post shows a scattering of almost a factor 10 in the estimates. So what's your definition of a "reasonably well known factor" ? I doubt that any of the paleo records you are citing, that are essentially LOCAL, can give an accurate estimate of the global forcing. Aerosols and clouds are ill known, even now, I doubt very much that they are much well constrained hundreds of thousands of years ago. On average, I am not very comfortable with a general feeling of "well, of course, there is much scattering and a lot of unknown factors, but still everything is pretty well constrained". The issue I see is that IF natural, unforced variability is important , it will generally lead to overestimate the sensitivity. But excluding an unforced variability is very difficult just because you have no way of knowing if it is unforced or not - so by making the assumption that everything is due to forcings, you will end up with a figure, which will be always biased to high values. Then the statistical analysis of "how many studies show that the figure is above X" will also be biased as well. Is it not kind of an issue ? another issue is that the average forcing is by far not enough to define the temperature. During the northern summer, the Earth is farther away from the sun than during the southern summer (orbit ellipticity). But the averaged temperature is higher - because there are more land in the northern hemisphere. So if you take the basic definition of the sensitivity, it is actually NEGATIVE. In principle you could deal with that with averaging over a long period - but then you're facing the problem of possible long term changes in a series of factors (oceanic circulation, land coverage, and so on..).
    0 0
  32. "Lou - thanks. Agreed, I think "sensitivity is low" will become the go-to "skeptic" argument, because frankly there's just no other way to argue that we shouldn't reduce CO2 emissions. And the refusal to support CO2 emissions reduction measures is the basis for almost all global warming "skepticism"." I disagree with that, Dana. There are at least two other possible reasons for arguing that we shouldn't reduce CO2 emissions, even with a 2°C sensitivity. A) that the amount of fossil fuels that we can really extract is far below most of SRES scenarios and that CO2 levels will never reach dangerous levels anyway. B) that even if some dangers are real, they do not exceed by far the wealth brought by the fossil fuels, and that mitigation is still a better choice. Just as we accept the casualties of car crashes, or a reasonable amount of pollution, or even we do not forbid the sale of alcohol or tobacco. Of course, this is not climate science - but it is still relevant to the public debate.
    0 0
  33. Gilles #33 About this part: A) that the amount of fossil fuels that we can really extract is far below most of SRES scenarios and that CO2 levels will never reach dangerous levels anyway. Now that's really good news. Can you give me some reference of this and make my day? Of course, that makes all the renewable energy stuff even more urgent, but still.
    0 0
  34. Gilles @33, We have mountains of coal to burn, mountains. We can easily realize the most optimistic scenarios, all of which bring us very close to +2 C warming, and right now we are following one of the most aggressive trajectories. Please provide evidence from a reliable and reputable source that we cannot. And even if, in the very unlikely event CS were less than +2 C, consider this: 1) The impact of ocean acidification on the ocean food web on which a huge portion of the population depends. See appropriate threads (and links) at SkS. 2) The fact that, on our current path, we will easily double CO2 before 2100. So doubling CO2 becomes arbitrary. There are other good reasons for reducing our GHG emissions, but I will leave it there for now.
    0 0
  35. Gilles - "well, on the other hand, simple inspection of the Fig 2 in this post shows a scattering of almost a factor 10 in the estimates. So what's your definition of a 'reasonably well known factor'? " Looking at that same graph, and at the numbers, you will note that the lower end of the range of 2-4.5°C is very solid, very little chance of the actual values falling below that level - it would contradict just about all the data we have. We know about alligators near the Arctic circle and the "snowball Earth" - the data sets certain minima on what climate sensitivity could be. The high end is less certain - and I'm not going to take uncertainty indicating very high sensitivities as a good sign. There are definitely uncertainties in the data, although I believe you are overstating them - lots of lines of evidence support paleo reconstructions of CO2, solar activity, aerosol levels, temperatures, etc. And there are few issues indeed with Milankovic forcings. "The issue I see is that IF natural, unforced variability is important , it will generally lead to overestimate the sensitivity. But excluding an unforced variability is very difficult just because you have no way of knowing if it is unforced or not - so by making the assumption that everything is due to forcings, you will end up with a figure, which will be always biased to high values. " I have to seriously disagree. You seem to be arguing that natural forcings or feedbacks (outside the ones we know of, or poor measurements? Not clear...) will lead to overestimation? But that's only true if for each of the studies there is an unaccounted for forcing that adds to the effect. It's just as (un)reasonable to argue that said unmeasured forcings subtract from it. If there are poor measurements, they only widen the range, not bias it.
    0 0
  36. Giles #31 - you're confusing "scattering factor" with 95% confidence range. We are 95% confident that climate sensitivity lies above about 1.2°C. As KR #35 noted, almost all of the uncertainty you refer to is on the high end. So all you're arguing is that we can't rule out a scenario where the results of business-as-usual could be really, really bad. However, as I also previously discussed, Annan and Hargreaves put the sensitivity upper bound at 4.5°C with 95% confidence. If you believe their results, climate sensitivity is quite well-constrained. Giles #32 - as Albatross noted (#34), unless you want to argue that we have far less coal reserves than we currently believe, the "we will run out of fossil fuels" argument is totally unrealistic. And Alexandre noted in #33, if that is the case, we'd darn well better start transitioning off of fossil fuels ASAP. I've addressed your point B previously by showing that the benefits of reducing carbon emissions outweigh the costs several times over. Technically I suppose you're right that it's an argument "skeptics" could make. Perhaps I should have specified "plausible" arguments.
    0 0
  37. Just as an FYI, someone also posting by the name "Gilles" has been clogging up threads over at Real Climate for over a year now. Not saying that this "correlation" means anything. In the wake of the Poptech, damorbel and RW1 threads, just wanted to point it out. The Yooper
    0 0
  38. Alexandre and Albatross with pleasure : look towards people of ASPO, such as Aleklett, Laherrère, Rutledge http://www4.tsl.uu.se/~aleklett/powerpoint/20100609_Aleklett_kva.pdf http://rutledge.caltech.edu/ http://aspofrance.viabloga.com/files/JL_IPCCscenarios09.pdf they say all approximately the same : IPCC scenarios are basically grossly overestimating the size of fossil resources, especially oil and gas. And that "current path" is simply untenable, so extrapolations aren't justified. Note that the amount of "official reserves" is not criticized - the only point is just that IPCC doesn't really care of proven reserves, it assumes that expensive, unconventional resources could be extracted at the same pace or even a higher pace than the current conventional ones - which isn't justified by any real facts. If peak oil happens soon, which is more and more likely, then all SRES scenarios will fail on this point. KR : "Looking at that same graph, and at the numbers, you will note that the lower end of the range of 2-4.5°C is very solid, very little chance of the actual values falling below that level - " I disagree with you : unaccurate data and models are never "very solid", even on a statistical point of view. They can be prone to systematic biases. As an example, models of the sun can explain a lot of things, but not the 11-years cycle. That is, if you believe in computer models, they hardly describe activity cycles, and when they do, they are much shorter than expected. The 11-year cycle can be dismissed on a "statistical study" of the models - yet it does exist. In the same way , supernovae never explode in numerical models. That's a pity, but supernovae don't exist in the world of numerical computations. Based on numerical experiments, they are statistically impossible. Yet they do exist. So I am personnally rather reluctant in front of a "set of inaccurate measurements". "You seem to be arguing that natural forcings or feedbacks (outside the ones we know of, or poor measurements? Not clear...) will lead to overestimation?" No, I am talking about other causes than forcings and feedbacks - causes of change that are due to something else, changes in the oceanic circulation, atmospheric convection patterns, and so on - that can lead to a variation of the average temperature without a change of the average forcing.

    0 0
    Response:

    [dana1981] You are of course free to disagree, but as shown in the article, the conclusion that climate sensitivity is unlikely below 2°C and very unlikely below 1.5°C is supported by virtually every study on the subject using both empirical observational data and climate models.  As mentioned in the article, you're basically arguing for the scenario in which every single line of evidence is wrong, because they're all very consistent on the climate sensitivity lower bound.

  39. The Inconvenient Skeptic at 17:49 PM on 2 March, 2011 , Include a 12-month smoothing in your graphic please and also answer why you decided to end in 1996 considering the volcanic aerosol loading of the atmosphere in 1992,1993 and 1994 were very important?
    0 0
  40. The Inconvenient Skeptic at 22:14 PM on 2 March, 2011 You're also ignoring the cooling effect of sulphate aerosols which have a negative radiative forcing. But no, continue cherry picking as much as you like.
    0 0
  41. Daniel , thank you for noticing my contributions to RC - this is not a coincidence. Now you're free to answer my remarks, of course. Dana : you're confusing "scattering factor" with 95% confidence range. We are 95% confident that climate sensitivity lies above about 1.2°C. As KR #35 noted, almost all of the uncertainty you refer to is on the high end. So all you're arguing is that we can't rule out a scenario where the results of business-as-usual could be really, really bad. However, as I also previously discussed, Annan and Hargreaves put the sensitivity upper bound at 4.5°C with 95% confidence. If you believe their results, climate sensitivity is quite well-constrained." As I said, this kind of reasoning, applied to other problems, would conclude with a very high confidence level that solar cycles don't exist and supernovae don't explode. " Giles #32 - as Albatross noted (#34), unless you want to argue that we have far less coal reserves than we currently believe, the "we will run out of fossil fuels" argument is totally unrealistic. And Alexandre noted in #33, if that is the case, we'd darn well better start transitioning off of fossil fuels ASAP." So, if coal resources are reliable, so are oil resources, and you're also claiming that it is very unlikely that oil production would peak before all SRES scenarios predictions ? I think that's an interesting point that will be tested in the near future. How much are you ready to bet that oil production will exceed 100 Mbl/d , as all SRES scenarios predicted? I'm interested. But of course, I agree that we should try replacing fossil fuels ASAP - I'm just not really sure it is feasible. " I've addressed your point B previously by showing that the benefits of reducing carbon emissions outweigh the costs several times over. Technically I suppose you're right that it's an argument "skeptics" could make. Perhaps I should have specified "plausible" arguments." The real cost is not the cost of replacing fossil fuels by something else. It is in preventing the use of the spare fossil fuels for somebody else -especially the poorest people who need them the most. How far can you justify that fossil fuels should never be extracted even if poor people are starving juste on the above ground? that's not a virtual question, the development of China has pulled hundreds of million of people out of absolute poverty - but to my knowledge it has been achieved only through the use of fossil fuels.
    0 0
    Moderator Response: [Daniel Bailey] Time to establish some ground rules, then. Let me first start by saying Welcome to Skeptical Science! There is an immense amount of reference material discussed here and it can be a bit difficult at first to find an answer to your questions. That's why we recommend that Newcomers, Start Here and then learn The Big Picture. I also recommend watching this video on why CO2 is the biggest climate control knob in Earth's history. Further general questions can usually be be answered by first using the Search function in the upper left of every Skeptical Science page to see if there is already a post on it. Or you can search by Taxonomy. If you still have questions, use the Search function located in the upper left of every page here at Skeptical Science and post your question on the most pertinent thread. Remember to frame your question in compliance with the Comments Policy and lastly, to use the Preview function below the comment box to ensure that any html tags you're using work properly. Keep the framing of your comments narrow and specific to the thread you post them on. Gish Gallops are frowned upon. Thanks!
  42. Daniel #37 That crossed my mind too. BTW, making absurd claims to hijack everyone's attention and divert the subject of the discussion is what defines a troll, isn't it?
    0 0
    Moderator Response: [DB] Everyone deserves the benefit of doubt. Until proven otherwise, Gilles should be considered a guest and seeker after knowledge here. :)
  43. "making absurd claims to hijack everyone's attention and divert the subject of the discussion is what defines a troll, isn't it?" It may be, but my experience is that it is also often defined by "somebody who asks some damned irritating questions that I can't answer". You asked me for some references, did you read them?
    0 0
    Moderator Response: [DB] Please see the response to you at 41 above.
  44. going back to the initial topics Dana : "You are of course free to disagree, but as shown in the article, the conclusion that climate sensitivity is unlikely below 2°C and very unlikely below 1.5°C is supported by virtually every study on the subject using both empirical observational data and climate models." I don't disagree with this assertion - after all, this is just a kind of demographic study of models and measurements. I'm just saying that the interval of models and measurement is pretty wide, much much wider than what is usually considered as an "accurate" measurement in physical science, and that a demography of inaccurate measurements is not a very solid thing in science to measure a "likelihood" of anything - I gave precise examples in other fields, that is you believe in computer simulations, it is "very unlikely" that the sun oscillates or supernovae explode.
    0 0
  45. Giles #44 - I think the problem is that I don't see the point you're trying to make. You don't seem to dispute that climate sensitivity is very unlikely to be below 1.5°C for 2xCO2, correct? If your argument is just that the possible range of climate sensitivity values is wide, that's fine (Annan and Hargreaves would disagree with you), but most of the uncertainty is on the high end. Perhaps you could clarify exactly what point you're trying to make here.
    0 0
  46. dana, I'm making the point that the use of "likelihood", based on a set of widely inaccurate measurements, is inappropriate. So, yes, I'm disputing the fact that " climate sensitivity is very unlikely to be below 1.5°C for 2xCO2", because I think that real scientists should be much more cautious when they do this kind of "statistics of results". And I explain why : if you do a statistics of results of numerical simulations of many complex systems, the result can be very far from reality.
    0 0
  47. As I've said Giles, if you want to argue that every single independent line of evidence is somehow biased high, you're free to do so. However, studies based on accurate measurements, such as responses to recent large volcanic eruptions (as discussed in the "climate sensitivity is low" rebuttal linked in the article), are also consistent with the lower bound and range being discussed here. So frankly I don't really think your criticisms are valid.
    0 0
  48. Giles, I wonder if you are confused with the "5 to 95% uncertainty" description in the graphs and what that means.
    0 0
  49. IPCC scenarios are basically grossly overestimating the size of fossil resources, especially oil and gas. And that "current path" is simply untenable, so extrapolations aren't justified.
    Then it's really time to panic and go to renewables, I guess ... Of course, the grownups know this isn't true. Oil sands and natural gas fracking are putting large amounts of previously unavailable fossil fuel into the economy. And "peak oil" says nothing about coal, which is available in copious quantities.
    0 0
  50. Inconvenient Skeptic (#17), I think a core problem with your line of reasoning is that each argument presumes there must be one forcing of global temperature change, and if there lacks a correlation during a period for that particular forcing, then such a forcing must have little effect on climate. You've applied this logic to both atmospheric CO2 and solar variation. One must look at all causes, which includes volcanic and manmade aerosols. Anthropogenic Global Cooling Note also that some of the short-term spikes, such as the early 1940's or 1998, can be caused by ENSO variation, so we should look at longer term data.
    0 0

1  2  Next

You need to be logged in to post a comment. Login via the left margin or if you're new, register here.


The Consensus Project Website

THE ESCALATOR

(free to republish)


© Copyright 2024 John Cook
Home | Translations | About Us | Privacy | Contact Us