Climate Science Glossary

Term Lookup

Enter a term in the search box to find its definition.

Settings

Use the controls in the far right panel to increase or decrease the number of terms automatically displayed (or to completely turn that feature off).

Term Lookup

Settings


All IPCC definitions taken from Climate Change 2007: The Physical Science Basis. Working Group I Contribution to the Fourth Assessment Report of the Intergovernmental Panel on Climate Change, Annex I, Glossary, pp. 941-954. Cambridge University Press.

Home Arguments Software Resources Comments The Consensus Project Translations About Support

Bluesky Facebook LinkedIn Mastodon MeWe

Twitter YouTube RSS Posts RSS Comments Email Subscribe


Climate's changed before
It's the sun
It's not bad
There is no consensus
It's cooling
Models are unreliable
Temp record is unreliable
Animals and plants can adapt
It hasn't warmed since 1998
Antarctica is gaining ice
View All Arguments...


Username
Password
New? Register here
Forgot your password?

Latest Posts

Archives

Climate Sensitivity: The Skeptic Endgame

Posted on 2 March 2011 by dana1981

With all of the distractions from hockey sticks, stolen emails, accusations of fraud,  etc,. it's easy to lose sight of the critical, fundamental science.  Sometimes we need to filter out the nonsense and boil the science down to the important factors.

One of the most popular "skeptic" arguments is "climate sensitivity is low."  It's among the most commonly-used arguments by prominent "skeptics" like Lindzen, Spencer, Monckton, and our Prudent Path Week buddies, the NIPCC

"Corrected feedbacks in the climate system reduce climate sensitivity to values that are an order of magnitude smaller than what the IPCC employs."

There's a good reason this argument is so popular among "skeptics": if climate sensitivity is within the IPCC range, then anthropogenic global warming "skepticism" is all for naught.

As we showed in the Advanced 'CO2 effect is weak' rebuttal, a surface temperature change is calculated by multiplying the radiative forcing by the climate sensitivity parameter.  And the radiative forcing from CO2, which is determined from empirical spectroscopic measurements of downward longwave radiation and line-by-line radiative transfer models, is a well-measured quantity known to a high degree of accuracy (Figure 1).
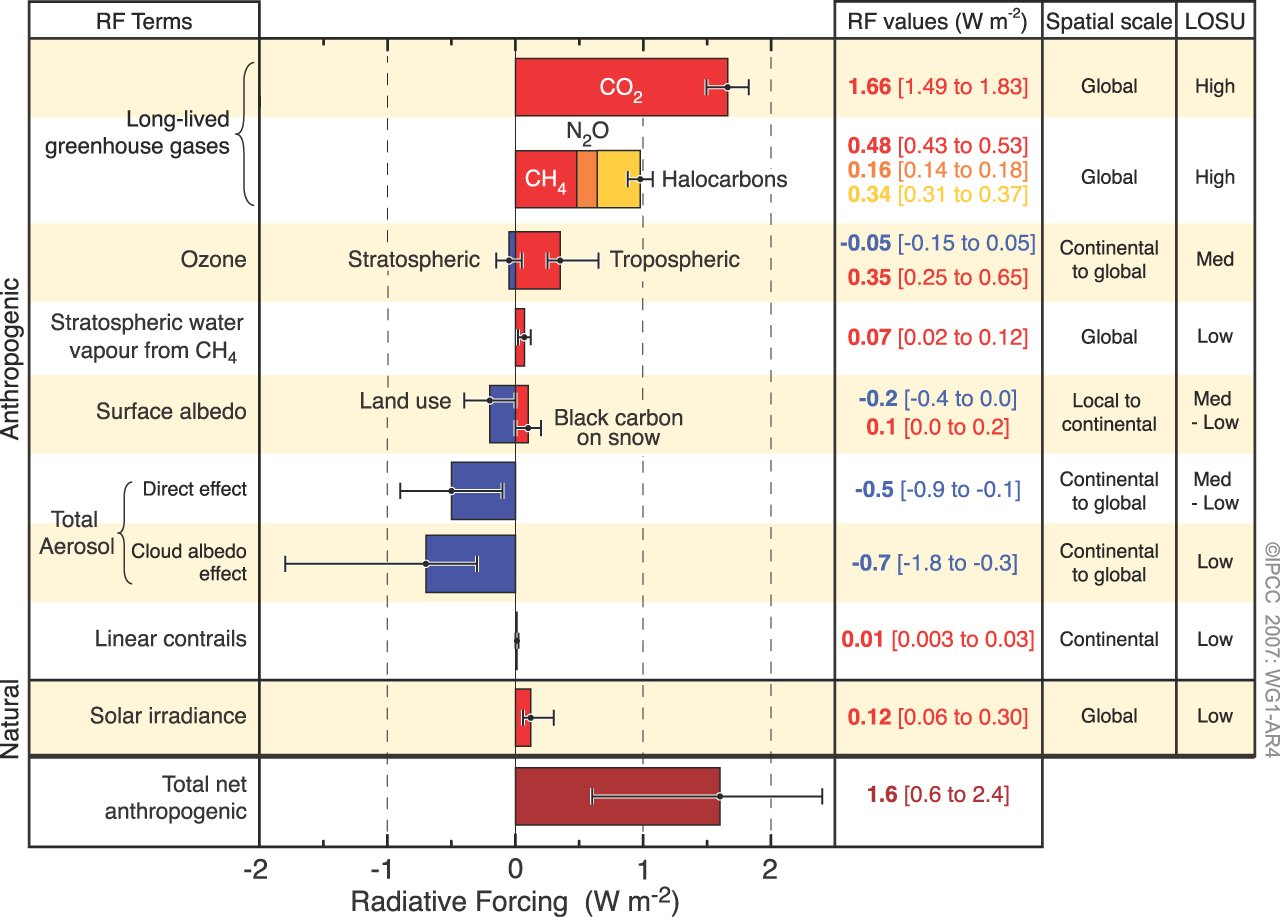
Figure 1:  Global average radiative forcing in 2005 (best estimates and 5 to 95% uncertainty ranges) with respect to 1750.  Source (IPCC AR4).

So we know the current CO2 radiative forcing (now up to 1.77 W/m2 in 2011 as compared to 1750), and we know what the radiative forcing will be for a future CO2 increase, to a high degree of accuracy.  This means that the only way CO2 can't have caused significant global warming over the past century, and that it will not continue to have a significant warming effect as atmospheric CO2 continues to increase, is if climate sensitivity is low.

Global Warming Thus Far

If the IPCC climate sensitivity range is correct, if we were to stabilize atmospheric CO2 concentrations at today's levels, once the planet reached equilibrium, the radiative forcing would have caused between 0.96 and 2.2°C of surface warming with a most likely value of 1.4°C.  Given that the Earth's average surface temperature has only warmed 0.8°C over the past century, it becomes hard to argue that CO2 hasn't been the main driver of global warming if the IPCC climate sensitivity range is correct. 

For the equilibrium warming from the current CO2 radiative forcing to be as small as 0.5°C, the climate sensitivity could only be half as much as the lower bound of the IPCC range (approximately 1°C for a doubling of atmospheric CO2).  In short, there are only two ways to argue that human CO2 emissions aren't driving the current global warming.  In addition to obviously needing some 'natural' effect or combination of natural effects exceeding the CO2 radiative forcing, "skeptics" also require that either:

  1. Climate sensitivity is much lower than the IPCC range.
  2. A very large cooling effect is offsetting the CO2 warming.

The only plausible way the second scenario could be true is if aerosols were offsetting the CO2 warming, and in addition some unidentified 'natural' forcing is having a greater warming effect than CO2.  The NIPCC has argued for this scenario, but it contradicts the arguments of Richard Lindzen, who operates under the assumption that the aerosol forcing is actually small

In the first scenario, "skeptics" can argue that CO2 does not have a significant effect on global temperatures.  The second scenario requires admitting that CO2 has a significant warming effect, but finding a cooling effect which could plausibly offset that warming effect.  And to argue for continuing with business-as-usual, the natural cooling effect would have to continue offseting the increasing CO2 warming in the future.  Most "skeptics" like Lindzen and Spencer rightly believe the first scenario is more plausible.

Future Global Warming

We can apply similar calculations to estimate global warming over the next century based on projected CO2 emissions.  According to the IPCC, if we continue on a business-as-usual path, the atmospheric CO2 concentration will be around 850 ppm in 2100.

If we could stabilize atmospheric CO2 at 850 ppm, the radiative forcing from pre-industrial levels would be nearly 6 W/m2.   Using the IPCC climate sensitivity range, this corresponds to an equilibrium surface warming of 3.2 to 7.3°C (most likely value of 4.8°C).  In order to keep the business-as-usual warming below the 2°C 'danger limit', again, climate sensitivity would have to be significantly lower than the IPCC range (approximately 1.2°C for a doubling of atmospheric CO2).

Thus it becomes very difficult to justify continuing in the business-as-usual scenario that "skeptics" tend to push for, unless climate sensitivity is low.  So what are the odds they're right?

Many Lines of Evidence

The IPCC estimated climate sensitivity from many different lines of evidence, including various different instrumental observations (AR4, WG1, Section 9.6.2).

"Most studies find a lower 5% limit of between 1°C and 2.2°C, and studies that use information in a relatively complete manner generally find a most likely value between 2°C and 3°C…. Results from studies of observed climate change and the consistency of estimates from different time periods indicate that ECS [Equilibrium Climate Sensitivity] is very  likely larger than 1.5°C with a most likely value between 2°C and 3°C…constraints from observed climate change support the overall assessment that the ECS is likely to lie between 2°C and 4.5°C with a most likely value of approximately 3°C.”

The IPCC also used general circulation models (GCMs) to estimate climate sensitivity (AR4, WG1, Chapter 10),

“Equilibrium climate sensitivity [from GCMs] is found to be most likely around 3.2°C, and very unlikely to be below about 2°C…A normal fit yields a 5 to 95% range of about 2.1°C to 4.4°C with a mean value of equilibrium climate sensitivity of about 3.3°C (2.2°C to 4.6°C for a lognormal distribution, median 3.2°C)”
Combining all lines of evidence, the IPCC concludes (emphasis added):
“the global mean equilibrium warming for doubling CO2...is likely to lie in the range 2°C to 4.5°C, with a most likely value of about 3°C. Equilibrium climate sensitivity is very likely larger than 1.5°C.

IPCC AR4 WG1 Chapter 10 also contains a nice figure summarizing these many different lines of evidence (Figure 2).  The bars on the right side represent the 5 to 95% uncertainty ranges for each climate sensitivity estimate.  Note that every single study puts the climate sensitivity lower bound at no lower than 1°C in the 95% confidence range, and most put it no lower than 1.2°C.
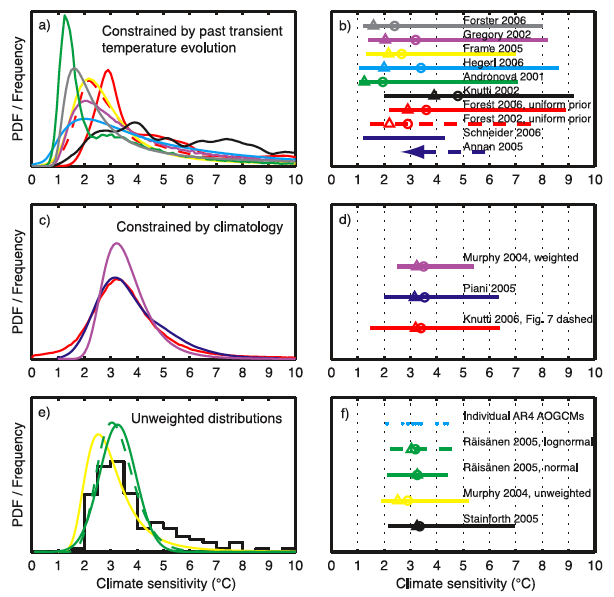
 

Figure 2: IPCC climate sensitivity estimates from observational evidence and climate models

Knutti and Hegerl (2008) arrive at the same conclusion as the IPCC, similarly examining many lines of observational evidence plus climate model results (Figure 3).
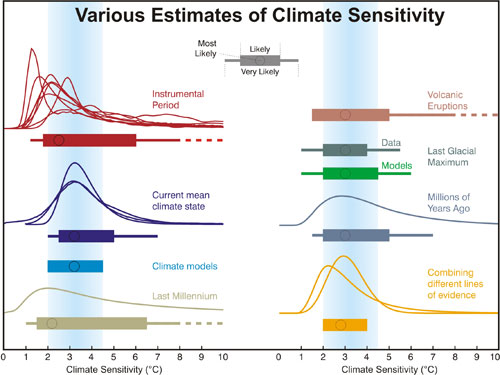
Various estimates of climate sensitivity

Figure 3: Various estimates of climate sensitivity (Knutti and Hegerl 2008).

Game Over?

To sum up, the "skeptics" need climate sensitivity to be less than 1.2°C for a doubling of CO2 to make a decent case that CO2 isn't driving global warming and/or that we can safely continue with business-as-usual.  However, almost every climate sensitivity study using either observational data or climate models puts the probability that climate sensitivity is below 1.2°C at 5% or less.

The bottom line is that the 1.77 W/m2 CO2 forcing has to go somewhere.  The energy can't just disappear, so the only realistic way it could have a small effect on the global temperature is if climate sensitivity to that forcing is low.

Thus it's clear why the "skeptics" focus so heavily on "climate sensitivity is low"; if it's not, they really don't have a case.  Yet unless estimates from climate models and every line of evidence using numerous lines of empirical data are all biased high, there is less than a 5% chance the "skeptics" are right on this critical issue. 

I don't like those odds. 

0 0

Printable Version  |  Link to this page

Comments

Prev  1  2  

Comments 51 to 62 out of 62:

  1. 46 Giles
    because I think that real scientists should be much more cautious when they do this kind of "statistics of results"
    Just out of interest, who are you suggesting is not a real scientists? Here and there we see many critiques of 'scientists' ranging from the accusation of not sticking with some very out of date, potted version of 1930's philosophy of scientific methodology; through the imaginings of people who haven't worked some data from an instrument to a numerical result since school; to out right slander. Of course the same techniques - I guess we're talking monticarlo simulation in this case - can be used by 'real' scientists and charlatans; well or poorly in either case... So, just who are you accusing of being what? And, while we're at it - will you hold your self up to higher standards on SkS... because most people who post here maintain really quite professional attitudes.
    0 0
  2. "statistics of results": If you are questioning the reliability of the models themselves, see the thread Models are unreliable. Models that tend to reproduce observations to date have a built-in check on how far their results can be 'from reality.' An ensemble of such models can then be used to describe 'likelihoods.' Throwing the words 'complex systems' at it doesn't change the basic approach. So that argument goes nowhere fast.
    0 0
  3. Dana : "However, studies based on accurate measurements, such as responses to recent large volcanic eruptions (as discussed in the "climate sensitivity is low" rebuttal linked in the article)" maybe the problem arises from a different understanding of what is an "accurate measurement" ? I confess not being a native English speaker, could you elaborate what "accurate" means in your mind ? Dhogaza "Oil sands and natural gas fracking are putting large amounts of previously unavailable fossil fuel into the economy." Oh really ? what is your guess of how many toe these sources will produce in, say, 20 years ? " And "peak oil" says nothing about coal, which is available in copious quantities." Yes, peak oil says something : that the official estimates of resources are unreliable.
    0 0
  4. "Models that tend to reproduce observations to date have a built-in check on how far their results can be 'from reality.' An ensemble of such models can then be used to describe 'likelihoods.'" I do simply disagree on this epistemological position. Astrology claims reproducing a fair part of reality, and you can do a statistics on astrological predictions. Ptolemaic models did reproduce a fair part of reality, and you could have imagined a statistics of how many epicycles are needed, and a "likelihood" of the number of epicycles of Mars. It would have been just bogus. Models are proved by accurate comparisons of predictions with data, not by statistical sets of approximate reproductions of reality.
    0 0
  5. Giles, I'm using "accurate" to mean measurements with relatively high confidence and small error bars. For example, we know the temperature change over the past century to high accuracy, due to the instrumental temperature record.
    0 0
  6. Gilles, It's not the questions that annoy me (you don't ask many anyway). It's the row of unsubstantiated claims supported by the refusal to consider the available evidence that is more of a problem. There's nothing in those references that provide any evidence that most of the known reserves of fossil fuels (especially coal) will remain unexplored. Unfortunately. It's a great team of moderators, both in attitude and knowledge. I wish them all the patience to cope with this without wearing themselves out.
    0 0
    Moderator Response: [DB] Thus far, sadly, I see the same modus operandi script being followed here as on RC.
  7. “the global mean equilibrium warming for doubling CO2...is likely to lie in the range 2°C to 4.5°C, with a most likely value of about 3°C. Equilibrium climate sensitivity is very likely larger than 1.5°C. Equilibrium climate sensitivity alone is not too informative. What is the relaxation time?
    0 0
  8. "I do simply disagree", You're free to disagree, but that's one person's opinion (which is conspicuously unsubstantiated). You offer astrology's 'claim' to 'reproduce reality'? Hardly a meaningful comparison. Yes, models are predictive tools, so do you make one valid and useful point: See any of the threads here about models from as early as 1988 -- or even from 1981 -- and how well they have done. But this thread is not about models or modeling reliability; I referred you to that thread earlier. This thread is about climate sensitivity.
    0 0
  9. Another study of climate sensitivity: Hansen and Sato recently determined that climate sensitivity is about 3 °C for doubled CO2 based on paleoclimate records. They analyzed previous glacial-interglacial (and earlier) climate changes to understand what forcings were operating. Basically, they treated the Earth as a full scale model that was subject to various forcings including Milankovic cycles, and changes in ice cover, vegetation, and greenhouse gases. For example, between the last ice age 20 thousand years ago and now (actually, pre-industrial times), forcings increased by 6.5 W/m2 and the global temperature increased by about 5 °C. (see paper for uncertainty ranges). That is about 0.75 °C for an increased forcing of 1 Watt/m2. The authors emphasize that these results do not depend on any climate models; they are based on empirical observations. Thus they incorporate all real world feedbacks. "Paleoclimate Implications for Human - Made Climate Change", Jan 2011, James E. Hansen and Makiko Sato; preprint (maybe available from Hansen's NASA website).
    0 0
    Moderator Response: [Daniel Bailey] Thanks, Sarah. The preprint is here.
  10. Dana : Ok , so could you indicate me an "accurate" (in the sense of high confidence and low error bars) of climate sensitivity based on volcanic eruptions ? and precisely, the value obtained and the error bars ? (I assume you have good reasons to argue and you know a S±∆S value where ∆S<< S ?) Alexandre : read again. I said first that a possible reason not to reduce fossil fuels was the possibility that the future extraction would be after all low enough. You asked me for references. I showed you some. What's wrong with that ? I politely indicate you that some people think that official estimates are grossly exaggerated. It is not an EVIDENCE, it is a POSSIBILITY (just like a high CO2 sensitivity). But there is a HINT that they are right considering the case of oil. This is just an option to be considered. Muoncounter : "But this thread is not about models or modeling reliability; I referred you to that thread earlier. This thread is about climate sensitivity." Yes, and it shows that this quantity is not well determined by models. So again, I say that when the models rather strongly disagree with each others, their interval of results is not particularly significative. But you are free to believe in them - I'm free to be reluctant, and you won't convince me by telling ang telling you're right. You would convince me by a precise, reliable measurement of climate sensitivity (with a small error bar)
    0 0
  11. Sarah : do you think that the "new" Hansen value will be considered in the next AR as THE accurate determination of climate sensitivity, dismissing all the other ones, (something like the first accurate measurement of CMB by COBE), or just as one of the many contributions, among other ?
    0 0
    Moderator Response: [Dikran Marsupial] The comments policy forbids accusations of dishonesty or conspiracy or politics etc. This post appears to heading in distinctly that direction Please stick strictly to the science and leave such issues for elsewhere. Sarah has provided you with an example of a determination of climate sensitivity that isn't based on modelling (addressing one of your concerns), that gives you something concrete as the basis for a more constructive discussion.
  12. Moderator : there is absolutely no accusation of anything. I was just asking what is written : do you think this new study will be considered as an almost definite answer to the question of climate sensitivity. BTW, I never stated that ALL estimates were based on models. Concerning Hansen's study, I will first ask a question : do you have an idea of the magnitude of the annual variation of solar forcing between June and December, due to Earth orbit eccentricity, and the corresponding annual modulation of the average temperature, which could be transcribed as a "sensitivity" (∆T/∆F) ?
    0 0
    Moderator Response: [Dikran Marsupial] Speculation of what the IPCC may or may not write in the next AR is off-topic, and likely to end up in accusation/insinuation of bias etc. AFAICS there is no reason to suspect they will deviate from current practice of giving a survey of available results (c.f. Hockey stick sphagetti plot, which shows a variety of proxy constructions). Procede no further in that direction.
  13. "I say that when the models rather strongly disagree with each others" Perhaps its time for you provide some evidence rather than make unsubstantiated declarations: To which models do you refer? What exactly do you mean by 'strongly disagree'? Is that based on any form of significance test? Without such evidence, you lack credibility. "BTW, I never stated that ALL estimates were based on models." You gave that impression with your comment here. And you have adroitly shifted this discussion back to the subject of modeling more than once. It seems the form, if not the substance, of your commentary here is tending towards 'I disagree,' 'Oh really?' and 'Yes, and ... '. Surely there are more valuable ways to contribute.
    0 0
  14. I believe that error bars and probability distributions can be misleading in the context of sensitivity. Looking at fig 3 in the Knutti paper, I see two lines of evidence: models and paleoclimate. The paleoclimate evidence has red boxes for "similar climate base state", IOW it doesn't apply to today's interglacial climate. An error bar or a probability distribution doesn't capture that fact, only the red box does. The second type of evidence is models, as discussed in the models section in the paper: "Different sensitivities in GCMs can be obtained by perturbing parameters affecting clouds, precipitation, convection, radiation, land surface and other processes". In the section Constraints from the Instrumental Period, the authors say that the tenperature response to fast forcings has a nonlinear response to climate sensitiity and thus can be only verified by validating the models. The model results form a "probability distribution" only in the narrow sense of a series of random runs. But perturbing parameters is not probabilistic, those perturbations are either correct or not. So a broader probability distribution or an error bar is simply not possible.
    0 0
  15. mucounter : I think the evidence is pretty well displayed on figure 2. I don't know any physical quantity whose measurements differing by a factor two or more would be said to "agree" , do you ? my point is that if a theory is not accurate, a "likelihood" estimate based on the number of models giving such and such value has no real signification. For obvious reasons : if I add "wrong" models to the sample, giving much higher o smaller sensitivity, the "likelihood" of all others, including the true one (if any), will decrease. Well that's kind of weird isn't it ? how can the validity of a true model decrease if I add BS to the sample ? so please tell me : how exactly is chosen the sample on which you compute this "likelihood" ?
    0 0
  16. Gilles - "Concerning Hansen's study, I will first ask a question : do you have an idea of the magnitude of the annual variation of solar forcing between June and December..." This is a complete non sequitur to the Hansen paper, which concerns total forcings and responses over 100's of thousands of years, not annual variations. Side note: While I find the Hansen ocean cores and the scalings thereof a bit new (to me), and would like to see some more supporting evidence as to their correlation with ice cores, factors of depth and location, etc., it's a good paper, and worth looking at. So, Gilles - annual temperature variation vs. the Hansen paper is a complete red herring. You appear to be trying to side-track the discussion.
    0 0
  17. 64 eric
    The model results form a "probability distribution" only in the narrow sense of a series of random runs. But perturbing parameters is not probabilistic,
    Could you explain your problem with this technique? It is not an uncommon practice (in many disciples) to perturb parameters of models when those parameters are either not known precisely and/or when they can naturally vary over a range. One then calculates the log-likelihood (note likelihood here is a statistics technical term) distribution to estimate the set (or sets) of parameters which best fit the facts, given measurement error distributions or to give the support function (maximum likelihood) for the model. No?
    0 0
  18. Giles, there are a few individual studies which put climate sensitivity at about 3 +/- 1.5°C at a 95% confidence range, which is also approximately the range adopted by the IPCC. Other studies have larger ranges at that certainty level, but they overlap with the IPCC range. You seem to be arguing that no individual study has a sufficiently narrow range of possible values to convince you. Personally, I think the fact that virtually every study overlaps in this same 3 +/- 1.5°C range using all sorts of different lines of evidence is very convincing. Believing sensitivity is outside that range effectively requires believing that every single study happens to be wrong in the same direction.
    0 0
  19. KR : I didn't claim that Hansen paper was about annual variations. BTW, do you know the answer to my question, and the explanation ? les : the point is : it is justified to estimate the likelihood of parameters WHEN the theory is well known and validated. It is not justified to estimate the likelihood of a theory itself. Can you estimate the likelihood that the string theory is correct or that dark matter really exists? no. It's just open questions. Dana : you stated precisely that the climate sensitivity was accurately determined by volcanic eruption, which, I think, would require * an accurate estimate of the negative forcing volcanic aerosols *an accurate estimate of the variation of temperature due to these aerosols alone, once the natural variations properly subtracted. I don't think either of these two quantities is easy to quantify, but may be you know a reference? now for you point that it would require that all study should be biased systematically towards the same direction - yes of course, it's possible, definitely.
    0 0
  20. les, the model parameters are mostly used in place of higher granularity simulation. A mesoscale model with a 1km grid can do a reasonable job simulating precipitation patterns and the weather consequences: temperature, soil moisture, etc. The consequences follow a probability distribution and can also be measured to derive a distribution for a given weather pattern. But that same approach won't work with coarser GCMs. The problem is that the causal parameters like convection cannot be described in a probability distribution because they depend on the rest of the model. For example I can't posit a probability distribution for cumulous formation in my location under any particular conditions. I can measure the clouds over a length of time with varying conditions (broader weather patterns) and get a probability distribution. But I can't translate a particular condition (e.g. today's) into a probability distribution. Well, actually I could, but it's a very hard problem. I need to capture about 30 days "like today" which means looking at a lot of parameters that are difficult to model or even measure like soil moisture. So a model would have to store probability distributions for every parameter in every grid under every condition in order to derive a realistic probability distribution for any model result. Otherwise the resultant distribution simply depends on choices for parameters that are not modeled (too coarse of a model) and aren't measured. As the paper implies, the shape of the "sensitivity" distribution is controlled by parameter choices, not model runs or measurements.
    0 0
  21. Giles - of course it's possible that every study is biased, but it's a very remote probability. That's why the IPCC states that it's very likely, not certain, that climate sensitivity is above 1.5°C. You haven't given any reason to believe the IPCC is incorrect on this issue.
    0 0
  22. Gilles: "my point is that if a theory is not accurate, a "likelihood" estimate based on the number of models giving such and such value has no real signification." You apparently have concluded that the theory is not accurate, so you feel justified in dismissing the model results. But you have yet to substantiate that the theory is not accurate. Absent that, the fact that multiple models overlap, as noted by dana, is evidence that we are converging on a perfectly reasonable sensitivity. So the question turns back to you: what part of the theory behind AGW or GHG-forced warming do you claim to be inaccurate? What justification do you offer for a different sensitivity, presumably based upon your new, improved theory?
    0 0
  23. Dana, the issue is that the discussion is precisely on this point : are the estimates systematically biased towards high values, or not ?if skeptical people think they are, they perfectly know that most estimates are rather high - so saying again they're high doesn't bring much to the debate, in my opinion. And yes, there are good reasons for a high bias - starting with the skewness of the amplification retroaction function 1/(1-f)
    0 0
  24. mucounter : Dana has given a good definition of accurate : "mean measurements with relatively high confidence and small error bars." I don't see how to qualify the error bars as small", in normal scientific standards.
    0 0
  25. Sorry Giles but you last comment didn't make any sense to me. If you want to claim that every single climate sensitivity estimate is biased high, please provide some supporting evidence.
    0 0
  26. >And yes, there are good reasons for a high bias - starting with the skewness of the amplification retroaction function 1/(1-f) The "skewness" of this function simply means that we will always have more certainty about the lower bound than about the upper bound. It does not in any way imply that the bounds are less certain than calculated. It is ridiculous to refer to this as a "bias."
    0 0
  27. 69 Giles I see what you're saying. I'm not at all sure that they are not doing just what I describe... it's a review paper, so a bit short of detail. In Knutti and Hegerl I can't for the life of me see any discussion of the probability of a model being right or wrong?!? But when someone says something like:
    running large ensembles with different parameter settings in simple or intermediate-complexity models, by using a statistical mode
    they are doing what I described. In which case the likelihood function is what I said. 70 EricI think I understand how models are parameterized - I was looking for a demonstration that "perturbing parameters is not probabilistic". The proof of a model (or models) is how they compare to reality. When their parameters aren't known precisely (irrespective of what the parameters are) runs of models can be used to give estimators of how well they compare to reality covering the parameter space.
    0 0
    Moderator Response: [Dikran Marsupial] runaway blockquote fixed
  28. In fact Gilles the "long tail" probability distribution means our sensitivity estimates are more likely to be too low than too high, quite the opposite of what you are implying.
    0 0
  29. les, let me try to simplify (and perhaps oversimplify). A model uses parameter P to determine (among others) measurement M. Measurement M can also be measured in reality for the current climate. Parameter A can be tuned so that the model matches reality in the sense that N runs of the model will produce the probability distribution matching reality. The problem is that works for the current climate and adding AGW to the climate may change parameter P. An example is weather-related parameters in GCMs because they don't have sufficient resolution to model it. For P there are merely various estimates each of which produces a different probability distribution for M. There is no simple way to combine estimates, even they had associated certainties, with model results to produce an aggregate distribution.
    0 0
  30. Parameter A should read Parameter P above.
    0 0
  31. 79/89 Eric .... I dunno... a quick google turns up Representing uncertainty in climate change scenarios: a Monte-Carlo approach, Mark New and Mike Hulme which seems to take the approach along the lines I'd imagine.
    0 0
  32. "Oh really ? what is your guess of how many toe these sources will produce in, say, 20 years ? " Fracking of known natural gas reserves in the US would provide 100% of US consumption for roughly 100 years. This estimate comes from the oil companies who are making the hard-dollar investments in exploiting the resource. "Yes, peak oil says something : that the official estimates of resources are unreliable." True, unreliably *low* as a combination of 1) new extraction technology becoming available 2) exploration efforts uncovering new reserves 2) prices rising cause reserve estimates to rise.
    0 0
  33. Thanks for the link les, here's the full URL; http://journals.sfu.ca/int_assess/index.php/iaj/article/download/188/139 I looked at the section on climate sensitivity where they refer to this study http://pubs.acs.org/doi/abs/10.1021/es00010a003 titled "Subjective judgements by climate experts" to obtain a subjective probability distribution of climate sensitivity values centered aroudn 3C. In that 1995 paper they start out "When scientific uncertainty limits analytic modeling, but decision makers cannot wait for better science, expert judgment can be used in the interim to inform policy analysis and choice" I would rather wait for objective probability distribution measurements. For example, the continued rapid increases in computing power will make full weather simulation possible within global climate models (i.e the mesoscale models I referred to above). Then there will be no need for subjectivity.
    0 0
  34. #59 Sarah at 14:09 PM on 3 March, 2011 Hansen and Sato recently determined that climate sensitivity is about 3 °C for doubled CO2 based on paleoclimate records.[...]
    Moderator Response: [Daniel Bailey] Thanks, Sarah. The preprint is here.
    I don't see it was a peer reviewed paper. Dr. Hansen says it's a "Draft paper for Milankovic volume", whatever that may be. However, it is still interesting, because it is based on empirical data and has definite numbers to work with. Its biases and omissions are also telling. The first thing to note they assume a 4 W/m2 forcing for doubling of atmospheric CO2 concentration, which is slightly above the IPCC AR4 WG1 2.3.1 (2007) estimate of 3.7 W/m2, with no explanation whatsoever. The figure seems to come from IPCC FAR WG1 3.3.1 (1990). Anyway, if we accept their value, using CO2 concentration measurements at the Mauna Loa Observatory we get the annual rate of change in forcing due to CO2 as α = 0.024 W/m2/year for the last 54 years. The paper calculates an equilibrium climate sensitivity of λ = 0.75°Cm2/W using paleoclimate data. As temperature variability is much smaller under current warm interglacial regime than for the bulk of the last 3 million years, climate sensitivity obviously decreases sharply with increasing temperatures, but let's go with their figure anyway, at least for the time being. Greenland temperatures during the last 100 kyears -- click for larger version If we assume a scenario under which atmospheric CO2 concentration was constant for a long time (presumably at pre-industrial level, let's say at 280 ppmv) then started to increase exponentially at the rate observed, we get an excitation that is 0 for dates before 1934 and is α(t-1934) for t > 1934. The artificial sharp transition introduced in 1934 this way does not have much effect on temperature response at later dates. If global climate responds to an excitation as a first order linear system with relaxation time τ, rate of global average temperature change is αλ(1-e-(t-1934)/τ) for a date t after 1934. As the expression in parentheses is smaller than 1, this rate can't possibly exceed αλ = 0.018°C/year. It means global average temperature can't increase at a rate more than 1.8°C/century even in 2100, which means less than 1.6°C increase relative to current global average temperature, no matter how small τ is supposed to be. However, a short relaxation time is unlikely, because it takes (much) time to heat up the oceans due to their huge thermal inertia. For example if τ = 500, current rate of change due to CO2 forcing is 0.26°C/century while in 2100 it is 0.51°C/century (according to Hansen & Sato, of course). However, ocean turnover time being several millennia, we have probably overestimated the actual rates. It means that most of the warming observed during the last few decades is due to internal noise of the climate system, not CO2. Anyway, the exponential increase of CO2 itself can't go on forever simply because technology is changing all the time on its own, even with no government intervention whatsoever. Therefore it should follow a logistic curve. If the epoch of CO2 increase is substantially shorter than the relaxation time of the climate system, the peak rate of change due to CO2 becomes negligible.
    0 0
  35. Berényi - I'll admit to having some trouble following that last posting. The last I heard you were claiming that the relaxation time was essentially zero, so that there was no heating left in the pipeline. Now you are arguing that relaxation times are long enough to slow warming to a manageable level??? You're contradicting yourself. Second, 1934 is not the start of anthropogenic carbon forcing - that's somewhere around the beginning of the industrial revolution, circa 1850 or so. Third, relaxation times are relative to multiple time frames - from the several week H2O forcing to the multi-century ice response. Your simple formula is therefore inappropriate. And, since rate of change is dependent on scale of forcing, your 1.8C/century limit is, in my opinion, nonsense. I'll leave it at that for now - you have posted completely contradictory arguments in just the last few days, I'm certain there are issues others might raise.
    0 0
  36. Sorry, the start date should be 1800, not 1850, in my last post, for the start of anthropogenic CO2 - typing too fast... Incidentally, although I suspect most of the usual suspects will have seen this already, the YouTube video from CarbonTracker is worth showing to everyone.
    0 0
  37. e : your wrong, if you take a random gaussian distribution of the "f" amplication factor, with an average value , the average value of the "1/1-f" (and hence sensitivity) factor will be larger than the 1/(1-)) This is a high bias. I don't want to prove that climate models and measurements are wrong. I'm just saying that the kind of line you adopt (reasoning on a large sample of different valuers) is not very convincing from a scientific point of view., if the issue is whether the whole model is correct or not. It relies on the implicit assumption that the models have been proved to be true - which is precisely the point. This is kind of a circular justification. concerning the point of relaxation timescales : in the simplest approximation, there is a single timescale, and the relevant equation is dT/dt + T/tau = S.F(t)/tau where tau is the relaxation timescale and S the sensitivity. The exact solution of this equation is T =S. ∫ F(t')exp(t-t'/tau) dt'. Mathematically, T(t) tries to follow the variations of F(t), but with some delay of the order of tau, and smoothes all variations of the order of tau. Basically, it responds to the average of F(t) over a past period tau. If tau is small (with respect to the characteristic timescale for S(t)), T(t) follows closely S(t). If it is large , the T/tau term is negligible and one has rather dT/dt = S F(t)/tau , so T(t) = S ∫ F(t) dt'/tau. The "response" is the the integral of F(t) (the system "accumulates heat") but it is curtailed by a factor tau. Now there are interesting questions around tau. If tau is small, S should be just the ration of T(t) to F(t), so it should be precisely determined by current variations, which is obviously not the case. So we are rather in a "long" tau, longer than or comparable with 30 years. This allows some "flexibility " between S and tau, because constant ratio S/tau will give the same signal T(t) - I think this is the main reason for the scattering of S (and tau) , they are not well constrained by the data. However, if tau is large, the response of a linearly increasing forcing should be quadratic (this is obvious because the temperature has to increase faster in the future to exceed the 2°C thershold for instance), so an acceleration should be measurable. Is it the case? not really. Temperature are less or equally increasing than 30 years ago - you can discuss whether they're still increasing or not, but they're not accelerating.That's kind of puzzling in my sense (leading to the obvious observation that if they aren't accelrating, a warming rate of 0.15 °C will only produce 1.5 °C after 100 years). So there is a small window for which the sensitivity is high but not too much, and the timescale high but not too much, and the "curvature" will be significative in the near future , but not yet just now. Outside this window, the curve T(t) is essentially linear with a linearly increasing forcing (as the forcing is is logarithmic with the concentration and the production of GHG is supposed to increase more or less exponentially with a constant growth rate, the forcing should be close to linear). This is only possible for tau between 30 and 100 years, Say (which is essentially what is found in current models). But again this raises other interesting questions. 30 to 100 years is SHORT with respect to paleoclimatic times , and astronomical (Milankovitch) changes of forcings. So IF it were in this range, temperatures should follow rather closely teh forcings, and change only very slowly with them. But we hear here also on a lot of "variations " of climate at the centennal time scale (medieval "anomaly" whatever happened then, D-O events, and so on) which should NOT happen if the forcing is not changing at this time scale. But why is the forcing changing? aerosols, volcanoes, do they have a reason to statistically change when averaged over 100 years or so (remember that the temperature changes by averaging over this time scale?)
    0 0
  38. sorry for some misprints and disappearing signs. You should read : e : you're wrong, if you take a random gaussian distribution of the "f" amplication factor, with an average value f0, the average value of the "1/1-f" (and hence sensitivity) factor will be larger than the 1/(1-f0)) This is a high bias. and If tau is small (with respect to the characteristic timescale for S(t)), T(t) follows closely S. F(t).
    0 0
  39. 83 Eric objective/subjective?!?! now you sound like Poppy Tech!! ;) ;) < big wink > sure, though. of course for scientists that's fine. Governments rarely have the luxury - as I pointed out to someone: armies have to be maintained without knowing the exact probability of war or invasion, hospitals and school have to be build with out knowing exactly the population in 20 years, vaccines have to be stockpiled without knowing the exact epidemiology or the next flu outbreak etc. etc. Power security has to be maintained, the environmental resources managed, healthy environment preserved (or restored)... better to understand the proper meaning of likelihood rather than stuffing it in quotes and pretending it's meaningless.
    0 0
  40. les, my advice to poptech is Choose One (objective or subjective). I have always had an objectivist philosophy (although not perfectly matched to Randianism), so when I see a probability distribution I immediately look around for the data it was based on. Often there is literally none. As for your policy argument, we are not facing unknowns like one or more typhoid Marys or a human-based decision to go to war. It is simply a complex natural process with some true unknowables like intergalactic cosmic ray flux, future volcanic activity, future solar activity (known to some extent), etc. A lot of these are ambiguous or more likely to cool, so not really worth debating. Everything else is knowable. There is no reason to apply subjectivity to the issue of sensitivity, just better models, validated against real world measurements. The bottom line is that 5C warming (or choose your favorite number) has a zero or a 100% probability of happening within time X (choose 100 years but not 1000), under specific conditions such as BAU. That statement contains no room for any subjectivity other than BAU being made as a human choice which is really only a marginal issue.
    0 0
  41. "If the IPCC climate sensitivity range is correct, if we were to stabilize atmospheric CO2 concentrations at today's levels, once the planet reached equilibrium, the radiative forcing would have caused between 0.96 and 2.2°C of surface warming with a most likely value of 1.4°C. Given that the Earth's average surface temperature has only warmed 0.8°C over the past century" Dana how much of the 0.8oC would you attribute to anthropogenic GHGs?
    0 0
  42. 90 Eric:
    when I see a probability distribution I immediately look around for the data it was based on.
    well yes. but now you have seen that that is not the only sort of probability distribution, and really - as a remark on the general technique, rather than the objective/subjective side issue - it is a perfectly proper technique which lots of science uses (e.g. CERN wouldn't work without it). In my limited experience of them, however, they are rarely used to determine The Truth, but to bound understanding and projections... as, IMHO, they are being used here. As for policy, it's also an issue with lots of obfuscating ideas, like intergalactic cosmic ray flux, and the demand that things are more absolute that is ever the case in reality, put about by people who probably actually know better... which is definitely off topic.
    0 0
  43. les, being proper for quantum mechanics at CERN doesn't justify creating distributions for climate parameters that are completely described by classical mechanics. It impacts the policy debate only because the resulting "probabilities" are (from my POV) easy to unravel. E.g., someone links to a paleoclimate sensitivity argument and I simply point out the red boxes in Knutti, figure 3, that were left out of the figure 3 above (measurements for probabilityy distribution were not made with current climate)
    0 0
  44. Sorry Eruc; CERN doesn't just use them for QM - far from it. The fact is that such techniques are widely used and yield useful results -and probabilities, not "probabilities" - in all kinds of situations. Ofcourse they, like all techniques, can be used well or badly. That has to be argued, per application, on individual merits ... or, if you prefer on your POV
    0 0
  45. HR #91:
    " how much of the 0.8oC would you attribute to anthropogenic GHGs?"
    About 80%.
    0 0
  46. #85 KR at 15:22 PM on 4 March, 2011 Berényi - I'll admit to having some trouble following that last posting. Try harder please and you'll find it makes sense after all. The last I heard you were claiming that the relaxation time was essentially zero, so that there was no heating left in the pipeline. Now you are arguing that relaxation times are long enough to slow warming to a manageable level??? You're contradicting yourself. No, I am not. The nice thing about linear systems is that they are additive. If there are several different processes in the climate system operating on different timescales, the overall response is simply the sum of individual responses. So the impulse response function can be written as the sum of λkke-t/τk (if t > 0, zero otherwise) for k=1,2,...,n. Guess why the full set of (λkk) pairs, along with their error bars is never specified in the mainstream climate science literature. Just play with the numbers and you'll see it is entirely possible to have a pretty high equilibrium climate sensitivity (sum of λk's) with extremely low short term climate sensitivity (sum of λk's for which τk is small) while rate of change in response to a quasi-realistic CO2 forcing scenario is never too steep. In fact this state of affairs is consistent with all the empirical data we have. Second, 1934 is not the start of anthropogenic carbon forcing - that's somewhere around the beginning of the industrial revolution, circa 1850 or so. Come on, the transition in the first half of 20th century was of course smooth, but the error in the response is the response to the difference between a smoothly changing excitation and this artificial one. As the difference between them is small and it was largest a long time ago (more than 70 years), the error in the climate response as of now is small. Third, relaxation times are relative to multiple time frames - from the several week H2O forcing to the multi-century ice response. Your simple formula is therefore inappropriate. And, since rate of change is dependent on scale of forcing, your 1.8C/century limit is, in my opinion, nonsense. As for the first part, see above. As for the latter part, please clarify what "rate of change is dependent on scale of forcing" is supposed to mean. Describe the dependence you think should hold in detail.
    0 0
  47. Gilles> the average value of the "1/1-f" (and hence sensitivity) factor will be larger than the 1/(1-f0)) When providing a probabilistic estimate of sensitivity, we are looking for the most likely value (the peak in the distribution), not the mean of the distribution. This value is not at all biased in the way you suggest.
    0 0
  48. Thanks Dana I've got another general question. Is global climate sensitiviity a real world phenomenon? What I mean is that with ideas such as polar amplification would actual climate sensitivity vary in different regions?
    0 0
  49. HR #98: sensitivity refers to the average temperature change across the whole planet in response to a CO2 change. I suppose you could break it down geographically and figure out a region-by-region sensitivity (the poles would have a higher sensitivity than lower latitudes).
    0 0
  50. e#97 : again, I don't think that a probability distribution based on a collection of heterogeneous models and measurements has any clear signification, especially if you're interested in the peak in the distribution ! just because the position of this peak will shift following the number of bogus models you add in the sample.
    0 0

Prev  1  2  

You need to be logged in to post a comment. Login via the left margin or if you're new, register here.


The Consensus Project Website

THE ESCALATOR

(free to republish)


© Copyright 2024 John Cook
Home | Translations | About Us | Privacy | Contact Us