Climate Science Glossary

Term Lookup

Enter a term in the search box to find its definition.

Settings

Use the controls in the far right panel to increase or decrease the number of terms automatically displayed (or to completely turn that feature off).

Term Lookup

Settings


All IPCC definitions taken from Climate Change 2007: The Physical Science Basis. Working Group I Contribution to the Fourth Assessment Report of the Intergovernmental Panel on Climate Change, Annex I, Glossary, pp. 941-954. Cambridge University Press.

Home Arguments Software Resources Comments The Consensus Project Translations About Support

Bluesky Facebook LinkedIn Mastodon MeWe

Twitter YouTube RSS Posts RSS Comments Email Subscribe


Climate's changed before
It's the sun
It's not bad
There is no consensus
It's cooling
Models are unreliable
Temp record is unreliable
Animals and plants can adapt
It hasn't warmed since 1998
Antarctica is gaining ice
View All Arguments...


Username
Password
New? Register here
Forgot your password?

Latest Posts

Archives

Arctic Ice March 2011

Posted on 30 March 2011 by logicman

This is a repost of my Science 2.0 article Arctic_Ice_March_2011_Update_#2, with an introduction, updates and minor edits.

Introduction

The main mass of Arctic sea ice has previously consisted mostly of thick multi-year ice.  In the winter of 2006 - 2007 there was a crossover: first year ice became the majority component.

The Arctic sea ice cap is getting younger.  A population of older ice is being replaced as the older ice is lost and new ice does not linger long enough to get old.  The former dominance of thick multi-year ice together with a gyratory motion caused new ice to enter the main pack and be trapped there for many years. The Transpolar Drift and Beaufort Gyre formerly brought new ice into the main pack and exported old ice - mainly on the Atlantic side through Fram Strait.  The export and import were formerly in broad balance.  They are not balanced now.

Younger and thinner ice now allows a more rapid transit of floes through the pack.  The age of the oldest ice is the length of time during which it was prevented from advecting south by being trapped in the main pack.

It appears that as the ice gets thinner and more mobile, that very mobility is a positive feedback to ice loss.

Arctic Ice March 2011

The melt season of 2010 ended with a low extent and with little ice older than two years. There are strong indications that the winter of 2010 - 2011 did not compact and thicken the sea ice as much as would normally be expected.

Arctic sea ice extent averaged over December 2010 was 12.00 million square kilometers (4.63 million square miles). This is the lowest December ice extent recorded in satellite observations from 1979 to 2010, 270,000 square kilometers (104,000 square miles) below the previous record low of 12.27 million square kilometers (4.74 million square miles) set in 2006 and 1.35 million square kilometers (521,000 square miles) below the 1979 to 2000 average.

... unfrozen areas of the ocean continued to release heat to the atmosphere, and an unusual circulation pattern brought warm air into the Arctic from the south. Although the air temperatures were still below freezing on average, the additional ocean and atmospheric heat slowed ice growth.

http://nsidc.org/arcticseaicenews/2011/010511.html

It appears to me that the 2011 melt season began with weaker, thinner, less consolidated ice than at any time in recorded history.  Where the slabbing and compaction has been least, the newest ice between the older floes is likely to melt soon.

I suggest that by mid-April the sea ice will be in a similar condition to that of late August 2010.  In plain terms, the 2011 melt season will soon continue more or less where the 2010 melt season left off.

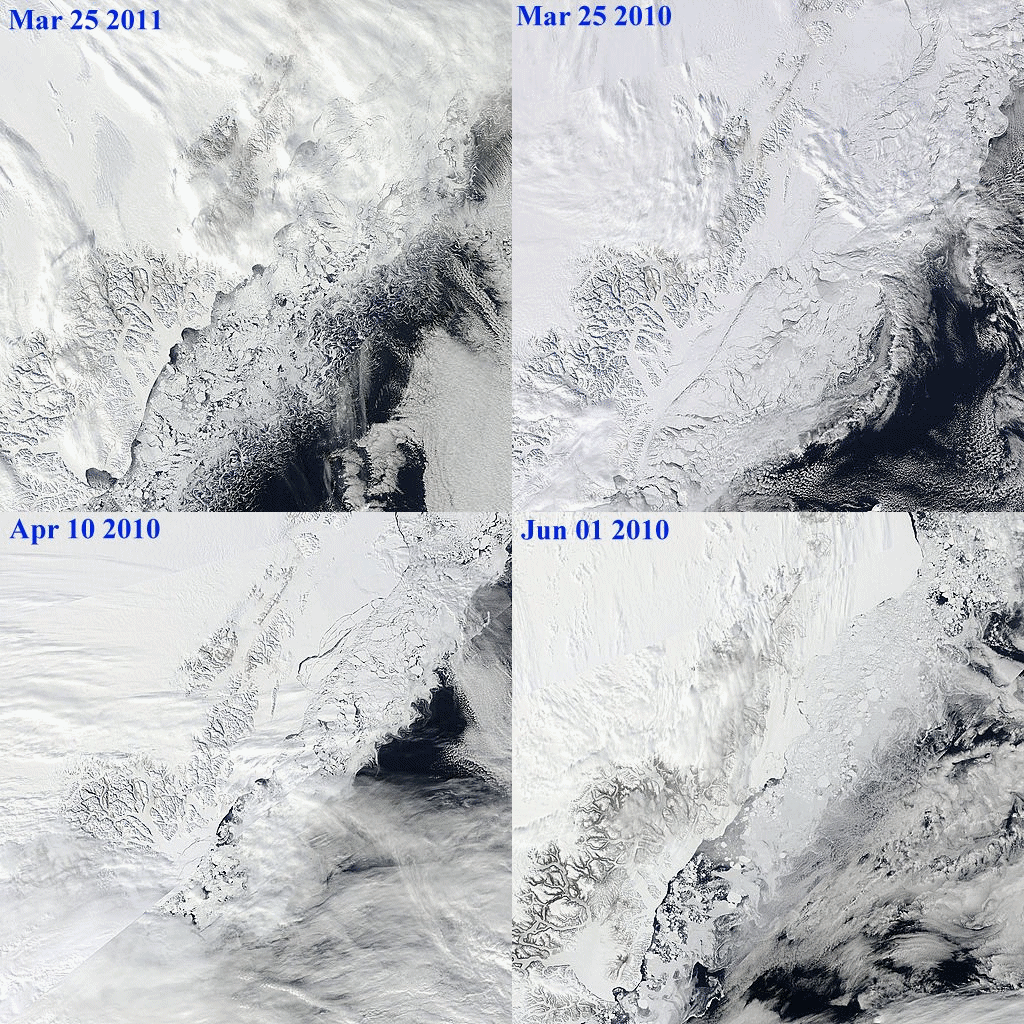
To illustrate that last point, this animation compares 25 March 2011 ice extent on Greenland's northeast coast with 25 March, 10 April, and 01 June 2010.
Scoresby animation
Ice extent comparisons - from MODIS Arctic mosaic images.


Melting and re-freezing

Many areas of the Arctic are melting, advecting and re-freezing.  This superimposes local variation noise on signals of ice extent.  I call this 'the Arctic ice jitters'.

Sea ice extent in February and March tends to be quite variable, because ice near the edge is thin and often quite dispersed. The thin ice is highly sensitive to weather, moving or melting quickly in response to changing winds and temperatures, and it often oscillates near the maximum extent for several days or weeks, as it has done this year.
Source: NSIDC report March 23, 2011

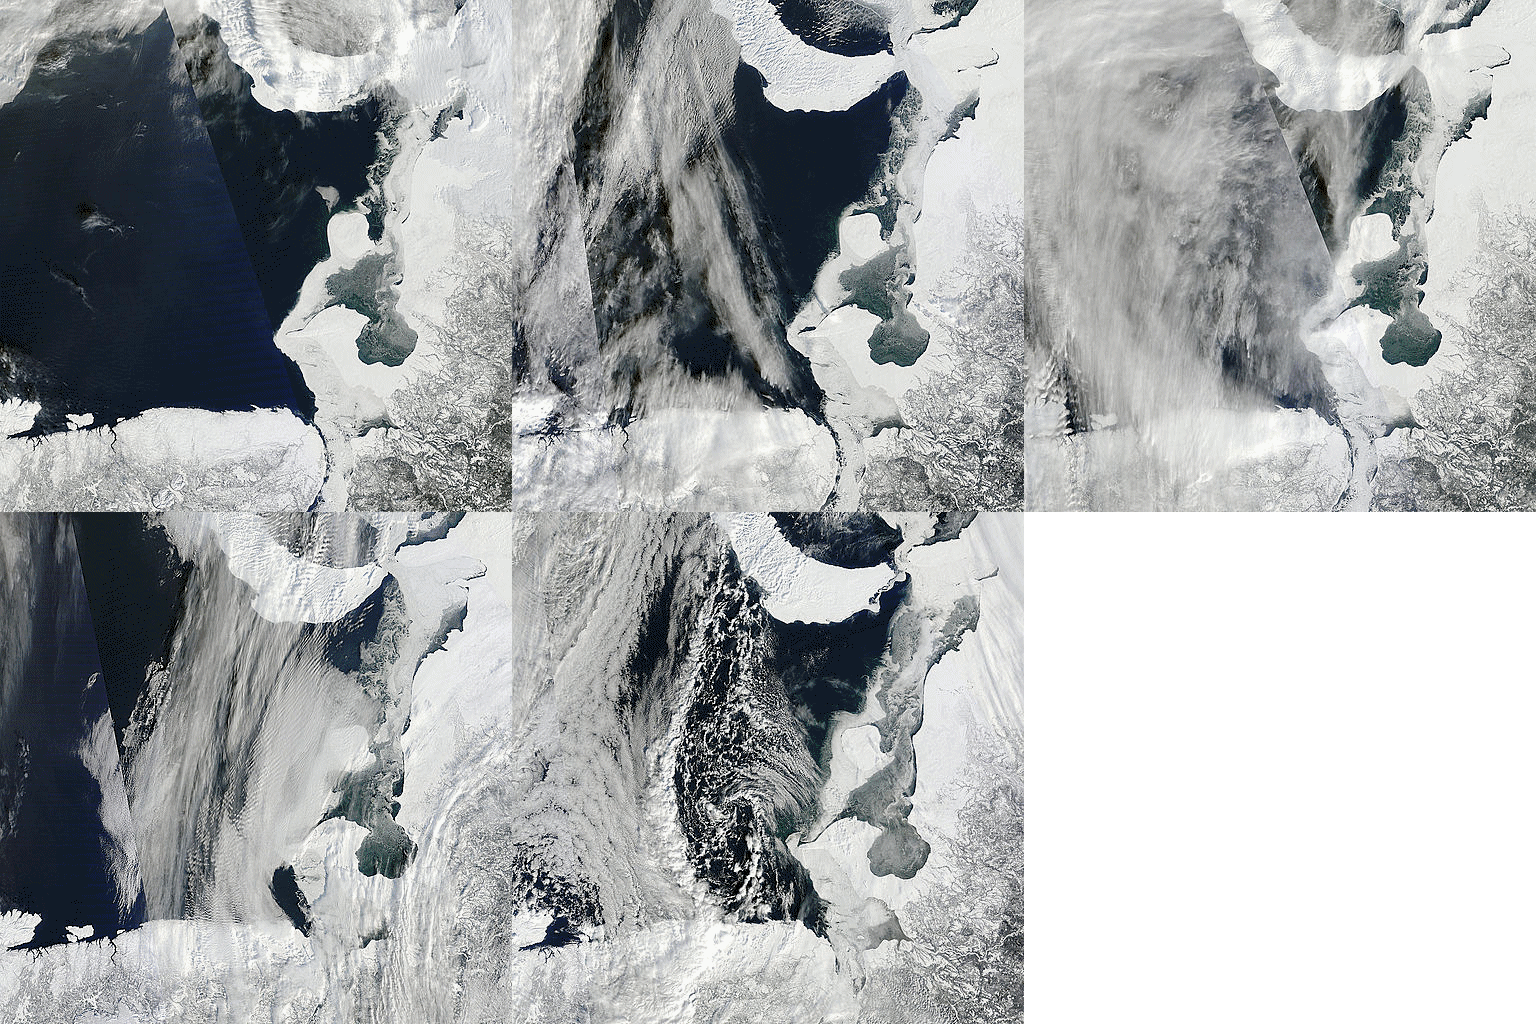
The following images show the ice jitter effect in an Arctic mosaic segment which includes Kara Strait.

Kara Strait ice jitter
Kara Strait - ice extent jitters

Note that this sea ice will appear in extent numbers but will have no impact whatsoever on the mass of ice in the main polar sea-ice cap.


The tale of the tape

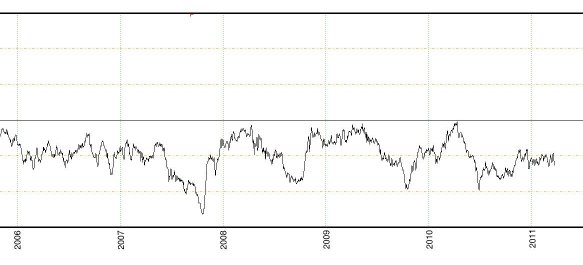
The unusual behaviour of Arctic ice this year is shown at a glance by the Cryosphere Today's 'tale of the tape':  the 2011 portion of the graph could not have been predicted from previous data.  The 2011 plot of anomalies is itself anomalous.
tape tail


The graph as a whole shows a clear negative anomaly trend since 1979.
tale of the tape
The latest update of the full sized 'tale of the tape' can be seen at http://arctic.atmos.uiuc.edu/cryosphere/

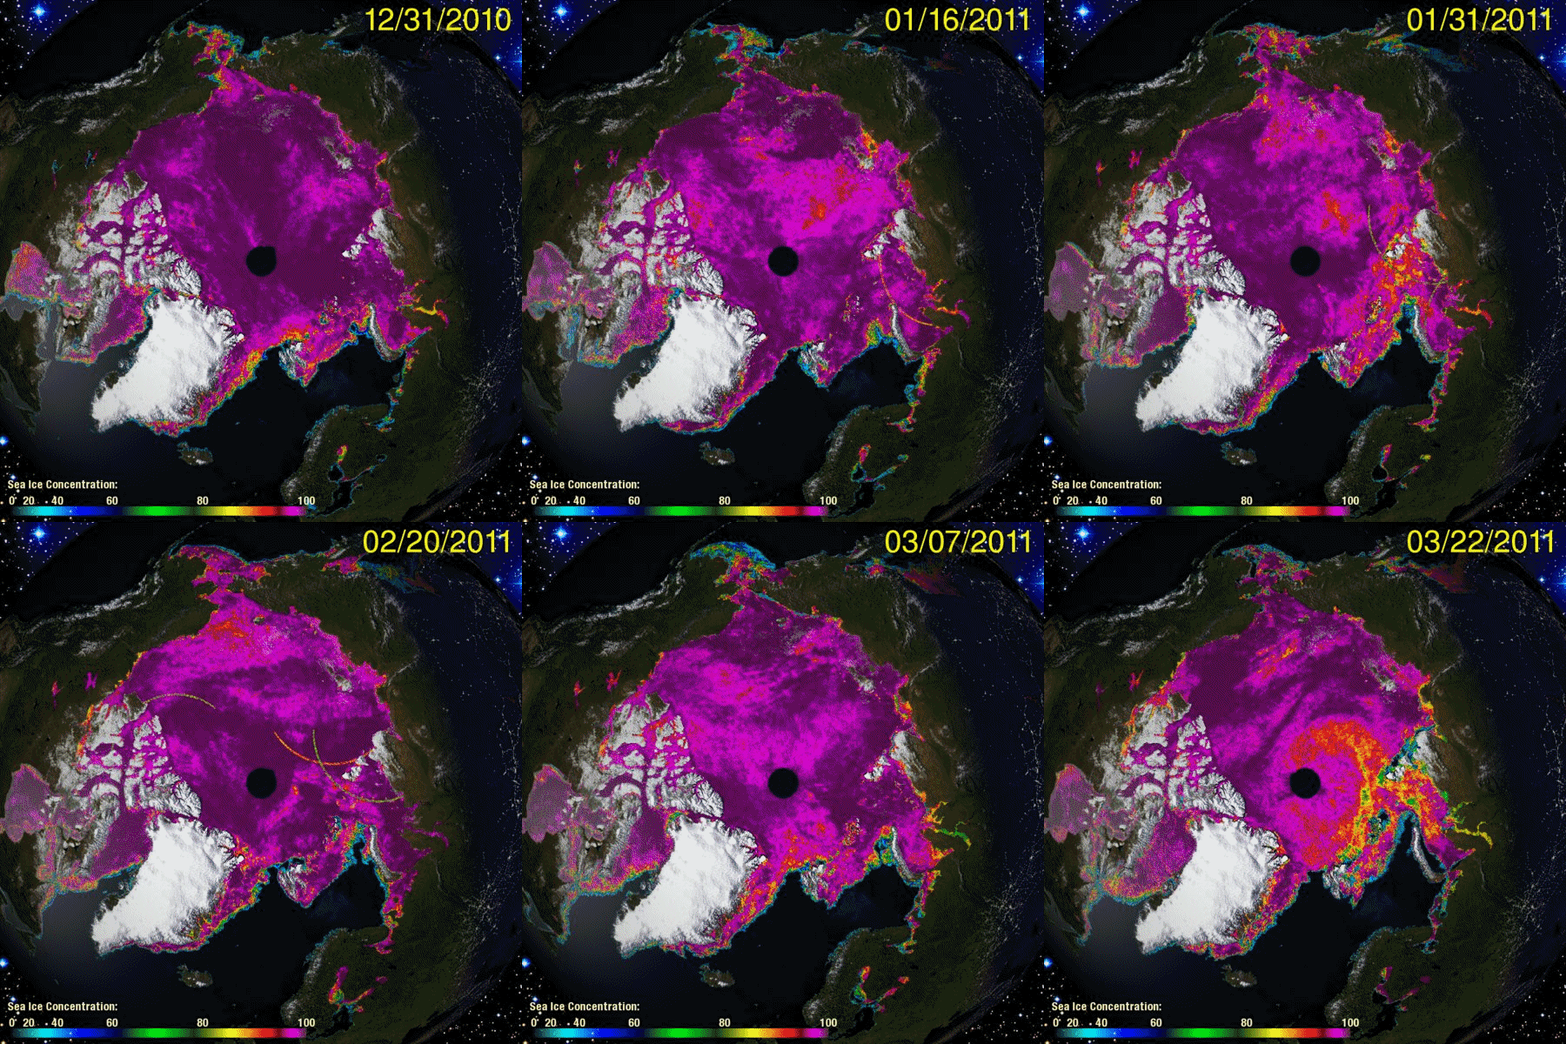
The animation below of the sea ice concentration chart from Cryosphere Today shows changes in ice distribution from 31 December 2010 to 22 March 2011 in 5 day steps.
cryosphere animation
Sea ice concentration Dec 31 2010 to Mar 22 2011

The chart of sea ice concentration should be read in conjunction with the PIPS ice displacement chart animation and the current ice thickness chart below.
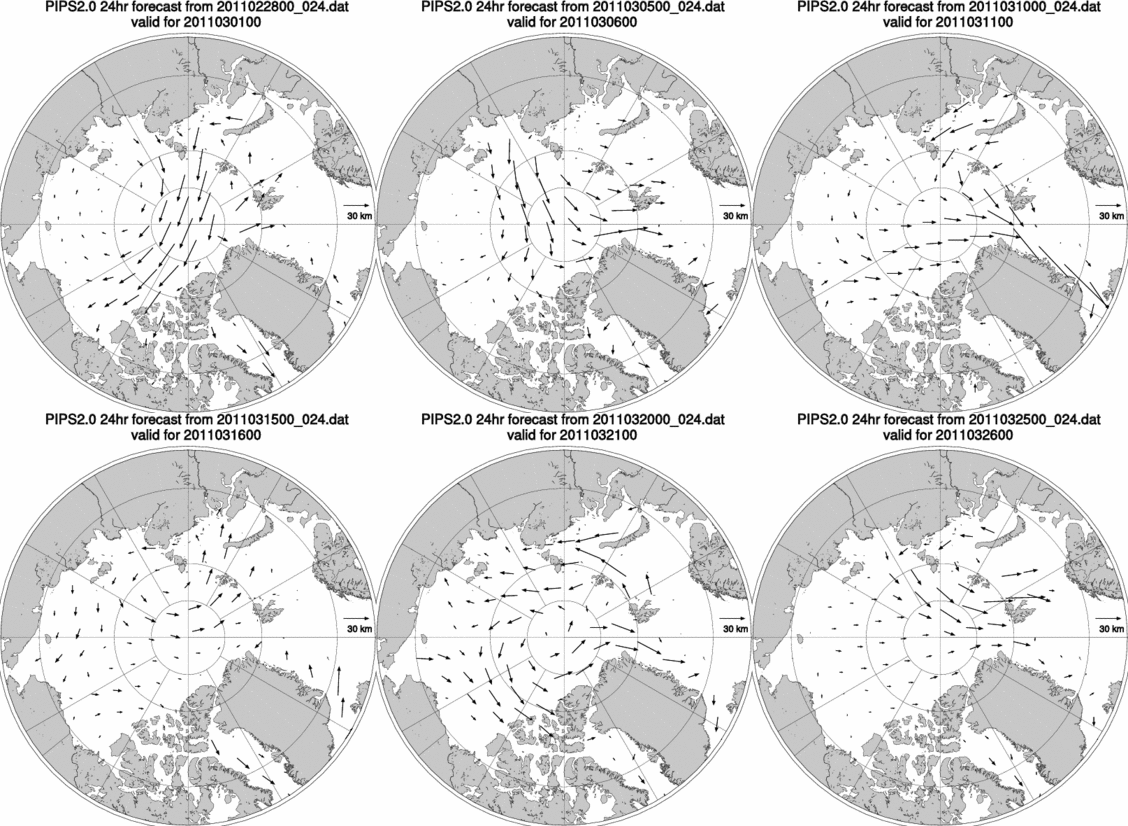
ice displacement animation
Ice displacement charts from March 01 to March 25 2011
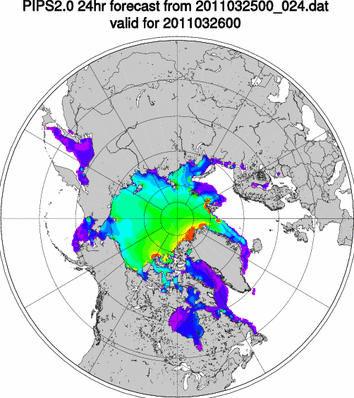

PIPS thickness
PIPS ice thickness forecast.

The red, yellow and green areas in the ice thickness chart are the last vestiges of sea ice thicker than 2.75 meters in the entire Arctic.  They consist of heavily fragmented ice much of which is being advected through the Fram Strait.  When the Nares Strait and NWP ice breaks up, that thick ice will be highly susceptible to advection through those passages.

The 3 to 5 thousand years old ice shelves which once extended north of Ellesmere island are now down to the last fragments.  If we discount those fragments there is little ice in the entire Arctic older than 5 years.  It bears constant repeating that the bulk of Arctic ice 2011 is 2 years old or less.

Nares Strait

Recent ice advection patterns; warm water advances into the Arctic from the Atlantic; ice distribution patterns: all of these things show that conditions continue to be advantageous for export of ice through Fram Strait.  Nares Strait is currently blocked by relatively weak ice.  As soon as the ice in Nares Strait breaks up, a continuation of current trends will be advantageous for the export of substantial volumes of the remaining older ice through that channel, supplementing the export through Fram Strait.

We are now (27 March 2011) within the time frame of my March 02, 2011 predition  for the breakup of the Nares Strait ice bridge.  Radar images show a melange of last year's floes and young ice.  This melange is so weak that a few cloudless days and / or a strong wind towards Baffin Bay will cause a rapid breakup of the ice bridge.  I expect to see ice being advected through Nares Strait about the 14th of April.
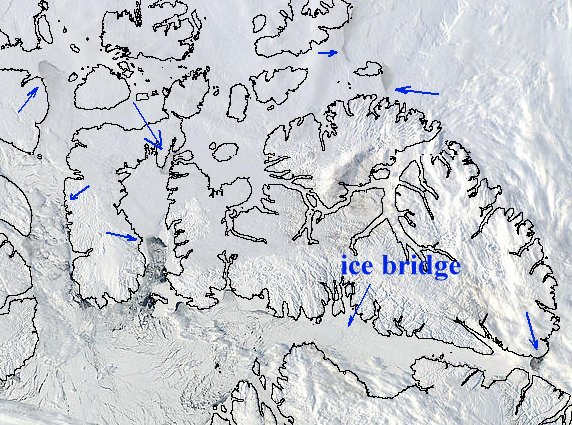
NWP Nares and Baffin Bay
NWP and Nares Strait

The arrows show 'places of interest' where ice is breaking up and being replaced by open water.  The ice bridge is still intact, but its breakup is imminent.
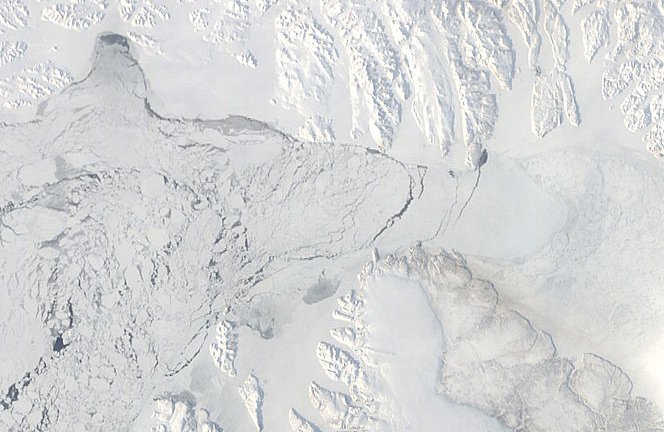
Nares ice bridge March 2011
Ice bridge at Kane Basin, Nares Strait March 26 2011


Ice volume

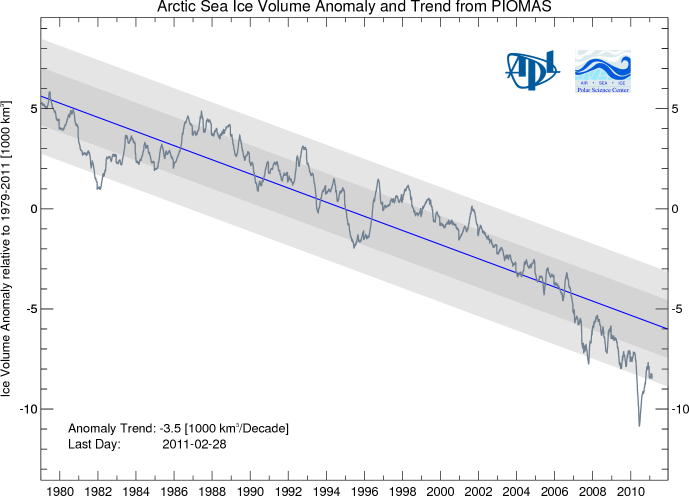
The decline in ice volume since 1979 is dramatically illustrated by this PIOMAS graph.
PIOMA ice volume
 
The importance of ice volume is that it reflects the ability of the Arctic sea ice cap to absorb heat without melting away entirely.  Thicker ice can survive summer melting longer than thinner ice.  Thicker ice has greater momentum by which massive floes slide over and under each other, slide over ice rubble, create massive compression ridges and generally make the ice more robust.  Thinner ice can melt away entirely, can fragment instead of slabbing.

An ice cap which is rejecting heat all winter can absorb the same amount of heat during summer without raising its temperature to the melting point.  Ice lost by ablation is readily replaced by the freezing of rain, snow and meltwater.  A robust ice cap, due to its thermal capacity, cannot melt away in summer.

The ice cap we see today is not robust.

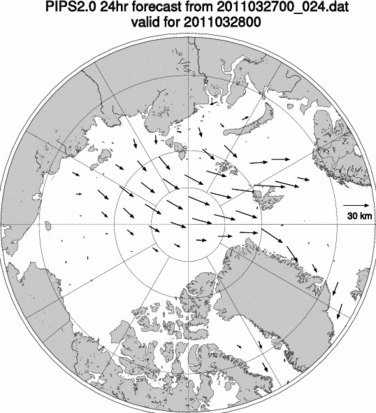
Ice displacement patterns such as the one below will drive a great volume of ice out of the Arctic Ocean and into warmer waters.
ice displacement

Summary

The melt season of 2011 is under way with less volume than former melt seasons.

Of that lesser volume, about 90% appears to be under 2.75 meters thick.

Much of the ice is less than 1 year old.

The Arctic's dynamic system seems primed to advect large quantities of ice out of the main ice cap area.

The Beaufort Gyre and Transpolar Drift have not yet appeared as stable patterns.  The instabilities in the ice drift patterns broadly favor ice export via Fram Strait.

Collapse of the Nares ice bridge is imminent.


Forecast

These forecasts represent what I expect to see based on a continuation of general trends.

Dates given should be taken as plus or minus 3 days.

The Nares ice bridge will be fragmented, and the ice in Kane Basin will be melting out by April 7th.

Ice from Lincoln Sea will be advecting through Nares Strait by April 14th.

The main North West Passage ice will show strong evidence of breakup and melt by April 30th.

By April 30th, ice extent graphs will show a strong downward trend similar to that of May - June 2010.

-------------------------------------------------
Sources:


http://nsidc.org/arcticseaicenews/2011/010511.html
Polar Science Center
http://arctic.atmos.uiuc.edu/cryosphere/
http://rapidfire.sci.gsfc.nasa.gov
http://www7320.nrlssc.navy.mil/pips2/


Further resources:

Arctic Sea Ice Blog
arctic sea ice graphs


Related articles:

Arctic Ice 2011 - Sail, Steam And Satellites
Arctic Ice March 2011
Arctic Ice March 2011 - Update #1
ice-in-baffin-bay
The ChatterBox Arctic Index

0 0

Printable Version  |  Link to this page

Comments

Prev  1  2  3  4  5  6  Next

Comments 51 to 100 out of 257:

  1. DB #25 Adelady #27 I imagine the same graph can be applied to Antarctica in the southern summer. So what does the colour on the graph mean DB? Is there a scale? Does that mean that Antarctica absorbs more heat in the southern summer than the tropics too?? I assume you mean 10N to 10S for the tropics. Adelady - my point is that the amounts of energy absorbed in Arctic ice melt are tiny compared with the purported amounts being absorbed by the Earth system globally.
    0 0
    Moderator Response:

    [DB] The scale is on the graph. Black=zero insolation, white=the most insolation. The Arctic in summer receives more daily energy from the sun, both at the surface and the TOA, than does the equator (Antarctic altitude and albedo effects there lessen the impact of its summer insolation surplus):

  2. Ken Which is sort of the other side of the coin I offered. With a huge caveat. The amount of heat "absorbed" in the Arctic whether tiny or not has been enough to wreck the ice, and it won't be long before there are much longer periods with much larger areas of open water. Wherein lies two problems. Firstly the heat (however tiny or large) which was formerly directed into melting ice that was many metres thick will no longer be absorbed that way, because the ice isn't there any more. It will be freer to circulate in oceans and atmosphere. Secondly, the Arctic is exposed to more sun than the tropics during summer because of the day length. So more and more open water with much lower albedo than ice or snow is exposed for longer and longer periods to radiation from sunlight. The Atlantic and Pacific waters which were previously cooled by their entry into the Arctic will not be cooled and could in some parts be warmed. This is entirely new territory.
    0 0
  3. I'm unsure why Ken is so focused on the energy that goes into melting. That energy is simply released again when the ice freezes, so it's a zero sum game (and it's inconsequentially small, to boot). But as I said earlier, and as adelady just reiterated, what matters is not the energy that goes into melting ice, but rather the energy that goes into the ocean after the ice has melted (and which otherwise would have been reflected back into space). This is the problem with melting Arctic ice, that after it has melted, it is further warming the planet by changing the albedo in a part of the world that receives 24 hours of continuous sunlight at a fairly direct angle. That the ice refreezes when the days are instead 24 hours long is irrelevant. When the ice melts and the sun is up, the Earth warms. When the ice melts that much sooner in the spring, then the Earth warms for that much longer. Which then helps to melt the ice even sooner the following year if the planet is unable to shed the extra heat by then.
    0 0
  4. Ken Lambert at 00:45 AM, with the colouring on the graph representing W/m2, the Latitude scale being evenly divided does not acknowledge the effect of decreasing area per degree of latitude change and thus allow that to be visually appreciated. In the same way, a map of the world without some form of equal area projection would provide a distorted impression of the real world.
    0 0
  5. Johnd I don't see why the scale would have to "acknowledge" anything, it is not its function. It is not a scale of total energy received over the entire area. The insolation being given on w/sq.m it would be quite easy to estimate the total incoming energy by applying that to the surface area. Big deal. Talking about area, the real concern here is how much area of ocean is open to receive that many w/sq.m A real concern indeed.
    0 0
  6. Philippe Chantreau at 06:50 AM, I agree it's no big deal, for those who are aware of what they are being presented. However such visual depictions can create first impressions for those who are not so circumspect and readily accept what they see at face value. Your note about area is completely relevant. As the graphics indicate, they depict the energy received at the TOA and clearly acknowledge a dominating role to incoming solar radiation. The major factor standing between the incoming solar radiation and the ice will be clouds, and it is not only the nominal 2/3rds total global coverage, but the distribution pattern that controls what is your real concern of areas being open to receive incoming energy. This is drifting into other topics, but historical deforestation and seaboard human habitation have likely changed cloud distribution patterns 100's, even 1000's of km inland as some studies of factors affecting precipitation patterns indicate, meaning changes must have also occurred over adjacent ocean areas.
    0 0
  7. johnd#56: "The major factor standing between the incoming solar radiation and the ice will be clouds," Indeed. From Kay 2007: Reduced cloudiness and enhanced downwelling radiation are associated with the unprecedented 2007 Arctic sea ice loss. Over the Western Arctic Ocean, total summertime cloud cover estimated from spaceborne radar and lidar data decreased by 16% from 2006 to 2007. The clearer skies led to downwelling shortwave (longwave) radiative fluxes increases of +32 W/m2 (-4 W/m2) from 2006 to 2007 ... ... we suggest that in a warmer Arctic with thinner ice, cloud and shortwave radiation anomalies will play an increasingly important role in modulating summertime sea ice extent. So a warmer Arctic summer has decreasing cloud cover, leading to more energy input to the surface. Better hope those Spencer magic clouds are coming to the rescue soon.
    0 0
  8. johnd #54 and #56 MC #57 Quite right again johnd. Many of these charts showing large red areas of warming are Mercator projections which grossly distort the high latitudes and infinitely expand the north and south poles to the same dimension as the equator. Without an equal area projection, the proper scale of the Arctic is not obvious to the non-geographer. DB's Insolation chart captioned; "The Arctic in summer receives more daily energy from the sun, both at the surface and the TOA, than does the equator" is also misleading. What DB should have captioned is that the Insolation (energy flux)at TOA for May, June ,July is higher than at the equator, but the total energy available (W/sq.m x Area in sq.m) is small compared with the tropics due to the small surface area above 60N and the much higher average insolation through the whole year at tropical latitudes.
    0 0
  9. 58, Ken Lambert Yes, yes, of course. Nothing to worry about. All is well. It's only a tiny place, and it's cold and far away. Don't worry about the Arctic melting for the first time in tens (hundreds?) of thousands of years. Don't worry about global warming, people! It's nothing. It's all exaggerated alarmist tripe. The Arctic is small. The ice recovers every winter. Temperature records are unreliable. It's all natural. Et cetera, et cetera. How many thousands of excuses can the denial crowd come up with to justify coordinated collective irresponsibility?
    0 0
  10. Ken Lambert at 23:50 PM, given how so very very easy it would be to put the correct perspective into such depictions, it should be done as a matter of course instead of leaving it up to the viewer to visualise in their own mind, if they happen to twig that is. Another dissappointing aspect of the depiction was that it was centred on the calender year hence the boreal winter months. If instead the monthly values began 3 months earlier or later it would have allowed both the Arctic and Antarctic to be more readily compared. Of course the objective of the illustration was to emphasise the Arctic, however being able to more readily compare both poles would again have provided greater perspective for the viewer. Adjusting the time period to something other than the calender year is very often done for annual cycles in order to be depicted, and thus understood in their entirety without having the more critical peak or hollow cut in half at either end making appreciation of the cycle just that much more difficult.
    0 0
  11. Sphaerica at 01:11 AM , you seem to have missed what the charts presented by DB were clearly emphasising. Three times with the three different charts the argument for the dominating role of incoming solar radiation was clearly reinforced.
    0 0
  12. 61, johnd, No, John, I didn't miss anything, you did. You're getting carried away with comparing it to the tropics, when the comparison is irrelevant. Ken's "point":
    ...my point is that the amounts of energy absorbed in Arctic ice melt are tiny compared with the purported amounts being absorbed by the Earth system globally.
    And that's as silly as the denialist talking points that CO2 is only a "trace" gas, or that 2˚C warming isn't really that much. It's a completely ignorant position which is based on playing on people's unfamiliarity with the processes involved. The way you are comparing it to the tropics is woefully misleading. The Arctic does not need to be as big as the tropics for it to matter. What does matter is that all of that radiation is radiation which would otherwise (as in every summer for many, many thousands of years into the past) have been reflected into space. Instead it is being absorbed. Instead it is heating the planet, in addition to the heat being added by greenhouse gases. The amount being absorbed is far from inconsequential, and handwaving claims about the relative size of the polar region are nothing more than gamesmanship.
    0 0
  13. Sphaerica at 11:55 AM, what you say may be all well and good, but what are your plans to do something about it apart from promoting it as the most important issue facing mankind above all others. For instance, in relative terms, has global deforestation had a smaller or larger impact on global climate? Irrespective, that is something that not only can be addressed by mankind, but must be done for a whole host of benefits. I think the point Ken made was that everything had to be kept in perspective.
    0 0
    Moderator Response: [muoncounter] This is an Arctic ice thread. Global deforestation is well off-topic.
  14. 63, johnd, My observation is that your approach is to trivialize and ignore everything (claiming to calmly "keep it in perspective"), with the net result that currently surmountable problems will soon become insurmountable problems. Solutions are easy, as long as the world is committed to the problem. The current dilemma facing us today is how to keep people like you and Lambert from trivializing the startling observation that we will see an ice free Arctic in our lifetimes (and, I personally believe, in the next decade). If you can look at the indisputable fact of melting Arctic ice, yawn and say "so what?" then the world is in big, big trouble.
    0 0
  15. Sphaerica at 14:41 PM, I feel you are being "penny wise and pound foolish". Irrespective of what is happening, the melting is a symptom rather than the problem. If solar radiation is a the major factor as DB seemed to stress, then what are you going to do, have everybody wave their hands hoping to blow clouds back over the Arctic to reflect off the solar radiation? If we follow the solar radiation assertion, then shouldn't we be looking at if cloud patterns have changed, and if so has anything man done that could have affected that, or is it simply part of cyclic pattern. I have already indicated what I think may have changed cloud distribution to some degree in other parts of the global system. Every region is linked when it comes to climate. If you want to merely debate the symptoms, then this is the right thread. If you feel that the causes are perhaps more relevant then that will need to be discussed in the appropriate thread.
    0 0
  16. johnd, I doubt very much that clouds have had much to do with it (so far). There are probably clues here and here and here and most of all here
    0 0
  17. 65, johnd, What the heck are you talking about? No one is saying we need to take direct action to stop the Arctic from melting, other than to stop greenhouse gas emissions. You're creating straw men. Fact 1) The Arctic is melting, and it is very clear empirical evidence that the globe is warming in a way that has not been seen for many, many thousands (or tens of thousands or hundreds of thousands) of years. Fact 2) The act of melting the ice will cause a serious positive feedback which will add to the warming (and thus will increase future melting, which will further add to warming). Fact 3) Facts one and two point to a need to ignore denialist obfuscation (like trying to trivialize the melting of the Arctic ice by declaring that the Arctic is small in relation to the tropics) and instead begin to take reasoned, responsible action towards cutting fossil fuel emissions at the earliest possible date.
    0 0
  18. Sphaerica #67 "Facts one and two point to a need to ignore [--Snipped--] obfuscation (like trying to trivialize the melting of the Arctic ice by declaring that the Arctic is small in relation to the tropics) and instead begin to take reasoned, responsible action towards cutting fossil fuel emissions at the earliest possible date." Well it is small in relation to the tropics - and it should be looked at in terms of the total quantity of heat imbalance claimed to be available to warm the planet. " The act of melting the ice will cause a serious positive feedback which will add to the warming (and thus will increase future melting, which will further add to warming" You seem to be suggesting that the Arctic is some kind of ice melt trapdoor which lets in vast amounts of heat if it melts. Adelady seems to be of the same impression. There cannot be any more heat energy available than the Insolation at TOA. Loss of ice and more open ocean means less reflection and more absorbtion of the available solar radiation in the summer. But the numbers are tiny. To get a more accurate picture of the numbers - the Arctic ocean (15.3 million km2) is 3% of the Earth's surface and the area inside the Arctic circle 66N is about 4.4% (22.4 million km2). The Minimum Sea ice extent is 12 million km2 down by 0.27 million km2 from the previous low of 12.27 million km2 according to the original post. So we are talking about an extra 0.27 out of 12.27 (which is 2.2%) being open ocean exposed for 3 months to solar radiation with low or negligible albedo. This is 0.27 million km2 of the Earth's surface of 510 million km2 or 0.05% (5/100 of 1 percent). Antarctica has 90% of the planet's ice - kilometres thick. It is the big knob on the Earth's thermostat. The Arctic is a sideshow in comparison.
    0 0
  19. 68, Ken Lambert, Number silliness. Confuse people with "ooh, that's no so much" analogies. Nice try. First, Arctic ice extent is down from the 1978-2000 average by 40%. That's 6.5 million kilometers. In addition, even within the area that still has 15%+ ice, the ice is clearly not evenly distributed over the extent. There will be more ice at higher latitudes, where the angle of incidence of the sunlight is less direct. The areas which receive more direct sunlight will have much less ice, even if they are part of the minimum extent, and so the area we are considering is even greater than 6.5 million kilometers. You also talk about only 3 months of solar radiation with low or negligible albedo. This is wrong. First, the Arctic day at that time of year is 24 hours long, so every day is like two equatorial days (or 3 temperate days, to put things in perspective for the casual readers who tend to live in temperate climates), so 3 months are more like 6 to 9. Similarly, the area did have a low albedo when it was covered with ice. The albedo of water is very dependent on the angle of incidence. Since at that time of year the angle of incidence is great than that at the tropics (66˚ at peak), it is like a non-stop tropical sun. The albedo of snow/ice is 0.9. The albedo of water at an angle of incidence 40˚ or higher is 0.1. Far from negligible, it is quite the opposite. Open water at that angle absorbs almost everything the sun can beam down. 24 hours a day. Over an area greater than 6.5 million kilometers (versus what used to happen, before global warming kicked in). With almost nothing reflected back. And it's getting worse! The day will soon come when that 6.5 million km2 area is even larger. As far as Antarctica being "the big knob," that's silly. Antarctica is a continent, covered with mountains, so the surface is at altitude and always well below freezing. No melting on the continent itself is remotely possible. No matter how much the earth warms, the area of ice over Antarctica will not change. The "big knob" there can't be turned, so it's not a knob at all. Stop distracting and confusing people with gibberish.
    0 0
  20. Sphaerica If I could add but 2 things to the fine and salient points you've made: 1. I just wanted to reiterate and emphasize the point you've made about the looming albedo changes and length of days in the Arctic. The energy received in the Arctic summer is in excess of that received during the tropics - and this occurs for many weeks, 24/7. This imbalance has thinned the sea ice cap in the Arctic to the point where weather conditions alone could expose the Central Arctic Basin (and the area of the North Pole) to sunlight for the first time in millennia-to-hundreds-of-millennia). Essentially, the Arctic albedo could "flip" from it's natural white, highly reflective state to a very dark, very absorptive state. If the summer energy imbalance currently is enough to put the health of the Northern Hemisphere's refrigeration system "on the ropes", what will that energy imbalance do to our climate once it has "TKO'd" the polar cap? 2. Readership here at Skeptical Science are far more intelligent and discerning than those who would seek to dissemble and disinform would like to think. It should be obvious by now to those who've yet read this far on this thread as to which parties seek to provide information in full context, and which belong to the "D & D tribe". PS: Business-as-usual for another 20 years will essentially guarantee another 3-5 degrees C (or more) by 2100. The last time the world was that warm Antartica contained little ice (but Bob is right in that it will still take centuries-to-millennia to completely dissipate). The Yooper
    0 0
  21. 70, Dan, Just to point out... when Antarctica was warm, it was considerably further north on the globe... about where Australia is, I think. I don't think there's any way that much more than the coasts of Antarctica could lose their ice, given today's geography. At the warmest times of the year, under direct sunlight, I believe most of Antarctica is still at least 20˚ below zero, because of the altitudes involved. Nothing can change that (unless Antarctica either deflates and sinks closer to sea level, or else floats north). I'm not an expert, though. If anyone has better information...
    0 0
    Moderator Response: (DB) Thanks for the reminder about the differing position of Antartica relative to today (trying to contribute over the phone & Kindle while traveling). Your assessment above is more complete than mine.
  22. Sphaerica @71, Antarctica along with Australia, to which it was still joined, was the most southerly continent from about 208 million years ago. It's southern coast reached the pole around 65 to 54 million years ago, and it largely straddled the pole (in almost its current position) between 54 and 38 million years ago. During the later period, Australia first fully separated from Antarctica, allowing a circumpolar current to develop which lead to the first ice sheets in Antarctica. Here are the approximate positions of the continents in the Eocene, some 50 million years ago: For comparison, here is a reconstruction of temperature change throughout the Cenozoic: So, given sufficiently high CO2 levels, I think Antarctica could certainly become ice free in summer (except for mountain peaks, obviously) again. However, that would require very high levels of CO2 (perhaps around 2000 ppm) sustained over several centuries, and possibly millennia. The West Antarctic Ice Shelf, on the other hand would probably be melted by sustaining current CO2 levels for a few centuries.
    0 0
  23. Sphaerica #69 "Stop distracting and confusing people with gibberish". When I went to school the Earth's axis was tilted at about 23.4 degrees to the plane of orbit around the sun. This means that at the poles, the sun's angle of incidence is +23.4 degrees in the summer and -23.4 degrees in the winter (it is in the shade). The Arctic was famously called the land of the midnight sun in the middle of the northern summer because on the Arctic circle at noon the angle of incidence was a maximum of 46.8 (2 x 23.4) degrees and at midnight it was 0 degrees but still light because the 23.4 degree tilt of the Earth kept the latitude of 66.6 degrees north just tangential to the sun. The Earth still rotates once every 24 hours (even in the Arctic summer cooker), and therefore in a 24 hour period the whole of the 4.4% of the Arctic surface above 66.6N is subjected to a varying angle of incidence between 46.8 degrees and 0. Average 23.4 degrees. The Sine of 23.4 degrees is 0.4 which means that the inverse is about 2.5. The polar solar radiation at TOA will therefore irradiate 2.4 sq.m of area at 23.4 degrees angle of incidence, compared with 1.09 sq.m at the Equator and 1.00 sq.m at the Tropic of Cancer at the northern summer solstice. Further, the solar energy has to travel commensurately further through the Earth's atmosphere at these low incidence angles and is subject to more scatter. To quote you: "Since at that time of year the angle of incidence is great than that at the tropics (66˚ at peak), it is like a non-stop tropical sun." The Arctic summer peak at the pole, dear Sphaerica, is not 66 degrees angle of incidence, but 23.4 degrees. So what was this about my talking gibberish?
    0 0
  24. Sorry slight typo: The polar solar radiation at TOA will therefore irradiate 2.5 sq.m of area at 23.4 degrees angle of incidence.............
    0 0
  25. On Antarctica, keep in mind that it is undergoing significant ice mass loss >currently< despite the sub-zero air temperatures. This is because water temperatures do get above freezing and lead to breakup of ice shelves and coastal ice that sea water can undermine. Loss of that coastal ice also allows the formerly 'land locked' ice behind it to flow towards the sea much more quickly. Thus, even without a huge further increase in CO2 levels we can likely expect to see the total volume of Antarctic ice slowly decreasing until mass gain and loss come into equilibrium again... which probably wouldn't happen until all the thicker ice which formed under the previous equilibrium state has flowed out to sea and been replaced by thinner ice formed at the new accumulation rate... which would likely require thousands of years. Thus, I'd agree that we likely won't see much increase in the amount of ice-free coastline unless CO2/temperatures go up significantly, but that doesn't mean Antarctica won't be losing ice mass. The ice area may not change much, but the volume / mass will. Which is actually similar to what we have been seeing in the Arctic... decrease in ice area / extent lags significantly behind decrease in ice volume / mass.
    0 0
  26. Wow, the contrarians sure are trying hard to derail this thread and ignore the canary in the coal mine that is the dramatic loss of summer Arctic sea ice (and land ice)-- paying attention to that is in fact placing things in perspective (see quote below). The obfuscation here by contrarians and wanna-be skeptics smacks of pure desperation. As for control knobs of global temperatures--on an annual scale-- it is the mid and high latitude continents that are the a major control knob, as evidenced by the peak in global temperatures observed during the summer months that is clearly visible in the lower troposphere satellite data. It is for this reason that Dr. Meier from the NSIDC (National Snow and Ice Data Center in the USA) is on record saying that "Arctic sea ice functions like an air conditioner for the global climate system by naturally cooling air and water masses, playing a key role in ocean circulation and reflecting solar radiation back into space". Now who to take seriously? Contrarian, D-K type posters on an internet blog or the NSIDC? The NSIDC of course. Intriguing how the loss of the "air conditioner" does not concern some-- how incredibly myopic. CBDunkerson @75 is right, the Antarctic is losing ice mass, and at an accelerated rate too if I recall correctly.
    0 0
  27. Perhaps the "distracting and confusing people with gibberish" portion of the audience could take their 'argument' to the Flanner thread. And a kind reminder to those having difficulty with comprehension is that the title of this thread is: "Arctic Ice March 2011" And yes, having to perpetually deal with those who choose to dissemble and disinform is getting tiresome and annoying as it detracts from the science and the important issues at hand that should not be ignored (as some want readers to do)-- so I make no apologies for my terse and condescending tone towards those who seek to dissemble and disinform on the science.
    0 0
  28. Ken Lambert at 00:38 AM, your quantifying of the various factors, area, insolation etc, have been effective counters to the emotional rhetoric that normally drives such debates. All the calculations you've done can be summed up by comparing the average situation as what is represented at the equinoxes, whereby the near polar regions have a nett energy deficit of about 200 w/m2, whilst the near equatorial regions have a nett energy surplus of about 200w/m2. The comment made by someone else earlier regarding considering the Arctic as an airconditioning system, this analogy can only be applied by acknowledging the fact that an airconditioner works by first removing hot air. In the planets "air conditioning" system this comes about by the flow of heat towards the equatorial regions. Because of the high cloud cover along the equator most heat is liberated from areas just north and south of the equator, where there are fewer clouds, and cloud cover is more variable. Thus irrespective of what angle the issue of Arctic ice is looked at, it is either clouds over the Arctic regions that control incoming solar radiation, or clouds along the near equatorial region that control the liberation of outgoing heat from the system that plays the major role. This is merely reflected by the polar regions, being controlled by a "knob" that is not in the polar regions.
    0 0
  29. Johnd, The obfuscation and dissembling continues. As for you opining "The comment made by someone else earlier regarding considering the Arctic as an airconditioning system, this analogy can only be applied by acknowledging the fact that an airconditioner works by first removing hot air." Please show some respect, that "someone else" was in fact Dr. Meier from the NSIDC--someone who in all likelihood knows more about the Arctic and the earth's climate system than you or Mr. Lambert could ever hope or dream to know. You of course have now elected to try and dissemble that statement in an attempt to fabricate more faux debate and to detract from the inconvenient loss of Arctic sea ice. If you want to talk clouds then take that to another thread (I have suggested the Flanner thread @ 77)--but ignoring or belittling the important role of lowering of albedo in the Arctic arising from the reduction in the snow and sea ice cover associated with AGW is not helping your cause or credibility. This thread, again, is essentially about the upcoming Arctic se ice melt season. Do you have anything specific to say about that? Is the sea ice minimum this year going to be greater or smaller than 2010? Please substantiate your answer with evidence as logicman has done.
    0 0
  30. Albatross#79: "The obfuscation and dissembling continues" We're actually in the midst of an obfuscation cross-fire. On this thread, friend KL declares that solar input to the Arctic is limited by geometry; based on this irrefutable argument, the sun can't be a significant factor in either warming the Arctic Ocean or melting ice. Over on the soot thread, friend BP declares that soot, with its known capacity for absorbing energy, is responsible for melting Arctic ice. Which is it? Does the denier left-hand know what the denier right-hand is thinking? Or will this apparent conflict cause the deniersphere to implode?
    0 0
  31. Ken Lambert @73, based on the third chart in Daniel Bailey's post @43, the average summer sea ice has retreated just over 2 degrees of latitude over the last 30 years. At the latitude of the limit of summer sea ice, that represents an additional 0.01 percent of the Earth's surface in which sunlight is falling on ocean rather than ice. Allowing for the exposure time of only about three months, and arctic summer insolation of around 500 w/m^2, and a change of albedo from 0.9 to 0.1, reasonable ball park figures, that represents a globally averaged forcing of 0.01 w/m^2 or just 1.25% of the equivalent change in greenhouse forcing over the same period. Complete loss of the ice cap would expose about 15 times as much ocean to direct sunlight, resulting in about 0.15 w/m^2 globally averaged, or about 8% of the change in CO2 forcing since the start of the industrial era. Obviously, globally averaged these effects are trivial. They do, however, represent a significant increase in regional forcing in the arctic. The regional increase from the melt since 1978 represents a 2.8% increase of forcings within the Arctic Circle; while the loss of the Ice Cap would represent a 43% increase in regional forcing. The small area within the arctic circle to which you allude means the small globally averaged effect of arctic ice melt has a correspondingly large regional effect, and is shown to be a significant factor in arctic amplification. What you are neglecting in terms of global effect is the consequence of early snow melts over northern latitude lands. A rough calculation shows that a one month earlier snow melt down to about 50 degrees latitude will result in a forcing comparable to the change in green house forcing over the last 30 years. These are just ball park figures. A more detailed analysis was made by Flanner et al who estimate that combined ice and snow effects result in a forcing of around 0.63 w/m^2 over the last 30 years, or nearly 80% of the greenhouse gas forcing over the same period. This discussion, if important, should probably continue on the thread discussing that paper.
    0 0
  32. muoncounter #80 The BP Arctic ice melt due to soot argument and mine are not incompatible. Tell us what is the average albedo of ocean surface at an average Arctic angle of incidence of 23.4 degrees, and what is the albedo of sooty snow and ice at similar angles of incidence? It seems that Sphaerica made the claim that I was talking gibberish and he (she) was sure that the Arctic ice melt was due to insolation higher than the tropics with a sun incidence angle of 66 degrees at the North Pole. I simply pointed pointed that this was wrong in fact. Sphaerica has not responded to claim that my schoolbook planetary geometry is wrong - nor has anyone else. Johnd makes salient points about heat flows affecting Arctic melt.
    0 0
  33. Tom Curtis #81 I am glad your calculation agrees with mine that the effect of arctic ice melt is trivial (2.8% increase in arctic forcings since 1978). The leap is then made to 43% with a loss of the 'ice cap' - presumably the summer sea ice disappears entirely. So how then is the leap made to one month earlier snow melts down to 50 degrees north and 0.63W/sq.m? And all this from an area of the Earth's surface of less than 4.4%?? What about the effects on the other 95.6% of the Earth's surface, like the 70% occupied by the oceans where we still can't find the absorbed heat. Last time I looked there were hardly any Argo buoys above 60 degrees north, so what monitoring of ocean temperatures are we relying on to measure the solar energy absorbed in the Artic ocean?
    0 0
  34. Ken Lambert @83 As pointed out in my preceding post, the loss of the complete ice cap would expose 15 times as much water as has been exposed by the increased summer melts over the last 30 years. 15 * 2.8% = 42% (the 43 being a consequence of slightly different roundings). For the snow, approximately 12% of the Earth's surface lies north of 50 degrees North. The average insolation in spring in the NH at those latitudes is of the order of 200 w/m^2. I estimated the change in albedo from snow to earth as being about 0.4, which is very conservative, although treating all areas north of 50 north is, of course, not. That yields a ball park figure of 0.8 w/m^2 globally averaged. (In truth the land area effected by reduced snow cover is significantly less than used in my calculation, but then the effect is evident for significantly more than the one month I allowed, so the figure is a reasonable indicator of the magnitude of the effect.) The 0.63 w/m^2 comes from a scientific study that broke the effect down cell by cell, month by month from actually measured data. There is no ball park involved in that study, but there is an uncertainty, with bounds of 0.33 to 1.07 w/m^2. Follow the link provided for more detail. As you noted, the area enclosed by the arctic circle, which you noted is at 66.4 degrees North, is about 4.4% of the Earth's surface. However, not all land north of 50 degrees north is within the arctic circle. Why are you assuming that only forcings within the arctic circle itself have contributed to polar amplification? Finally, I can make a reasonable estimate of how much of incident solar radiation is absorbed by arctic oceans because the laws of physics do not change with latitude. Ergo the emissivity of arctic oceans closely matches those of oceans everywhere, and though the low angle of incidence does increase reflectivity, it is overall a minor effect. Bear in mind that even tropical oceans have sunsets and sunrises, and that in consequence they have high angles of incidence for only a short period of every day.
    0 0
  35. It seems clear that the decline in Arctic ice volume (both land and sea) is being driven by a combination of factors; the same increased greenhouse warming impacting the entire planet (though somewhat higher here since carbon maps show northern hemisphere and polar CO2 levels frequently higher that other regions), additional warming due to changes in albedo as ice melts, additional warming due to changes in ocean currents bringing in more heat from the tropics, increased transfer of ice out of the Arctic due to loss of ice blockages and stronger currents, et cetera. Thus, I'm not really seeing the importance of the whole 'how much impact does albedo change have' debate. Theoretically, this should actually be the easiest factor to quantify (as the study Tom Curtis cites seems to have done)... but regardless of whether these albedo changes are causing 5%, 10%, 25%, or whatever of the ice loss... the ice is still being lost. Once it is gone we will still see profound changes in ocean currents and weather far beyond the bounds of the Arctic. Hence, I'm failing to see the point.
    0 0
  36. Just to put Ken Lambert's line of argument into perspective, the additional 0.01% of the Earth's surface that is exposed ocean rather than ice in the Arctic due to warming over the last 30 years absorbs an additional 1.34 * 10^22 Joules of energy each summer. That in turn is enough to melt 4 * 10^13 tonnes of ice, or 14 million square kilometers of sea ice with an average depth of 3 meters. That is nearly three times the extent of sea ice at the minimum in 2007, and more than two times the extent at the minimum of 2011. Of course, not all the ice is melted because much of the energy escapes to space rather than being used to melt ice. But Lambert's implied suggestion that because only a small part of the Earth's surface is effected, therefore the energy involved is inconsequential is simply false. Further, once the entire cryosphere is considered, the implied suggestion of little global impact is also shown to be false by Flanner et al, with the total NH cryosphere feedback representing about 80% of the initial GHG forcing over the last 30 years.
    0 0
  37. Ken, "Sphaerica has not responded to claim that my schoolbook planetary geometry is wrong - nor has anyone else." With respect I have personally decided not to do so b/c I am trying not to send this thread even further off topic.
    0 0
  38. Actually, muoncounter @80 makes an excellent point. BP is trying to claim that most of the ice loss was from albedo effects arising from soot. Here other claims are being made, while at the same time making the incredibly weak argument that the dramatic Arctic ice loss to date (and in the future), is of little consequence. Thank you John, Ken and BP for showing the incoherence, inconsistencies and sometimes contradictory nature of arguments used by "skeptics". CBDunkerson summarises the salient points in their post at 85-- Thanks CB. Now maybe it is time to ass Ken the same question that I asked JohnD @79: "This thread, again, is essentially about the upcoming Arctic se[a] ice melt season. Do you [Ken] have anything specific to say about that? Is the sea ice minimum this year going to be greater or smaller than 2010? Please substantiate your answer with evidence as logicman has done." Thanks too Tom for your comments refuting yet more BS from 'skeptics' (does it ever end?).
    0 0
  39. Moderator's, perhaps all future comments along the lines of "the ice loss is not significant for the earth's climate system", and all associated correspondence should be moved to a more appropriate thread? And if people insists with following this line of reasoning here, their should be deleted. Fell free to delete this once read.
    0 0
  40. Ken, I stopped responding because you're in clear denial and therefore not open minded in any way, so there is no point to continuing this. Briefly, the simple answer to your geometry question is that we're not talking only about the exact spot of the north pole, but rather the entire area affected by ice. I did err in the 66˚ -- the angle of incidence in the area in question is probably between 30˚ and 38˚, but that still gives open water an albedo that is substantially more than "negligible", so your argument is still moot. More importantly, I'd also point out that your efforts to say that any feedback effects would be trivial are equivalent to saying the same about feedbacks from glaciers, natural CO2 release, methane release, clouds, deforestation, etc., etc. The fact is that that you can make your "ooh, it's so small" argument about any one feedback (except H2O). The problem is that while you can try to argue that the effect of any one feedback is small, the sum of the feedbacks is not not. Many lines of evidence point to the sum of those feedbacks being equal to roughly double the initial forcing. You can't argue that away, and this is a case of a feedback developing before our eyes. The point is that this is a clear positive feedback, it's easily observed, it's something that hasn't happened in many millenia, and it's getting worse -- as per the original post, there is a good chance that this summer will see one of the lowest extents or the lowest extent on record. Denial that the globe is warming is that much more difficult to spew with a straight face as a result. No more on this. It's become silly and repetitive.
    0 0
  41. KL#82: "BP Arctic ice melt due to soot argument and mine are not incompatible." Of course they are not incompatible: You minimize the warming effect of sunlight; he maximizes it. Obviously both are right. Various authors put the BC albedo effect as equivalent to a forcing of between 0.06-0.3 W/m^2. Is that was significant compared to the following? Sphaerica#90, "that still gives open water an albedo that is substantially more than "negligible"" Key point. Here are some comparisons of albedo for a variety of Arctic settings. By far, the worst case (lowest albedo) is the difference between snow/ice (0.65-0.8) and open water (0.07-0.2). That was the problem identified by Serreze et al 2009: This Arctic amplification is largely driven by loss of the sea ice cover, allowing for strong heat transfers from the ocean to the atmosphere. And that is indeed the subject of the Flanner thread, where the equivalent forcing is found to be in excess of 0.6 W/m^2. Worse still, if the predictions in the post are even close, the open water season will be that much longer than in years past.
    0 0
  42. I would like to thank everybody who has contributed comments to this thread. Yes, everybody. It feels good to have people agree with me, but it takes a contrarian to make me check that I have covered all the bases. Is Arctic ice loss due to natural variation? Patterns of natural variability play a part in Arctic sea ice decline. The Arctic Oscillation is a major atmospheric circulation pattern that can take a positive or negative mode. In its positive mode, it sets up winds that tend to break up sea ice and flush it out of the Arctic, and the thin ice left behind is more likely to melt. In its strongly positive phase in the early to mid-1990s, the oscillation may have made sea ice more vulnerable to summertime melt. Since the late 1990s, however, the Arctic Oscillation has exhibited a more neutral mode, while sea ice has continued to decline. Sea ice decline has persisted through different patterns of precipitation, wind, and local temperature variation. Researchers have found marked declines in sea ice difficult to explain without considering overall Arctic warming. My emphasis. http://earthobservatory.nasa.gov/IOTD/view.php?id=5887 Ice gets younger Based on results of a simple model that keeps track of the age of ice as it moves about on the Arctic Ocean, we show that the areal coverage of thick multi-year ice decreased precipitously during 1989–1990 when the Arctic Oscillation was in an extreme “high index” state, and has remained low since that time. Under these conditions, younger, thinner ice anomalies recirculate back to the Alaskan coast more quickly, decreasing the time that new ice has to ridge and thicken before returning for another melt season. Rigor, I. G., and J. M. Wallace (2004), Variations in the age of Arctic sea-ice and summer sea-ice extent, Geophys. Res. Lett., 31, L09401, doi:10.1029/2004GL019492. http://www.agu.org/journals/ABS/2004/2004GL019492.shtml 'Tropical' heating of the arctic: The first person to write about this effect was George Best. I propose that we should call this the Best Effect in his honor. http://www.science20.com/chatter_box/george_best_elizabethan_climate_scientist Recent Arctic amplification. I have compiled a collection of images and citations for the decade 2001 to 2011 which show the breaking of record after record. Total loss of Arctic sea ice has long been predicted. We are now solidly in the region of, not if, but when. http://www.science20.com/chatter_box/arctic_decade_2001_2011-77700
    0 0
  43. if there is a clear feedback from insolation, how do you explain that ice is currently growing again despite the relatively low maximum? and how do you explain that the extent has stabilized after the 2007 minimum? this is not supposed to happen in case of a positive feedback, things should only worsen !
    0 0
  44. Gilles, This is the up to date graph on CT of sea ice *area*. Take a very good, close look at the last 4 months. Then look at the 2 years as a whole. Not once does the line representing the last 2 years so much as touch the 79-08 baseline. The current anomaly is over 900000sqkm below the baseline. If you see growth there, won't you tell me how.
    0 0
  45. Gilles @93, it takes a very creative imagination to see this graph as "stabilization": It takes an even more creative imagination to see the slight uptick in sea ice extent over the last week as being the start of a recovering trend, rather than just a minor fluctuation like the seven similar upticks that preceded it. But it takes unmitigated gall to interpret "x is a positive feedback" as "x is a positive feedback and is the only influence on events" so that you can conclude that "the effects of x should result in a monotonic trend". Especially when the positive feedback is dependent on the strength of insolation, which is currently about a third of the summer peak. The question you should really ask yourself is how stupid to you think climate scientists are? Do you really think they would make a prediction of a monotonic trend when any glance at a graph shows the trend to not be monotonic? They are clearly not that stupid, so your attempt to interpret their views as though that was the prediction is either shere folly, or unmitigated mendaciousness. Back on topic: I'll go with Tamino with a predicted minimum sea ice extent approximately equal to that in 2008.
    0 0
  46. I am just talking of the last week increase, that appears just at the end of the curve of sea ice area. There is no clear sign of feedbacks amplifying the variation, in my sense. Now concerning the interpretation of the decrease, I'd like to point out something important : it is generally impossible to interpret a variation over a period T if you don't have many similar periods of comparable lengths to compare with. A curve such the above graph for september extent looks very like the curve of the temperature during an afternoon or during the six last months of one year. However nobody would worry about them, because we know that these variations are "normal" in the sense that they belong to a periodic pattern , that we can easily detect on a many years basis. But without a much larger period of observations, it is impossible to know if this periodicity exists (or at least the amplitude of random fluctuations around the average ) . So the above graph can only be interpreted if you have an idea of the natural variance of the signal BEFORE the measurement, so that you can express the variation as a signal to noise ratio. So : what is the natural noise of this curve before the beginning of measurements, at this time scale ? so we have accurate measurements of it ?
    0 0
  47. #95 But it takes unmitigated gall to interpret "x is a positive feedback" as "x is a positive feedback and is the only influence on events" the only meaningful question is that if this positive feedback has a significative impact on the curve, or not. If yes : where do you see it ?
    0 0
  48. "Back on topic: I'll go with Tamino with a predicted minimum sea ice extent approximately equal to that in 2008." I'll predict that you will be approximately right.
    0 0
  49. Gilles@96 Go back to the OP and have a look at "the tale of the tape" (just below the Kara Sea pic). It really is necessary to go to CT so you can look at the full width display. And at http://img215.imageshack.us/f/ctarcticareato150111.png/ here's a graph I asked a friend to prepare based on 'tale of the tape' to clarify the apparent trend in the anomaly graph as presented. As for the apparent uptick during the last week! That's just like weather, heatwaves, rainfall, whatever in a particular location. You're clearly not an ice-watcher, otherwise you'd know that there's a lot of excitement from time to time about possibilities of double or triple apparent minima/ maxima. (if anyone wants to properly link that imageshack thing, go ahead. My clumsy and clueless approach led to me invoking the three strikes - out! rule.)
    0 0
  50. adelady, I know there is a trend + variability. I'm saying that there is no clear indication of positive feedbacks since large excursions below the trend are not followed by an exponential decrease, going and faster and faster, but are generally followed by a return to the trend. The trend itself is measured only with the accurate satellite measurements, which weren't available before - so as I said it is very difficult to give a precise estimate of the natural noise. Unless you know perfectly the amplitude of spontaneous variability at this particular frequency (30 yrs)-1 , you can't say if it is significative or not. Just a remark : the decrease has accelerated at the very time when global temperatures seemed to stabilize , or at least did not accelerate. So it's not obvious at all that both are correlated. Another remark is that there is much less variation in extent around mid-May - so actually the variations of minimal extent are due to the last weeks just before the minimum - it is not obvious at all that this is linked with any "memory" of previous years. And finally I'd like to stress that the decrease of multi-years old ice is just the logical consequence of a pronounced minimum some years ago - it proves nothing more. If the minimum stabilizes, the multi year ice should also stabilize or recover.
    0 0

Prev  1  2  3  4  5  6  Next

You need to be logged in to post a comment. Login via the left margin or if you're new, register here.


The Consensus Project Website

THE ESCALATOR

(free to republish)


© Copyright 2024 John Cook
Home | Translations | About Us | Privacy | Contact Us