Climate Science Glossary

Term Lookup

Enter a term in the search box to find its definition.

Settings

Use the controls in the far right panel to increase or decrease the number of terms automatically displayed (or to completely turn that feature off).

Term Lookup

Settings


All IPCC definitions taken from Climate Change 2007: The Physical Science Basis. Working Group I Contribution to the Fourth Assessment Report of the Intergovernmental Panel on Climate Change, Annex I, Glossary, pp. 941-954. Cambridge University Press.

Home Arguments Software Resources Comments The Consensus Project Translations About Support

Bluesky Facebook LinkedIn Mastodon MeWe

Twitter YouTube RSS Posts RSS Comments Email Subscribe


Climate's changed before
It's the sun
It's not bad
There is no consensus
It's cooling
Models are unreliable
Temp record is unreliable
Animals and plants can adapt
It hasn't warmed since 1998
Antarctica is gaining ice
View All Arguments...


Username
Password
New? Register here
Forgot your password?

Latest Posts

Archives

Arctic Ice March 2011

Posted on 30 March 2011 by logicman

This is a repost of my Science 2.0 article Arctic_Ice_March_2011_Update_#2, with an introduction, updates and minor edits.

Introduction

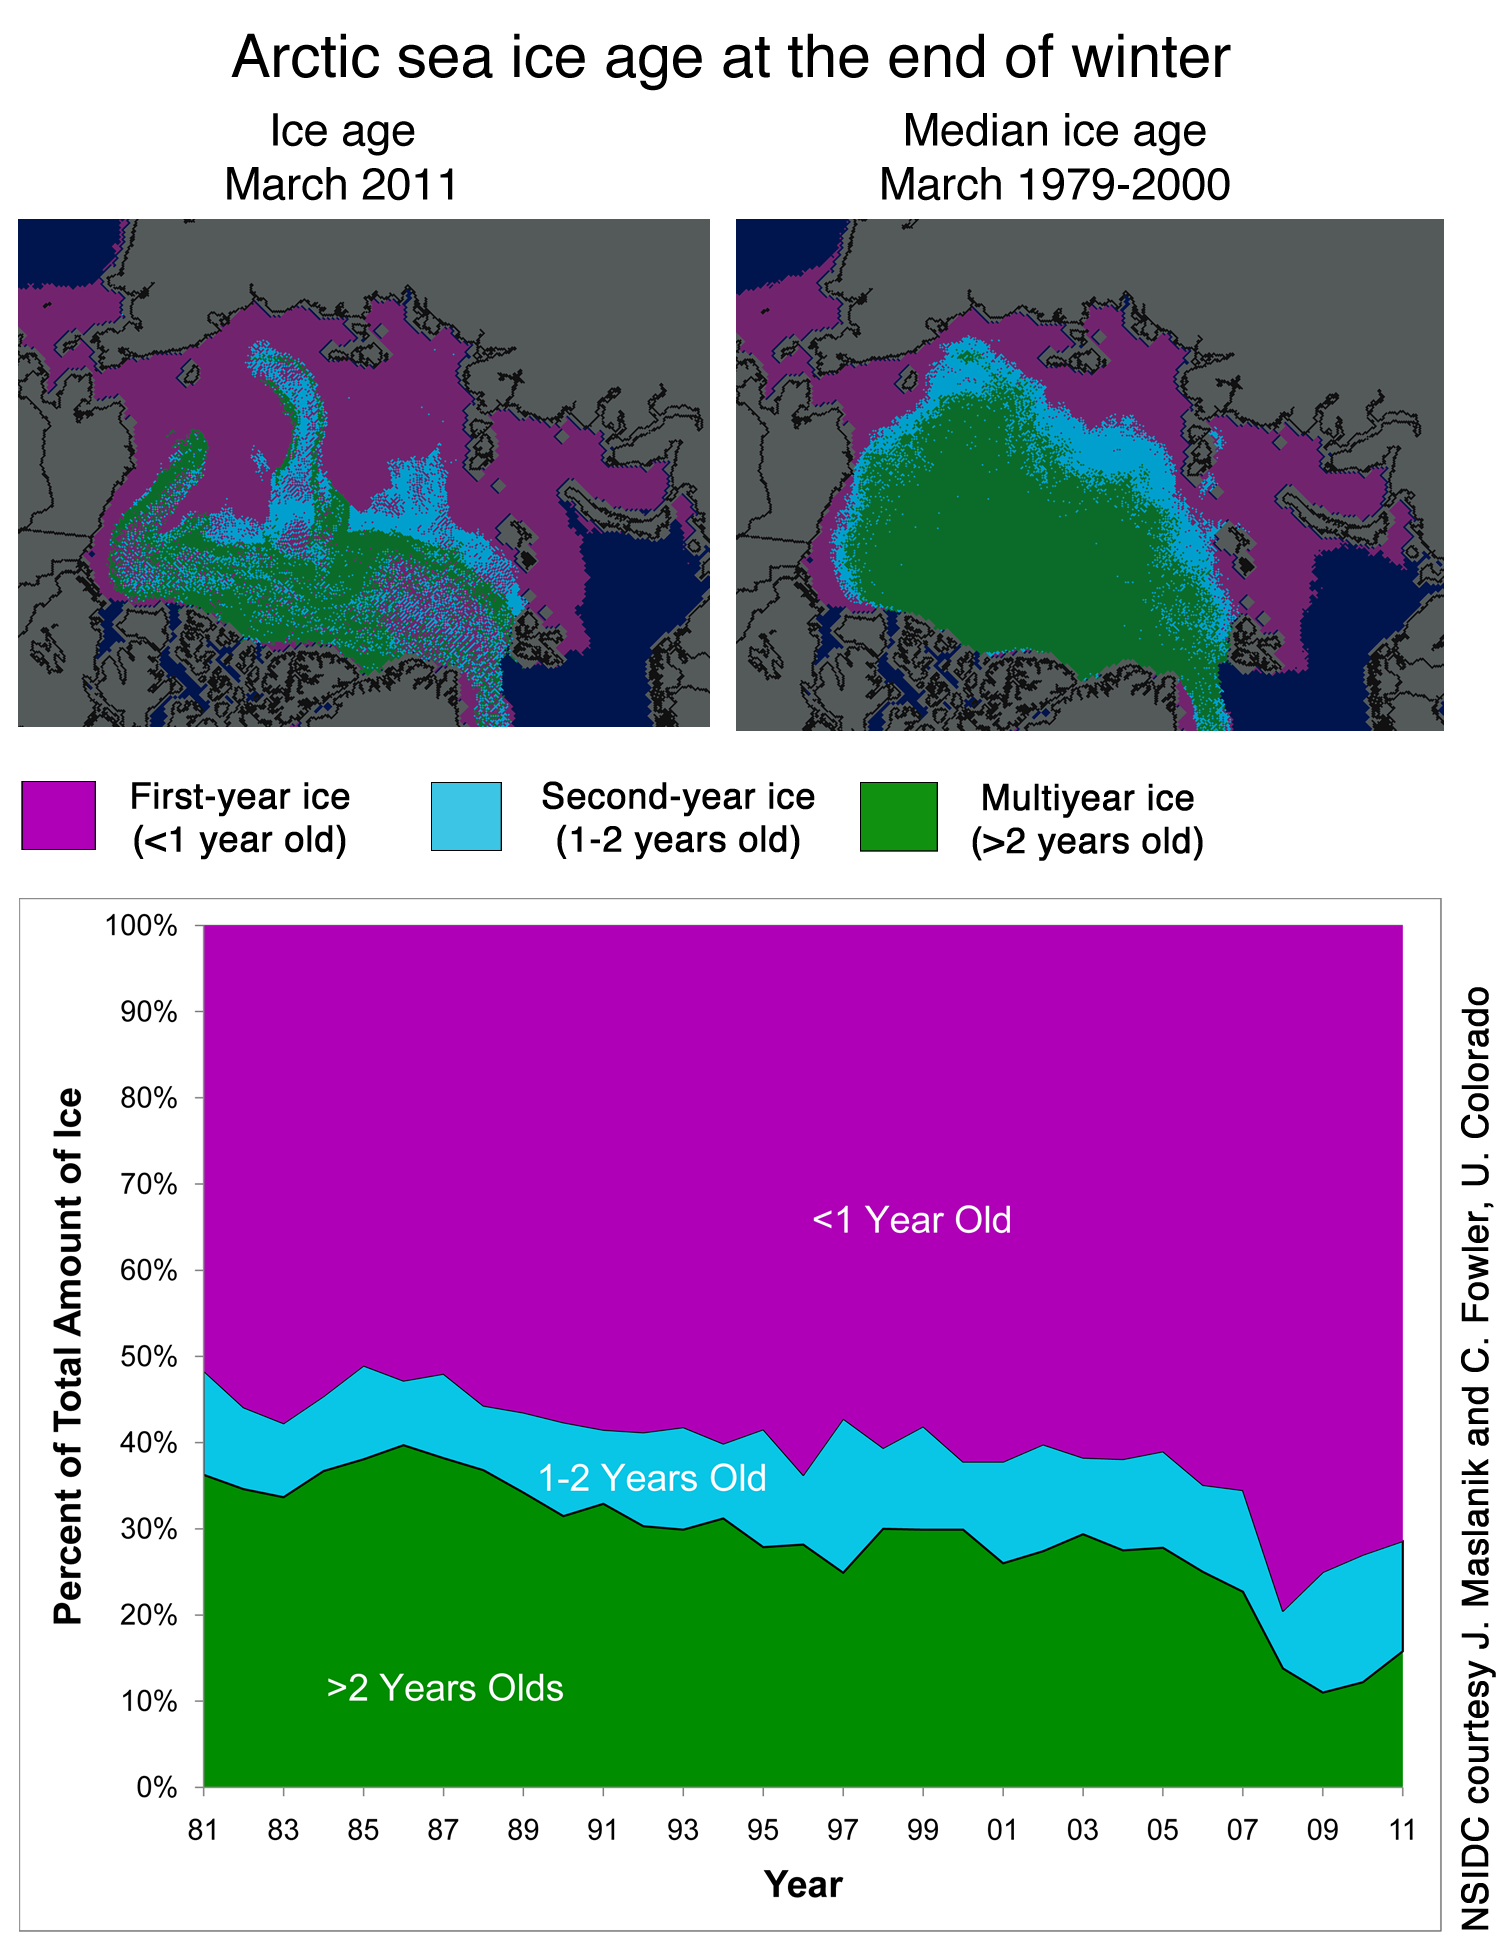
The main mass of Arctic sea ice has previously consisted mostly of thick multi-year ice.  In the winter of 2006 - 2007 there was a crossover: first year ice became the majority component.

The Arctic sea ice cap is getting younger.  A population of older ice is being replaced as the older ice is lost and new ice does not linger long enough to get old.  The former dominance of thick multi-year ice together with a gyratory motion caused new ice to enter the main pack and be trapped there for many years. The Transpolar Drift and Beaufort Gyre formerly brought new ice into the main pack and exported old ice - mainly on the Atlantic side through Fram Strait.  The export and import were formerly in broad balance.  They are not balanced now.

Younger and thinner ice now allows a more rapid transit of floes through the pack.  The age of the oldest ice is the length of time during which it was prevented from advecting south by being trapped in the main pack.

It appears that as the ice gets thinner and more mobile, that very mobility is a positive feedback to ice loss.

Arctic Ice March 2011

The melt season of 2010 ended with a low extent and with little ice older than two years. There are strong indications that the winter of 2010 - 2011 did not compact and thicken the sea ice as much as would normally be expected.

Arctic sea ice extent averaged over December 2010 was 12.00 million square kilometers (4.63 million square miles). This is the lowest December ice extent recorded in satellite observations from 1979 to 2010, 270,000 square kilometers (104,000 square miles) below the previous record low of 12.27 million square kilometers (4.74 million square miles) set in 2006 and 1.35 million square kilometers (521,000 square miles) below the 1979 to 2000 average.

... unfrozen areas of the ocean continued to release heat to the atmosphere, and an unusual circulation pattern brought warm air into the Arctic from the south. Although the air temperatures were still below freezing on average, the additional ocean and atmospheric heat slowed ice growth.

http://nsidc.org/arcticseaicenews/2011/010511.html

It appears to me that the 2011 melt season began with weaker, thinner, less consolidated ice than at any time in recorded history.  Where the slabbing and compaction has been least, the newest ice between the older floes is likely to melt soon.

I suggest that by mid-April the sea ice will be in a similar condition to that of late August 2010.  In plain terms, the 2011 melt season will soon continue more or less where the 2010 melt season left off.

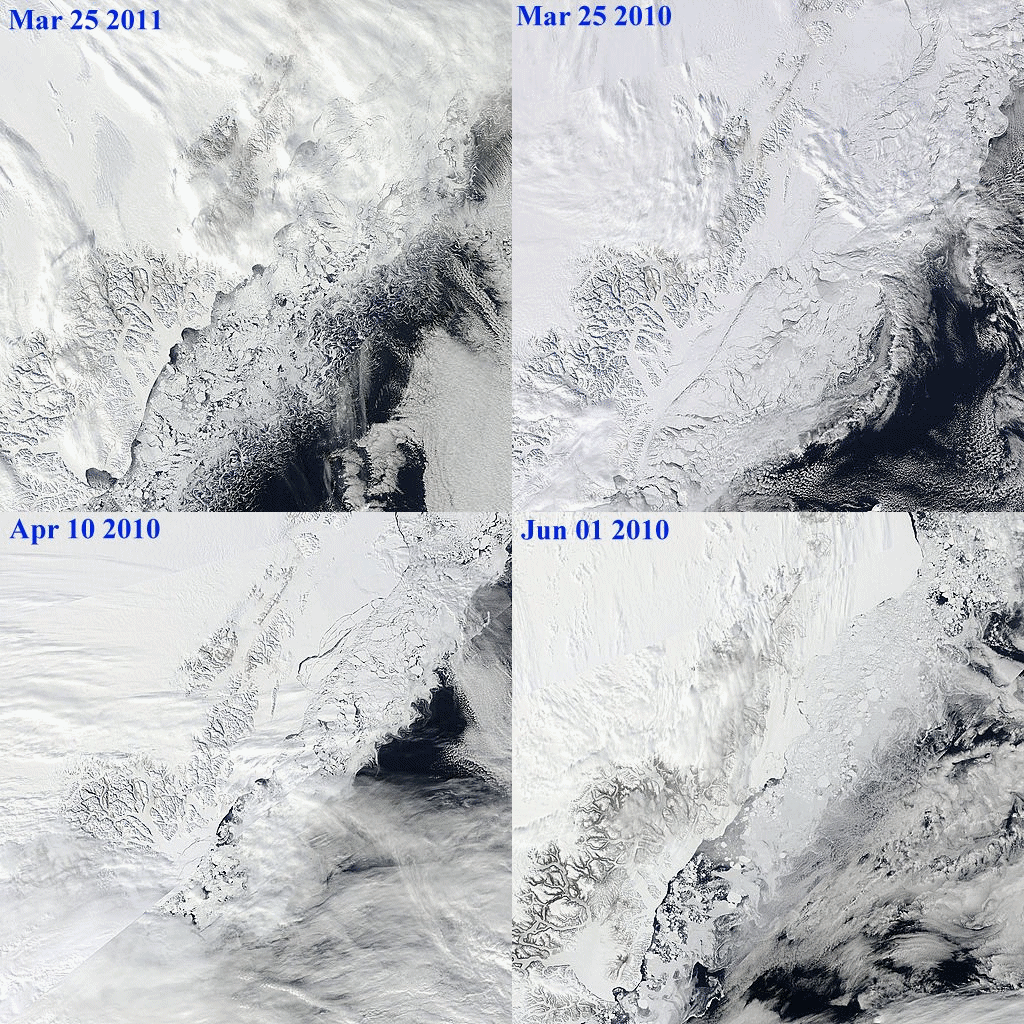
To illustrate that last point, this animation compares 25 March 2011 ice extent on Greenland's northeast coast with 25 March, 10 April, and 01 June 2010.
Scoresby animation
Ice extent comparisons - from MODIS Arctic mosaic images.


Melting and re-freezing

Many areas of the Arctic are melting, advecting and re-freezing.  This superimposes local variation noise on signals of ice extent.  I call this 'the Arctic ice jitters'.

Sea ice extent in February and March tends to be quite variable, because ice near the edge is thin and often quite dispersed. The thin ice is highly sensitive to weather, moving or melting quickly in response to changing winds and temperatures, and it often oscillates near the maximum extent for several days or weeks, as it has done this year.
Source: NSIDC report March 23, 2011

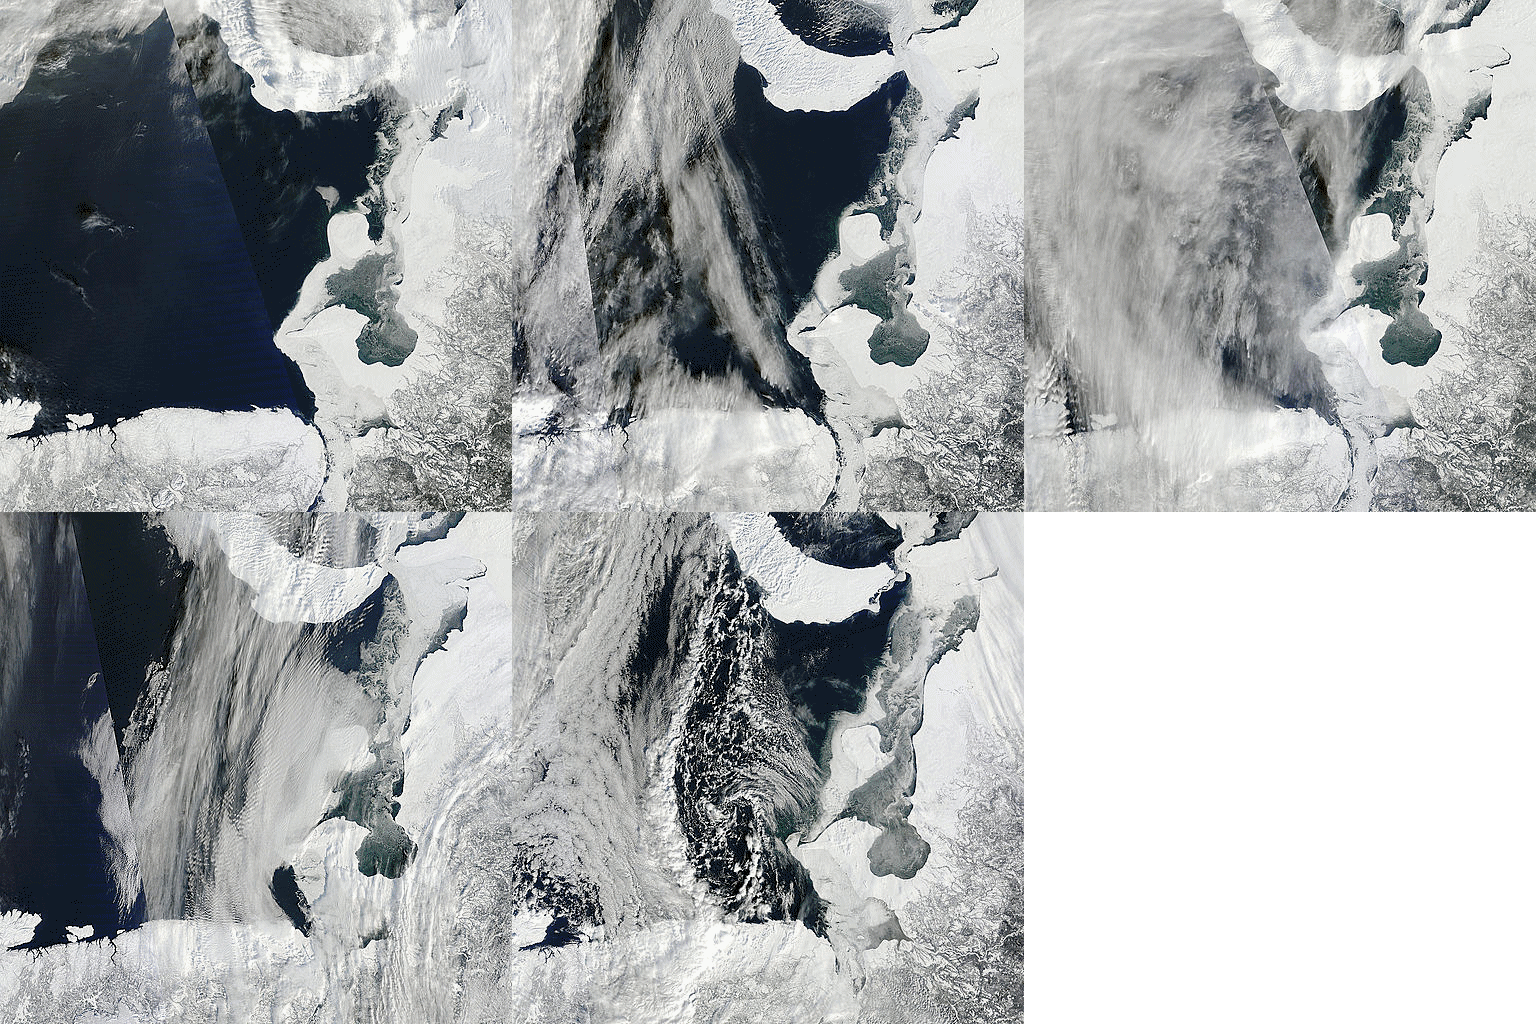
The following images show the ice jitter effect in an Arctic mosaic segment which includes Kara Strait.

Kara Strait ice jitter
Kara Strait - ice extent jitters

Note that this sea ice will appear in extent numbers but will have no impact whatsoever on the mass of ice in the main polar sea-ice cap.


The tale of the tape

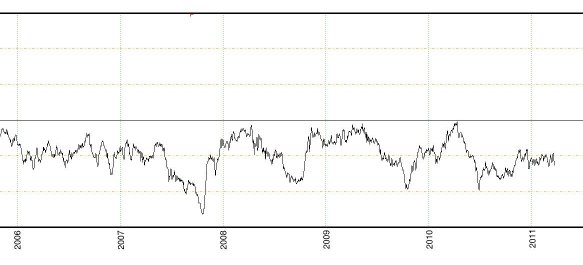
The unusual behaviour of Arctic ice this year is shown at a glance by the Cryosphere Today's 'tale of the tape':  the 2011 portion of the graph could not have been predicted from previous data.  The 2011 plot of anomalies is itself anomalous.
tape tail


The graph as a whole shows a clear negative anomaly trend since 1979.
tale of the tape
The latest update of the full sized 'tale of the tape' can be seen at http://arctic.atmos.uiuc.edu/cryosphere/

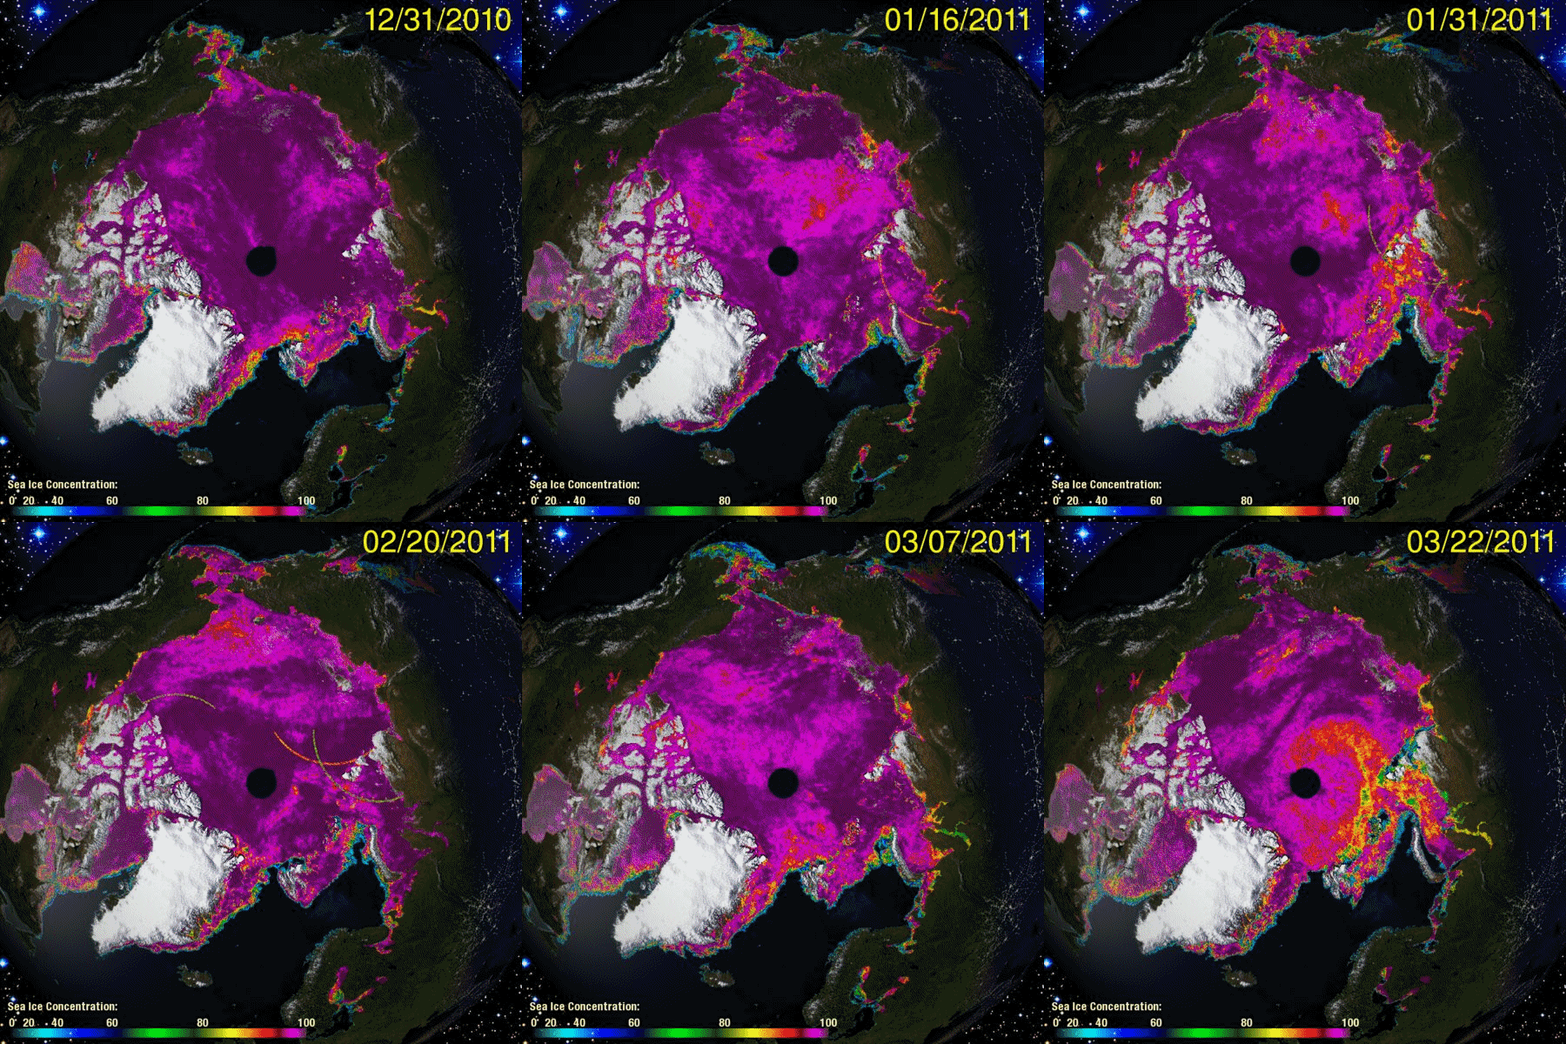
The animation below of the sea ice concentration chart from Cryosphere Today shows changes in ice distribution from 31 December 2010 to 22 March 2011 in 5 day steps.
cryosphere animation
Sea ice concentration Dec 31 2010 to Mar 22 2011

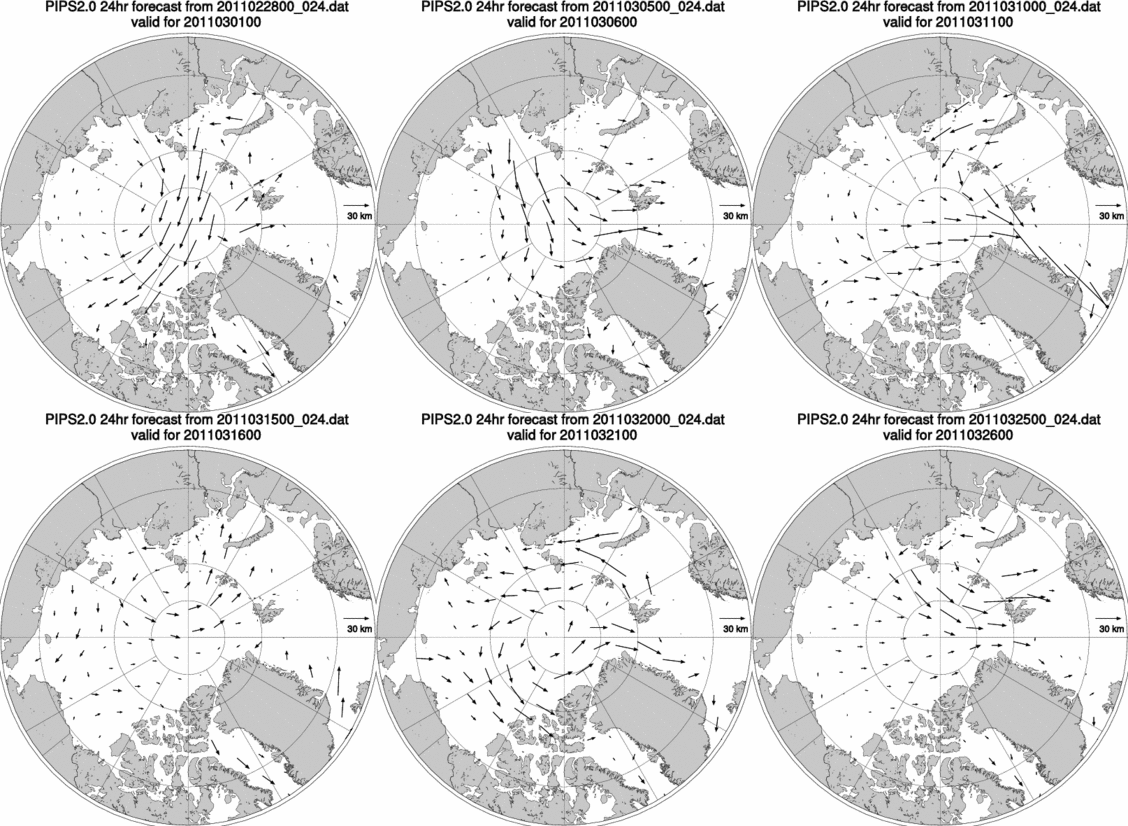
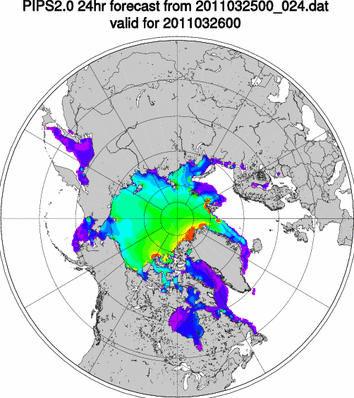
The chart of sea ice concentration should be read in conjunction with the PIPS ice displacement chart animation and the current ice thickness chart below.
ice displacement animation
Ice displacement charts from March 01 to March 25 2011

PIPS thickness
PIPS ice thickness forecast.

The red, yellow and green areas in the ice thickness chart are the last vestiges of sea ice thicker than 2.75 meters in the entire Arctic.  They consist of heavily fragmented ice much of which is being advected through the Fram Strait.  When the Nares Strait and NWP ice breaks up, that thick ice will be highly susceptible to advection through those passages.

The 3 to 5 thousand years old ice shelves which once extended north of Ellesmere island are now down to the last fragments.  If we discount those fragments there is little ice in the entire Arctic older than 5 years.  It bears constant repeating that the bulk of Arctic ice 2011 is 2 years old or less.

Nares Strait

Recent ice advection patterns; warm water advances into the Arctic from the Atlantic; ice distribution patterns: all of these things show that conditions continue to be advantageous for export of ice through Fram Strait.  Nares Strait is currently blocked by relatively weak ice.  As soon as the ice in Nares Strait breaks up, a continuation of current trends will be advantageous for the export of substantial volumes of the remaining older ice through that channel, supplementing the export through Fram Strait.

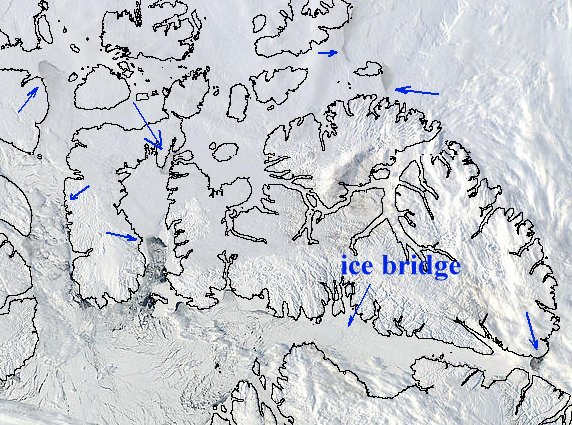
We are now (27 March 2011) within the time frame of my March 02, 2011 predition  for the breakup of the Nares Strait ice bridge.  Radar images show a melange of last year's floes and young ice.  This melange is so weak that a few cloudless days and / or a strong wind towards Baffin Bay will cause a rapid breakup of the ice bridge.  I expect to see ice being advected through Nares Strait about the 14th of April.
NWP Nares and Baffin Bay
NWP and Nares Strait

The arrows show 'places of interest' where ice is breaking up and being replaced by open water.  The ice bridge is still intact, but its breakup is imminent.
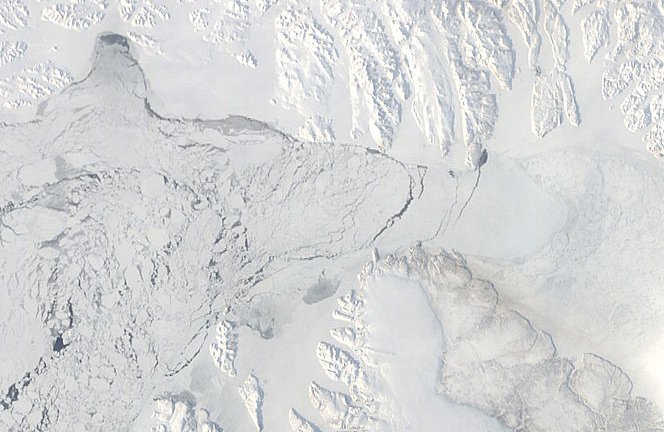
Nares ice bridge March 2011
Ice bridge at Kane Basin, Nares Strait March 26 2011


Ice volume

The decline in ice volume since 1979 is dramatically illustrated by this PIOMAS graph.
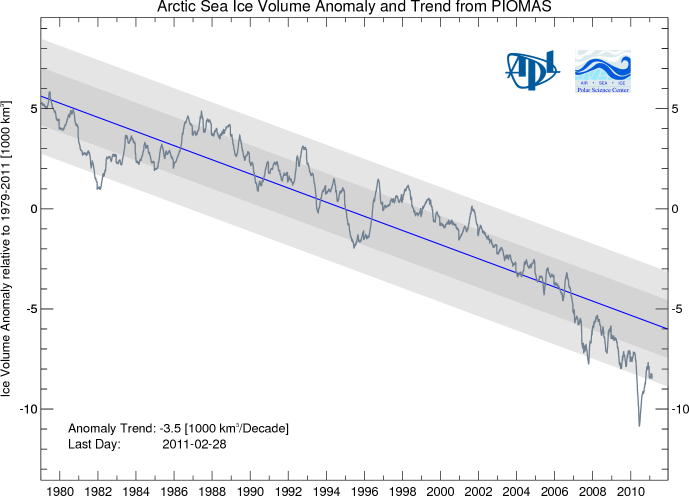
PIOMA ice volume
 
The importance of ice volume is that it reflects the ability of the Arctic sea ice cap to absorb heat without melting away entirely.  Thicker ice can survive summer melting longer than thinner ice.  Thicker ice has greater momentum by which massive floes slide over and under each other, slide over ice rubble, create massive compression ridges and generally make the ice more robust.  Thinner ice can melt away entirely, can fragment instead of slabbing.

An ice cap which is rejecting heat all winter can absorb the same amount of heat during summer without raising its temperature to the melting point.  Ice lost by ablation is readily replaced by the freezing of rain, snow and meltwater.  A robust ice cap, due to its thermal capacity, cannot melt away in summer.

The ice cap we see today is not robust.

Ice displacement patterns such as the one below will drive a great volume of ice out of the Arctic Ocean and into warmer waters.
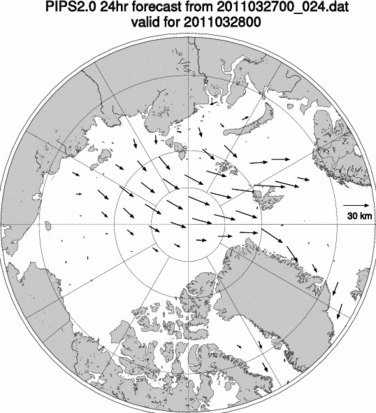
ice displacement

Summary

The melt season of 2011 is under way with less volume than former melt seasons.

Of that lesser volume, about 90% appears to be under 2.75 meters thick.

Much of the ice is less than 1 year old.

The Arctic's dynamic system seems primed to advect large quantities of ice out of the main ice cap area.

The Beaufort Gyre and Transpolar Drift have not yet appeared as stable patterns.  The instabilities in the ice drift patterns broadly favor ice export via Fram Strait.

Collapse of the Nares ice bridge is imminent.


Forecast

These forecasts represent what I expect to see based on a continuation of general trends.

Dates given should be taken as plus or minus 3 days.

The Nares ice bridge will be fragmented, and the ice in Kane Basin will be melting out by April 7th.

Ice from Lincoln Sea will be advecting through Nares Strait by April 14th.

The main North West Passage ice will show strong evidence of breakup and melt by April 30th.

By April 30th, ice extent graphs will show a strong downward trend similar to that of May - June 2010.

-------------------------------------------------
Sources:


http://nsidc.org/arcticseaicenews/2011/010511.html
Polar Science Center
http://arctic.atmos.uiuc.edu/cryosphere/
http://rapidfire.sci.gsfc.nasa.gov
http://www7320.nrlssc.navy.mil/pips2/


Further resources:

Arctic Sea Ice Blog
arctic sea ice graphs


Related articles:

Arctic Ice 2011 - Sail, Steam And Satellites
Arctic Ice March 2011
Arctic Ice March 2011 - Update #1
ice-in-baffin-bay
The ChatterBox Arctic Index

0 0

Printable Version  |  Link to this page

Comments

Prev  1  2  3  4  5  6  Next

Comments 101 to 150 out of 257:

  1. Gilles: "And finally I'd like to stress that the decrease of multi-years old ice is just the logical consequence of a pronounced minimum some years ago - it proves nothing more. If the minimum stabilizes, the multi year ice should also stabilize or recover." Since the "pronounced minimum" in 2007 the extents in 2008, 2009, and 2010 were all higher... yet multi-year ice and total ice volume continued to decline. Your postulate is thus disproven by already observed reality. Indeed, everything you have said in your last several comments on this thread is so terribly ridiculous as to make it difficult to credit that you could actually believe it. You are seriously arguing for Arctic sea ice recovery on the basis of a one week anomaly? No one could be that absurd.
    0 0
  2. 101 CBDunkerson "No one could be that absurd." Although I find that much of what you write has great insight and respects empirical results; this last remark clearly contradicts the evidence.
    0 0
  3. "Tom Curtis #86 at 00:41 AM on 5 April, 2011 Just to put Ken Lambert's line of argument into perspective, the additional 0.01% of the Earth's surface that is exposed ocean rather than ice in the Arctic due to warming over the last 30 years absorbs an additional 1.34 * 10^22 Joules of energy each summer. That in turn is enough to melt 4 * 10^13 tonnes of ice, or 14 million square kilometers of sea ice with an average depth of 3 meters. That is nearly three times the extent of sea ice at the minimum in 2007, and more than two times the extent at the minimum of 2011. Tom Curtis - your Arctic heat absorption numbers are wrong by two orders of magnitude. ie. 149 times. Dr Trenberth's (Aug09 paper)estimate of Sea ice loss for the period 2004-08 is 0.9E20 Joules/year. Your number of 1.34E22 Joules/summer is equal to 134E20 Joules/summer. Presumably there is no heat absorbed in winter so your summer number equals per year. So we compare Dr Trenberth's 0.9 with your 134. Your figure is 149 times Dr Trenberth's. The heat energy gained by the *whole planet* is (again Dr Trenberth's figure of) 145E20 Joules/year which equates to 0.9W/sq.m of warming imbalance at TOA. I quoted an Arctic sea ice figure of 1.0E20 Joules/year being 1/145th of the total global energy imbalance in an earlier post. This was from Table 1 of Dr Trenberth's Aug09 paper "Tracking Earth's global energy". The 0.9 number was rounded to 1.0 for the table. I suggest you familiarize yourself with it, and adjust your numbers downward by two orders of magnitude.
    0 0
  4. Sphaerica #90 "I stopped responding because you're in clear denial and therefore not open minded in any way, so there is no point to continuing this. Briefly, the simple answer to your geometry question is that we're not talking only about the exact spot of the north pole, but rather the entire area affected by ice. I did err in the 66˚ -- the angle of incidence in the area in question is probably between 30˚ and 38˚, but that still gives open water an albedo that is substantially more than "negligible", so your argument is still moot." I am not in enough denial to get my numbers wrong though, am I Sphaerica?? The angle of incidence is not a probability - it is a geometric fact determined by the tilt of the Earth's axis relative to the orbital plane about the sun. As the Arctic circle rotates once every 24 hours in the northern summer - half of the surface bounded by it will see the sun at an incidence angle of between 23.4 degrees and 0 degrees for 12 hours (night), and half will see it at between 23.4 and 46.8 degrees for 12 hours (day). The average angle will be that at the pole - 23.4 degrees. The open water albedo will be that for an incidence angle of 23.4 degrees - which is a lot higher than at 66 degrees (the equator) which is as low as 2% over calm water. My point remains - this all applies to the Arctic - 4.4% of the Earth's surface at an incidence angle of 23.4 degrees in the middle of summer with a combination of ice/snow and open water albedo. You should tell me what is the heat absorbing capacity of 4.4% of the Earth's surface area in the mid-Atlantic at the Tropic of Cancer over the northern summer with no ice and open water albedo at much higher incidence angles. Is it more or less than the Arctic? If it absorbs more heat (probably a lot more heat) - why are we all so excited by the Arctic instead of a 4.4% patch of the Earth in the mid-Atlantic?
    0 0
  5. Giles@93 How would I explain that ice is currently growing again despite the relatively low maximum? Easy, it is called "weather", and small peaks and troughs in sea ice extent are evident in the plots for every year. How do you explain that the extent has stabilized after the 2007 minimum? Again, weather. "This is not supposed to happen in case of a positive feedback, things should only worsen!" Incorrect, positive feedbak only biases sea ice extent downwards, if it was strong enough that the extent was forced to decrease monotonically the ice cap would have been too unstable to exist in the first place. The comment about stabilisation after 2007 suggests a lack of appreciation of the statistical issues. You only need to look at the data to see that the annual variability in sea ice extent is rather larger than the trend, so any "stabilisation" is likely to be statistically insignificant. In statistics there is also a thing called "regression to the mean", which implies that if you get a record high or low in some quantity, it is inlikely there will be another record low/high soon after (because record lows are caused by a conjunction of influences all acting together and such coincidences are generally rare). Your post is making the same mistake as "no global warming since 1998", i.e. drawing conclusions from a period too short to get statistical significance and cherry picking a start date that happens to be a record extremum.
    0 0
  6. 104, Ken, Of course it does, because no matter what anyone says, you conflate and distort and throw out reems of words, and declare yourself correct. This works for you, because you are in denial. But it convinces no one.
    0 0
  7. 93, Gilles,
    How would I explain that ice is currently growing again despite the relatively low maximum?
    If you watch the animation, you can see the ice "growing" at an alarming rate, on the order of hundreds of miles in days. I don't believe it's remotely possible that ice in the open ocean is freezing that fast. So what else could be happening? The ice further north is melting, breaking up, and drifting south. So the increase in ice extent (i.e. the area of ocean over which floating ice is detected) is expanding because of the ice melting further north, and drifting south. Ice extent at this time of year is virtually meaningless because of this effect. From the original post above:
    Sea ice extent in February and March tends to be quite variable, because ice near the edge is thin and often quite dispersed. The thin ice is highly sensitive to weather, moving or melting quickly in response to changing winds and temperatures, and it often oscillates near the maximum extent for several days or weeks, as it has done this year. Source: NSIDC report March 23, 2011
    0 0
  8. Gilles, I really hadn't grasped the source of your confusions on this. Just as warming does not mean that each succesive year must be warmer than all previous years, so declining ice does not mean that every year must be a new record minimaum. In fact, the ice is showing something we don't see in the global temperature. If you look back at that 'tale of the tape' graph above, you'll notice that several years and for decades before that the year to year variation in anomalies was quite small. However, the last 5 years show much greater year to year variation in anomalies. I suspect this reflects the much steeper decline in multi-year ice - which has tended to maintain the ice around it. Now that it's nearly gone, the year by year ice freeze and melt is showing much more variation.
    0 0
  9. 104, Ken,
    Is it more or less than the Arctic?
    This is the crux of your problem. The question is not whether the energy absorbed is large relative to anything other than what has always happened in the past thousands of years. The point is not whether it is large compared to the tropics, or the south pole, or to a light bulb. The point is that it's happening when it has never happened before... and it is going to happen every year! Every year the earth is going to absorb that much more energy that it never absorbed before, and which should be reflected back into space. And contrary to your efforts to treat the amount as inconsequential, it is not. Your argument is equivalent to claiming that the earth will never get as hot as the surface of the sun, so therefore global warming is negligible and not a problem.
    0 0
  10. #101Since the "pronounced minimum" in 2007 the extents in 2008, 2009, and 2010 were all higher... yet multi-year ice and total ice volume continued to decline." well that's not what i'm seeing here the 2007 minimum is logically followed by a minimum in 1-year old ice the year after, and by a minimum of 2-years old ice two years after ...there is no sign of non-linear feedback increasing the slope after these minima.
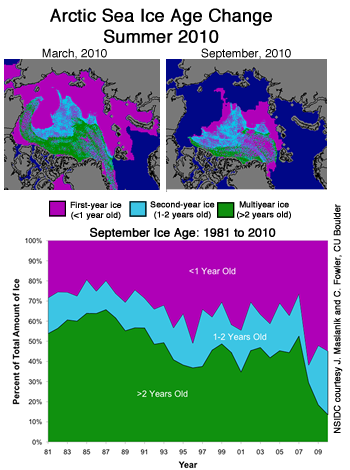
    0 0
  11. 105, 108 : again I wasn't arguing that the decrease has stopped. I was arguing that I couldn't see any evidence for a significative positive feedback. I know there are natural variability, weather, atmospheric patterns, call them like you want. I just say there is no obvious self-sustained acceleration through positive feedbacks.
    0 0
  12. Ken Lambert @103, thank you. I did in fact make an error in my spreadsheet, and thanks to your prompting I have corrected it. The correct values are: Additional energy absorbed due to melted sea ice in the Northern Summer: 6.2*10^21 Joules Tonnes of Ice melted if all that energy was used to melt ice: 1.8 * 10^13 tonnes Area of 3 meters thick ice melted if all the energy was used to melt ice: 6.7 x 10^6 km^2 Percentage of surviving ice cap melted if it was all applied to melt ice: 90% I believe these figures are more than sufficiently large enough to rebut any "its to small an effect to matter" style arguments. I have been through the figures again, and I do not think I have made any further errors. Indeed, I am making conservative assumptions in ignoring additional energy captured in the spring and autumn; and by neglecting the large portion of the ice that lies below 74 degrees latitude and which therefore would have a higher insolation (which would more than counterbalance the ice melt above that latitude). I have also treated the additional melt back over the 30 years as being 2 degrees latitude, whereas from the chart it is closer to 3. So, all in all, I am out by a factor of approx 2. I have searched through the only paper of Trenberth's published in August 2009 that I know of. It does not contain, that I can find, any figure for additional energy absorbed due to ice melt. Nor, indeed, would such a figure be relevant to the paper, so far as I can tell. It does mention that, annually, approximately 1*10^13 Joules of energy is consumed melting ice. That means the additional energy gained through melting of sea ice compared to the ice extents 30 years ago is approx 600 million times more than is needed to drive additional melting of ice that occurs each year (on average). So, until you can produce an exact quote from Trenberth, including a citation that quotes the title of the paper, I am going to conclude that the "discreprancy" is simply a consequence of your mistaking different figures as representing the same estimate. Specifically, I will assume that you have mistaken an estimate of total additional energy absorbed (what I calculated) for the net additional amount of energy absorbed, ie, the total additional amount absorbed minus the total additional increase in outgoing energy. Finally, as a reality check, according to Trenberth and Fasullo, "Changes in the flow of energy through the Earth's climate systems", 3.85 * 10^24 Joules flows through the Earth's system each year. The additional net energy absorbed due to water vapour and ice albedo feebacks is 3*10^22 joules. The net energy absorbed each year amounts to 1.5*10^22 joules. (Figures from the introduction to the article. Figures originally give as Petawatts, but converted to Joules by multiplying by (60*60*24*365.25). These figures are very hard to reconcile with your claims about Trenberth's results.
    0 0
  13. 111, Gilles,
    ...there is no obvious self-sustained acceleration through positive feedbacks
    And who ever said there was? You're creating a strawmen. obvious? self-sustained? acceleration? through positive feedbacks? Why the need to qualify things into such a bizarrely worded and so heavily qualified box? Why does it need to be obvious? Why does it need to be self-sustained (as opposed to caused by, and then contributing to, GHG induced global warming in a global, not regional, feedback loop)? Why does it need to be accelerating (it is, as clearly evidenced by the 30 year trend, but that's not the point)? Why is it only relevant if it is occurring through direct positive feedbacks (as opposed to CO2 alone, or through indirect feedbacks, that contribute to the overall rise in global temperature)? If you want to say "there is no obvious self-sustained acceleration through positive feedbacks" go right ahead. But taken individually: Summer Arctic ice extent is obviously decreasing. The trend is accelerating. The cause is CO2 induced global warming. One effect is an increased positive feedback due to decreased albedo over a large area of ocean during a time of year when insolation in that region is very high. So while your carefully constructed and obfuscating statement may be arguable, the component facts are not. When considered intelligently, rather than in a confused and confusing jumble of misrepresentations, the situation is nothing short of alarming.
    0 0
  14. Giles@111 Why would you expect to see evidence of positive feedback from just one week's observations. While you clearly know there is natural variability, you obviously don't understand that the shorter the period of observation, the more the results are dominated by natural variability (i.e. weather). That is pretty much weather-v-climate 101! If you want to see evidence of positive feedback, then the accelleration in ice loss over the last couple of decades is far better evidence (the thermal inertia of the oceans means that any immediate effect is going to be miniscule - but that doesn't mean that it stays miniscule if continued for a decade or two, rather than just for one whole week).
    0 0
  15. Wow, the contrarians and those in denial about AGW sure are in a tizzy now that the Arctic ice loss is ramping up. Really, contrarians are just resorting to trolling this thread now to fabricate debate, what is sad is how transparent it is; observant readers here will not fall for that ploy. They are simply not "seeing" the loss of multi-year ice (green shading) because they do not wish to let their mind comprehend it. There is clearly a mental block there. Arctic sea ice volume is decreasing, and at an accelerating rate (see PIOMAS data and NSIDC data). The issue of feedbacks feedbacks is also discussed here at the NSIDC site in a report titled "Weather and feedbacks lead to third-lowest extent". "Since the "pronounced minimum" in 2007 the extents in 2008, 2009, and 2010 were all higher... yet multi-year ice and total ice volume continued to decline" From NSIDC: "At the end of the summer 2010, under 15% of the ice remaining the Arctic was more than two years old, compared to 50 to 60% during the 1980s. There is virtually none of the oldest (at least five years old) ice remaining in the Arctic (less than 60,000 square kilometers [23,000 square miles] compared to 2 million square kilometers [722,000 square miles] during the 1980s)." So CBDunkerson and the NSIDC are in agreement. No surprises there, b/c unlike the contrarians, CB seems to actually consult the appropriate authorities and literature, and does not simply eyeball graphs to arrive at his/her preconceived notion. Sphaerica sums it up nicely @113, as does this figure from NSIDC:
    0 0
  16. Albatross#115: "does not simply eyeball graphs to arrive at his/her preconceived notion." Albatross, That's not playing fair: Without the ability to say 'I can't see it, so it must not be happening,' the denier doesn't have much of a leg to stand on!
    0 0
  17. adelady: thanks for the link to the CT graph. I haven't been able to embed it either. :) CT ice graph Gilles: positive feedbacks to Arctic sea ice loss act in a probabilistic fashion: over any randomly chosen subset of available data it is more probable that the ice will be seen to be decreasing than seen to be increasing. It's like gambling on heads or tails with a coin which has a bias towards heads. It may land tails up a few times in a row, but if you always bet on tails, in the long run you will lose money.
    0 0
  18. Here is the big scary decline in 12 years.
    0 0
  19. Even better to view it as a movie, as per NSIDC: Ice extent 1979-2009 (Quicktime) As a long term plot: Or to look at the multi-year ice extent: March 7 was the maximum sea ice extent this year; much more relevant is the minimum extent in about 5-6 months. Even then, it's "...tied for the lowest winter maximum extent in the satellite record", after March 2006. Somehow, Berényi, I'm not reassured by your data...
    0 0
  20. BP @118, Good grief, this is now getting tiresome, and we know that you can do better than this BP. You assured me quite some time ago that you were interested in the pursuit of "truth". However, your post @118 runs counter to that claim. Also, as John Cook keeps reminding us, good science requires us to look at the whole, collective picture, quite the opposite of what you have just done (and please do not rehash your PIPs maps here, you have done that elsewhere on SkS already.... No caveats, not context, no source other than two PIPs images, which seems to have become the darling of the contrarians and those in denial about Arctic sea ice loss or its ramifications. I wonder why? Your plots do not change the facts highlighted by Sphaerica @113. Perhaps you and I can agree on one point BP, namely that there will likely be a small, yet stubborn, area of sea ice north of Greenland and the Canadian archipelago in September and October in coming decades. PS: I am curious to see how well PIPS thickness data validates against the in-situ Catlin survey data and the Cryosat-2 data (now that it is freely available).
    0 0
  21. BP, How did this forecast made by you (here) in June 2010 pan out? "Looks like PIPS end-of-May sea ice volume is a pretty good predictor for their minimum ice volume in September. If we go with this observation, PIPS sea ice volume must exceed their figures for 1998-2000 in September, this year." Now is that the real ice volume or the ice volume in the virtual world of PIPs? Anyhow, curious to see also what you believe will happen this year and how that tallies with reality come September.
    0 0
  22. Tom Curtis #112 Here is the Trenberth Aug09 paper: http://www.cgd.ucar.edu/cas/Trenberth/trenberth.papers/EnergyDiagnostics09final2.pdf You say: "Additional energy absorbed due to melted sea ice in the Northern Summer: 6.2*10^21 Joules." This is 62E20 Joules/year - equal to more than half the whole purported energy imbalance of the planet. Impossible as a net energy increase for only 4.4% of the Earth's area. You are probably confusing energy flows with the *net imbalance* - ie. the amount of heat energy retained to cause warming above an equilibrium balance. About 240W/sq.m (38667E20 Joules/year)flows through the Earth system continuously, but only 0.9W/swq.m (145E20 Joules/year) is supposedly retained to warm it above the equilibrium. Suggest you have a good read of the above paper and get back to me on the Arctic ice melt contribution to global warming.
    0 0
  23. 114 : a downward trend for some period doesn't prove there is a positive feedback - as I said, any oscillating function as a temperature curve during a few days or across seasons will show periods of acceleration. 117# logicman : the concept of random positive feedback is surely interesting, but I have never heard of any physical phenomenon producing that - do you have a reference to explain the physics ? and how it would manifest ?
    0 0
  24. #118 - Berényi Péter Thank you for posting that image. It shows significant changes in ice thickness distribution between 1999 and 2011. As you assert, the decline in a mere 12 years is indeed scary. I have modified the image to show some areas of interest. Ice thickness comparisons. A - 1999 - significant ice extent over 3.75m. 2011 - no ice over 2.75m. B - 1999 - significant ice extent over 2.75m. 2011 - no significant ice extent over 2.5m. C - 1999 - no ice over 2m. 2011 - no ice.
    0 0
  25. #123 Gilles. "the concept of random positive feedback is surely interesting, but I have never heard of any physical phenomenon producing that" Nor have I, in physics. Skinner boxes are another matter entirely. A feedback mechanism is constantly available for application. The fact that a mechanism is available does not imply that it must therefore be constantly applied. In the case of a coin having a bias, the bias isn't random. The bias is constant but its influence on specific coin throws is not constantly dominant. Chaotic fluctuations in aerodynamic drag may, from time to time, overwhelm the influence of the coin's bias. Similarly, the multiple feedbacks which hasten the onset of an ice-free Arctic are constantly available but not constantly dominant.
    0 0
  26. Ken and Tom and others, Could we please move the energy budget discussion to the more appropriate Flanner thread? Thanks.
    0 0
    Moderator Response: (DB) Agreed.
  27. Gilles#123: "any oscillating function as a temperature curve during a few days or across seasons will show periods of acceleration." Two problems with your fact-free analysis: a. 'during a few days or across seasons' does not a long term trend make. b. The long term trend doesn't oscillate, as you can see if you bothered to look at actual data. -- surface air temperature, 65-85N latitude, April to September seasonal average If you're curious, that's an increase of more than 0.4C per decade since 1960.
    0 0
  28. Ken Lambert @122, following the suggestion of Albatross, I have responded on the Flanner thread. One part of that response is relevant, I believe, to this topic:
    "Based on the calculation of the amount of energy needed to increase melting of sea ice, that means the energy gain over the summer months as a result of melting of the sea ice is enough to melt 2.2*10^6 km^2 of sea ice, or 30 times the average additional annual melt at September over the last 30 years. This strongly suggests both that large portions of the additional energy being absorbed is being taken up not by melting ice, but by some other means, probably by heating the deep ocean due to the thermo-haline conveyor. It also strongly suggests that absent this feed back, arctic sea ice would currently be increasing, and at a significant rate. Note that these consequences follow not just from my back of the envelope calculations, but from Flanner's detailed anlysis. In fact, taking Flanner's analysis, which we should, and even assuming only 1/6th of the total additional forcing comes from absorption due to additional exposed ocean surface, then 0.06 w/m^2 globally averaged is due to that effect. That amounts to 9.65*10^20 Joules annually, or 10 times the amount of energy needed to explain the continuing reduction in arctic sea ice, as calculated by Trenberth."
    In other words, tracking the energy strongly suggests a very strong positive feedback on ice melt is operating in the arctic.
    0 0
  29. Muoncounter : there is no notion of "long" or "short" in physics - it's only a question of characteristic time scale. There is a trend when the variation is computed over an interval shorter than half a period. Just looking at data such as in CT or PIOMAS data doesn't say anything about a possible noise at this relevant time period (30 yrs), so you can't say anything on its significance, unless you have a proper measurement of this noise in a former, independent, and much longer, time interval. Again, basic physics.
    0 0
    Moderator Response: [DB] More hand-waving by you, I see. If 30 years isn't enough, try this:Basic physics: More warming = greater ice loss. Based on the information at hand:
  30. logicman : I can't see any scientific validation of what you're saying - sorry, that just hand waving for me. Do you have a mathematical model of what you're describing ?
    0 0
    Moderator Response: [Dikran Marsupial] Logicman gave a mathematical model (the biased coin), his point was clear enough for me from a brief statement of the model, if it isn't clear for you, perhaps the problem is at your end?
  31. DB : this is still very far from a noise measurements over a much longer period than that you're using for your signal. Again, such variations can be found in a very large variety of situations, and they don't imply any possibility of extrapolation. And again, that's VERY basic physics.
    0 0
    Moderator Response: [Dikran Marsupial] There is no statistical justification for requesting a "longer period than're using for your signal", it is perfectly reasonable to estimate the properties of the noise from the same sample as the signal. That is VERY basic statistics (it is done implicitly every time a regression analysis is performed). Also data in isolation never imply the possibility of extrapolation (that also is VERY basic statistics) - the assumption of an underlying physical mechanism is justification of extrapolation, but all extrapolation can only be performed with caveats relating to such assumptions.
  32. Giles wrote "a downward trend for some period doesn't prove there is a positive feedback". I didn't say that it was, I said that it is evidence of positive feedback (I also said that it was the accelleration of the decline rather than the trend itself). This sort of misrepresentation of points is a characteristic of trolls and denialists, not scientists. I was also clearly not talking about "an oscillating function as a temperature curve during a few days or across seasons will show periods of acceleration" but of sea ice extent over tha past few decades, which is long enough to average over the principal sources of internal variability.
    0 0
  33. Gilles, you keep saying that various things don't "prove" a positive feedback. Exactly what sort of feedback effect do you think melting ice is going to have? 1: When ice melts the water or land beneath it is exposed. 2: Water and land (on average) are both darker than ice. 3: Darker objects absorb more solar radiation. 4: Absorbed solar radiation causes objects to heat. 5: Heat melts ice. 6: See step 1 Ergo, it would seem to me that a rudimentary understanding of physics and basic logic "prove" a positive feedback in this case. So what the heck is your point here? Are you claiming that melting ice doesn't cause a positive feedback effect? If so, then we would be forced to conclude that the great decline in Arctic ice has >not< been partially driven by ice-albedo feedback (in violation of basic physics) and therefor the effects of global warming must be significantly more pronounced than thought. In a couple of places you have seemed to argue that there isn't a positive feedback because the decrease in sea ice has not been constant / "self-sustained" / accelerating exponentially... but that's a non sequitor. Any positive feedback equal to less than 100% of the original forcing would obviously not display any of those traits... yet still be a positive feedback nonetheless.
    0 0
  34. #130 - Gilles "logicman : I can't see any scientific validation of what you're saying - sorry, that just hand waving for me. Do you have a mathematical model of what you're describing ? " What I was describing was a simple observation in fluid dynamics: it is impossible to model exactly the effect of air turbulence on an object moving through a fluid. Although we can model the altitude of a plane in level flight in broad terms, we can't predict minor variations in altitude from moment to moment. In general, for systems involving fluid motion - such as air currents, ocean currents, ice advection and ice melt - we cannot model momentary fluctuations, only trends. The day that I have a mathematical model to describe momentary random variations in fluid flows is the day you will read news reports about my nomination for the Abel Prize - but don't hold your breath. If you wish to approach fluid dynamics from a mathematics-oriented direction, may I recommend: Batchelor, George K. (1973). An introduction to fluid dynamics. Cambridge: Cambridge University Press. ISBN 0-521-09817-3. It is written to address the sort of person who best understands physics in terms of mathematical models. "Students, and teachers too, are apt to derive their ideas of the content of a subject from the topics treated in the textbooks they can lay their hands on, and it is undesirable that so many of the books on fluid dynamics for applied mathematicians should be about problems which are mathematically solvable but not necessarily related to what happens in real fluids." - G.K. Batchelor
    0 0
  35. DB 130 and logicman 134 : I don't really see which kind of system would exhibit a feedback which would " hasten the onset of an ice-free Arctic [and be] constantly available but not constantly dominant." is it that you should just have a look at a randomly fluctuating curve and if you see a downward trend, say "oh there is a feedback", and when you don't see it, say "oh it's random"? or is it something else ? how can you see evidence for "feedbacks" and not just random fluctuations with various amplitudes ? #131 : "There is no statistical justification for requesting a "longer period than're using for your signal", it is perfectly reasonable to estimate the properties of the noise from the same sample as the signal." I'm sorry to deeply disagree with you : the issue is to know whether a variation seen over a period T is really due to an external forcing, or if it can be a part of a larger timescale fluctuation (in this case, a possible oscillation with a period T >> 30 years) . I think that you assume implicitly that such an oscillation is absent : I say that you can not say it just by inspecting the curve, without any comparison period. If you want an explicit example : just select the part of the CT 'tale of the tape' between Feb 2009 and Nov 2009 et compare it to the 30-years curve - it looks exactly similar - so when you looking only at these two curves, how can you know if it is a long term trend , or part of a natural fluctuation ? in the case of CT curve, you can know it because you have much longer data and you can see that this period has nothing exceptional. And in the case of the 30 years curve ...????
    0 0
  36. 133 CBD : I have no indication that the overall increase of incoming solar radiation during a few weeks in summer has a significative impact on the melting of the following year, since everything has frozen again during months, and a lot of heat transfers between oceans and atmosphere has occurred. Can you give me a convincing argument that there must be such a memory ?
    0 0
  37. Gilles#136: "I have no indication that ... " The importance of whether you have an indication or not is exactly zero. There is such evidence; you can find it if you look. Rather than 'give me a convincing argument,' perhaps you could do some homework; opinions sound so much better when they are backed by a fact or two.
    0 0
  38. Gilles#135: I don't blame you for your confusion. The problem is, often, people post up graphs and point and say "there, you see?". This deludes many people, yes you are not alone, into beleiving that this is anything like how science is done. In reality the analysis of things like acceleration of ice cover etc. require statistical techniques to be applied to data. Often the outcomes of such analysis are displayed on graphs... but this is only for, lets say, a sanity check and do not actually represent the analysis being done - and that is possibly misleading. If you look at, for example, this paper (only for illustration of method, you understand). You will see they fit a regression to the things like the annual mass balance (a 'speed', if you will) to get a rate of rate of change ('acceleration', so to speak). You can spot this because one is Gt/Year and the other Gt/Year^2. Study of such works will also you to understand things like the importance of time scale ... hint, look at the confidence limits.
    0 0
  39. Gilles #136: Setting aside for the moment that your 'reply' here addresses none of the points I raised in the message it is supposedly responding to and seems to go off on a completely unrelated tangent... Memory? No, there is no 'memory'. Just the obvious implications of an increasing greenhouse gas forcing and the ice-albedo feedback effect. That is, more heat from greenhouse warming means more ice melted in Summer and less formed in Winter. Less ice at the start of the melt season means less energy needed to melt ice and thus more open water to absorb more energy... and melt more ice. Can weather events overwhelm (or exacerbate) these factors on a short (i.e. annual) time scale? Sure, but that doesn't change the (painfully obvious) fact that on an ongoing basis more heat = less ice.
    0 0
  40. Giles #135 wrote "I don't really see which kind of system would exhibit a feedback which would " hasten the onset of an ice-free Arctic [and be] constantly available but not constantly dominant." The answer is very simple Giles, it simply means that the albedo feedback is not as strong as the short term influences that cause the variability. CO2 radiative forcing is another example, it biases temperature trends upward as CO2 increases, but it doesn't mean that temperatures rise monotonically as CO2 rises. If I try an push a hippopotamus into a cage, I am biasing his movement in that direction, but I am not the dominant influence, even though I am constantly available. Secondly, I happen to be a statistician, so I understand why it is perfectly O.K. to jointly infer the noise as well as the signal. However asking for data that you know doesn't exist in order to be satisfied is just the act of a troll or a denialist, it is not the behaviour of a scientist. Any scientific argument based on a set of observations obviously comes with the implicit caveat that it is based only on those observations and there is always a possibility that they don't show the whole picture. Scientists know that and generally don't feel the need to block the discussion with such pedantry. Do you have a particular mechanism that might cause the ice loss, or do you just mean some nebulous "natural cycles"? If it is the latter, then why would I be considered odd if I decided not to accept Einsteins theories of relativity because all of the observations that support it were gathered over a short period of time and if we look further back there may be data that would disprove it? There is always some epistemological doubt in science, we all know about it and take it as read.
    0 0
  41. Folks, as difficult as it is please DNFTT.
    0 0
  42. so , I try again, as I'm a scientist who really tries to settle scientific disputes. Take for instance the JAXA curves of the last ten years Note how all curves intersect in a somewhat messy way around 15th of May. My question is : when two curves intersect, do you think that there is a still significative difference between the physical state (heat content etc..) of the Arctic ocean ? if yes , where ? if no, what kind of "feedback" can be expected from the previous years since the system has been reset to approximately the same state ?
    0 0
    Moderator Response: [Dikran Marsupial] The system has not been "reset to approximately the same state" because the extent, expressed as a single number, doesn't tell you about the spatial distribution of ice, its age or its thickness, all of which will have an effect on future development.
  43. Gilles#142: "I'm a scientist who really tries to settle scientific disputes." Like most else that you've said, you've shown no evidence of that. "Note how all curves intersect in a somewhat messy way around 15th of May." What possible significance can this isolated factoid have? In the process of going from max extent to min extent, all curves go through a midpoint. What is significant is the decrease in min extent over a period of a very few years. "what kind of "feedback" can be expected from the previous years" You continue to pose this nonsensical question - as if you did not understand what is meant by 'feedback.'
    0 0
  44. Gilles: "Note how all curves intersect in a somewhat messy way around 15th of May." As stated, this is false. The curves do not all intersect. I suppose you mean that the spread between the highest and lowest values on the graph is smallest at that point. "when two curves intersect, do you think that there is a still significative difference between the physical state (heat content etc..) of the Arctic ocean ?" Given that these curves show sea ice area the answer to that question is obviously, yes... there are significant differences. You can have the same ice area at the same time of year, but very different ice volumes, ice distributions, ocean temperatures, currents, weather patterns, et cetera. "if no, what kind of "feedback" can be expected from the previous years since the system has been reset to approximately the same state ?" Again, this statement is simply false. The system has not "been reset to approximately the same state". Look at the ice volume anomaly graph in the original article. Volume has declined significantly in the 2002 - 2011 period corresponding to your JAXA graph. The ice area being approximately the same ~May 15 while the ice volume is lower means that the ice has gotten thinner. Thinner ice requires less energy to melt.
    0 0
  45. Gilles - I don't usually respond to your posts; lots of other folks have been doing an admirable job there. This one, however, is so completely outrageous. Even if the ice extent trajectories intersected (and they don't), your statement "when two curves intersect, do you think that there is a still significative difference between the physical state (heat content etc..) of the Arctic ocean ?" would still be complete and utter nonsense. The graph shows ice extent, not heat content, melt rates, snow deposition, ice volume, Arctic currents, etc. The rates and additional factors determine the trajectory (the whole data, in other words), you cannot predict it with a single trajectory value. And peak minimum and maximum extents depend on all of that. If you state that "as I'm a scientist who really tries to settle scientific disputes", and then promulgate this kind of nonsense, I will have to say that I and all other scientists are really quite insulted by this. You should know better!
    0 0
  46. And with Gilles' most recent bloviation, we should heed the Rede of the Ancient Mariner and DNFTT. For tröll he hath petarded himself. The Yooper
    0 0
  47. 142, Gilles, You are making a classic mistake, one that typically afflicts many skeptics, so let me try to help you through it. As you are a scientist, I'm sure that it will help you further your career, as well as to better understand climate science and so to begin to adopt a responsible role concerning the issue. I'd really hate for you to look back, twenty years from now, with great regret and remorse on your activities and communications during this period... which are helping to stall responsible action on the most important issue facing the next three generations (or more, depending on how badly this generation bungles the situation). But I'm digressing, and I said that I'd help you. You cannot make inferences and understand the real world merely by looking at numbers and trends and statistics. You must create a more concrete physical model for things, and then use the observations and statistics to help prove or at least provide confidence in such a hypothesis. Without a physical understanding and reality behind everything, it's just playing games with numbers. The scientific method does not work that way, by trying to back into the truth by finding inexplicable correlations between numbers and then just assuming there's some sort of reason for the correlation. You start with a hypothesis, then use the observations to refute or improve confidence in the hypothesis. Now I know you're saying to yourself that you know all of this, and you probably do, but your behavior on this thread demonstrates that you're not actually doing it. You seem to be very easily confused by such simple concepts as how a positive feedback would operate, or why noise in the system would obscure any "obvious" signal, while such a signal would still be clearly present, and in fitting with the facts (as is, in fact, the case). Examples from this thread of you're being too focused on numbers without a serious grounding in physical mechanisms, or an inability to grasp where really are pretty straight forward physical system interactions:
    ...any oscillating function as a temperature curve during a few days or across seasons will show periods of acceleration...
    ...the concept of random positive feedback is surely interesting, but I have never heard of any physical phenomenon producing that...
    I can't see any scientific validation of what you're saying,,,
    ...very far from a noise measurements over a much longer period...
    ...they don't imply any possibility of extrapolation...
    I don't really see which kind of system would exhibit a feedback which would...
    ...just have a look at a randomly fluctuating curve...
    I say that you can not say it just by inspecting the curve, without any comparison period...
    ...when you looking only at these two curves, how can you know if it is a long term trend , or part of a natural fluctuation ?
    ...such a memory...
    But take heart. There are a fair number of intelligent and educated people who actually understand the situation who are here trying to help you through this. If you stick with it, keep an open mind, and keep trying, I'm sure you'll understand it eventually. The worst case is that you won't understand it until too late, and you'll look back on all of this with great regret.
    0 0
  48. KR @145, "I will have to say that I and all other scientists are really quite insulted by this." Seconded KR.
    0 0
  49. Gilles wrote : "Note how all curves intersect in a somewhat messy way around 15th of May." I would suggest that they are somewhat messy and intersect-y around mid May to mid June, i.e. half-way between maximum and minimum. Spooky, eh ? What can it mean ? Perhaps, with your self-confirmed scientific training, you can reveal what it is you might have discovered there ? Bound to be something important, that no-one else has noticed before.
    0 0
  50. Gilles: A graph of this type is just one way of recording the variations in ice extent, area or volume over a period of time. The advantage of the overlay method is that it helps to compare year with year as to quantity of ice and rate of melt/growth at specific times. Here, I have taken the graph of 2010 ice behavior and used it as a projection of 2011 behavior. If, and only if, ice behavior this year is exactly the same as last year, then the projection shows what we may expect to see in the coming months. In fact, 2010 was anomalous in that ice losses stalled somewhat about June. Had 2010 been a more 'normal' year, ice losses would have been greater. I therefore regard this projection as somewhat conservative.
    0 0

Prev  1  2  3  4  5  6  Next

You need to be logged in to post a comment. Login via the left margin or if you're new, register here.


The Consensus Project Website

THE ESCALATOR

(free to republish)


© Copyright 2024 John Cook
Home | Translations | About Us | Privacy | Contact Us