Climate Science Glossary

Term Lookup

Enter a term in the search box to find its definition.

Settings

Use the controls in the far right panel to increase or decrease the number of terms automatically displayed (or to completely turn that feature off).

Term Lookup

Settings


All IPCC definitions taken from Climate Change 2007: The Physical Science Basis. Working Group I Contribution to the Fourth Assessment Report of the Intergovernmental Panel on Climate Change, Annex I, Glossary, pp. 941-954. Cambridge University Press.

Home Arguments Software Resources Comments The Consensus Project Translations About Support

Bluesky Facebook LinkedIn Mastodon MeWe

Twitter YouTube RSS Posts RSS Comments Email Subscribe


Climate's changed before
It's the sun
It's not bad
There is no consensus
It's cooling
Models are unreliable
Temp record is unreliable
Animals and plants can adapt
It hasn't warmed since 1998
Antarctica is gaining ice
View All Arguments...


Username
Password
New? Register here
Forgot your password?

Latest Posts

Archives

Arctic Ice March 2011

Posted on 30 March 2011 by logicman

This is a repost of my Science 2.0 article Arctic_Ice_March_2011_Update_#2, with an introduction, updates and minor edits.

Introduction

The main mass of Arctic sea ice has previously consisted mostly of thick multi-year ice.  In the winter of 2006 - 2007 there was a crossover: first year ice became the majority component.

The Arctic sea ice cap is getting younger.  A population of older ice is being replaced as the older ice is lost and new ice does not linger long enough to get old.  The former dominance of thick multi-year ice together with a gyratory motion caused new ice to enter the main pack and be trapped there for many years. The Transpolar Drift and Beaufort Gyre formerly brought new ice into the main pack and exported old ice - mainly on the Atlantic side through Fram Strait.  The export and import were formerly in broad balance.  They are not balanced now.

Younger and thinner ice now allows a more rapid transit of floes through the pack.  The age of the oldest ice is the length of time during which it was prevented from advecting south by being trapped in the main pack.

It appears that as the ice gets thinner and more mobile, that very mobility is a positive feedback to ice loss.

Arctic Ice March 2011

The melt season of 2010 ended with a low extent and with little ice older than two years. There are strong indications that the winter of 2010 - 2011 did not compact and thicken the sea ice as much as would normally be expected.

Arctic sea ice extent averaged over December 2010 was 12.00 million square kilometers (4.63 million square miles). This is the lowest December ice extent recorded in satellite observations from 1979 to 2010, 270,000 square kilometers (104,000 square miles) below the previous record low of 12.27 million square kilometers (4.74 million square miles) set in 2006 and 1.35 million square kilometers (521,000 square miles) below the 1979 to 2000 average.

... unfrozen areas of the ocean continued to release heat to the atmosphere, and an unusual circulation pattern brought warm air into the Arctic from the south. Although the air temperatures were still below freezing on average, the additional ocean and atmospheric heat slowed ice growth.

http://nsidc.org/arcticseaicenews/2011/010511.html

It appears to me that the 2011 melt season began with weaker, thinner, less consolidated ice than at any time in recorded history.  Where the slabbing and compaction has been least, the newest ice between the older floes is likely to melt soon.

I suggest that by mid-April the sea ice will be in a similar condition to that of late August 2010.  In plain terms, the 2011 melt season will soon continue more or less where the 2010 melt season left off.

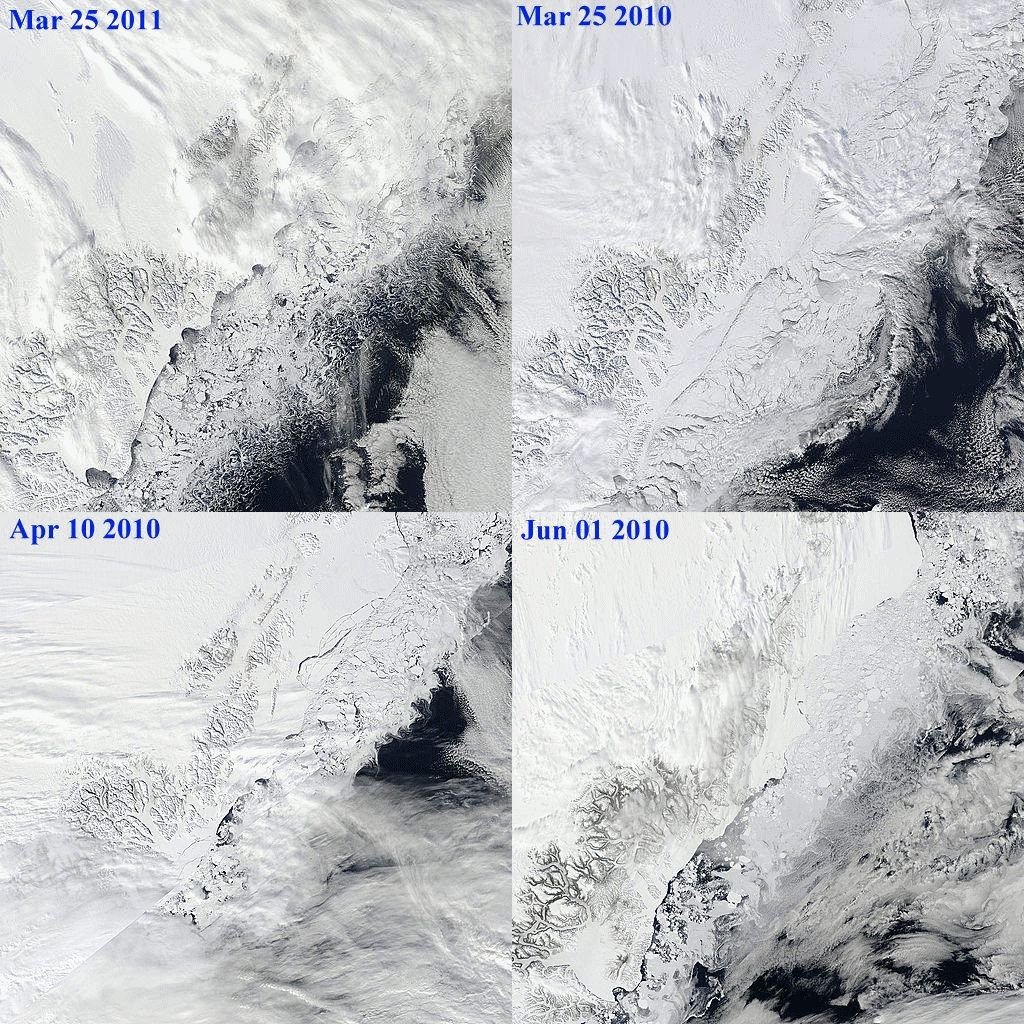
To illustrate that last point, this animation compares 25 March 2011 ice extent on Greenland's northeast coast with 25 March, 10 April, and 01 June 2010.
Scoresby animation
Ice extent comparisons - from MODIS Arctic mosaic images.


Melting and re-freezing

Many areas of the Arctic are melting, advecting and re-freezing.  This superimposes local variation noise on signals of ice extent.  I call this 'the Arctic ice jitters'.

Sea ice extent in February and March tends to be quite variable, because ice near the edge is thin and often quite dispersed. The thin ice is highly sensitive to weather, moving or melting quickly in response to changing winds and temperatures, and it often oscillates near the maximum extent for several days or weeks, as it has done this year.
Source: NSIDC report March 23, 2011

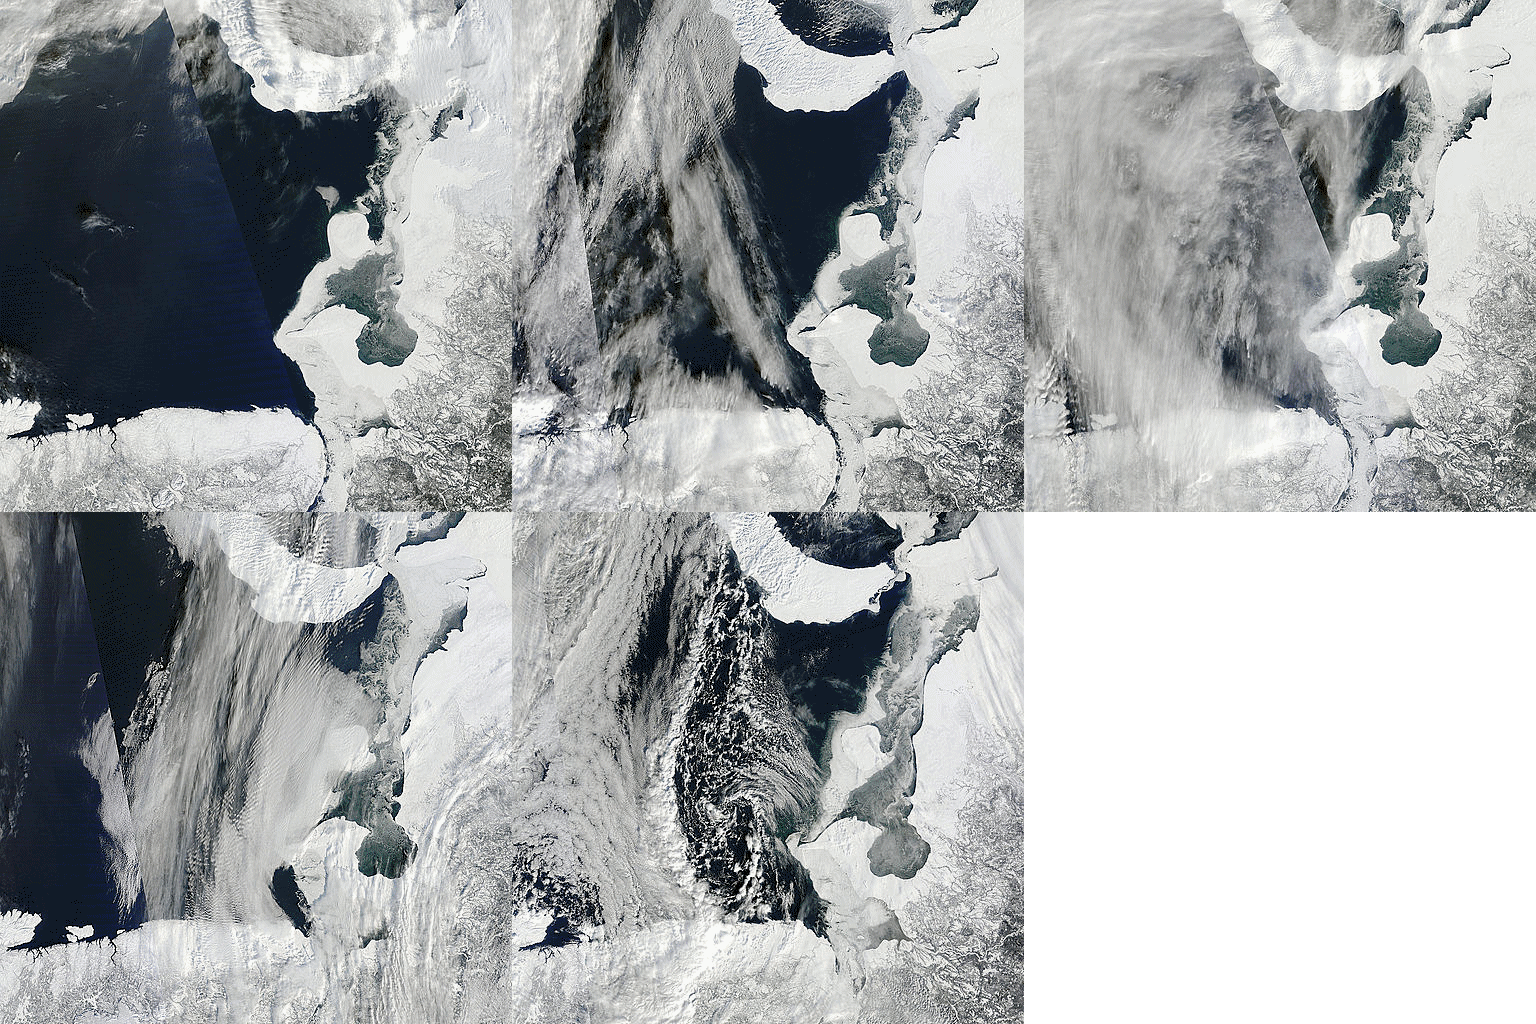
The following images show the ice jitter effect in an Arctic mosaic segment which includes Kara Strait.

Kara Strait ice jitter
Kara Strait - ice extent jitters

Note that this sea ice will appear in extent numbers but will have no impact whatsoever on the mass of ice in the main polar sea-ice cap.


The tale of the tape

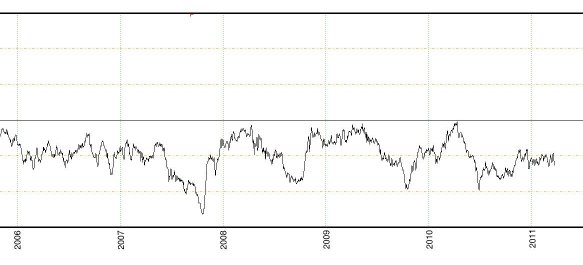
The unusual behaviour of Arctic ice this year is shown at a glance by the Cryosphere Today's 'tale of the tape':  the 2011 portion of the graph could not have been predicted from previous data.  The 2011 plot of anomalies is itself anomalous.
tape tail


The graph as a whole shows a clear negative anomaly trend since 1979.
tale of the tape
The latest update of the full sized 'tale of the tape' can be seen at http://arctic.atmos.uiuc.edu/cryosphere/

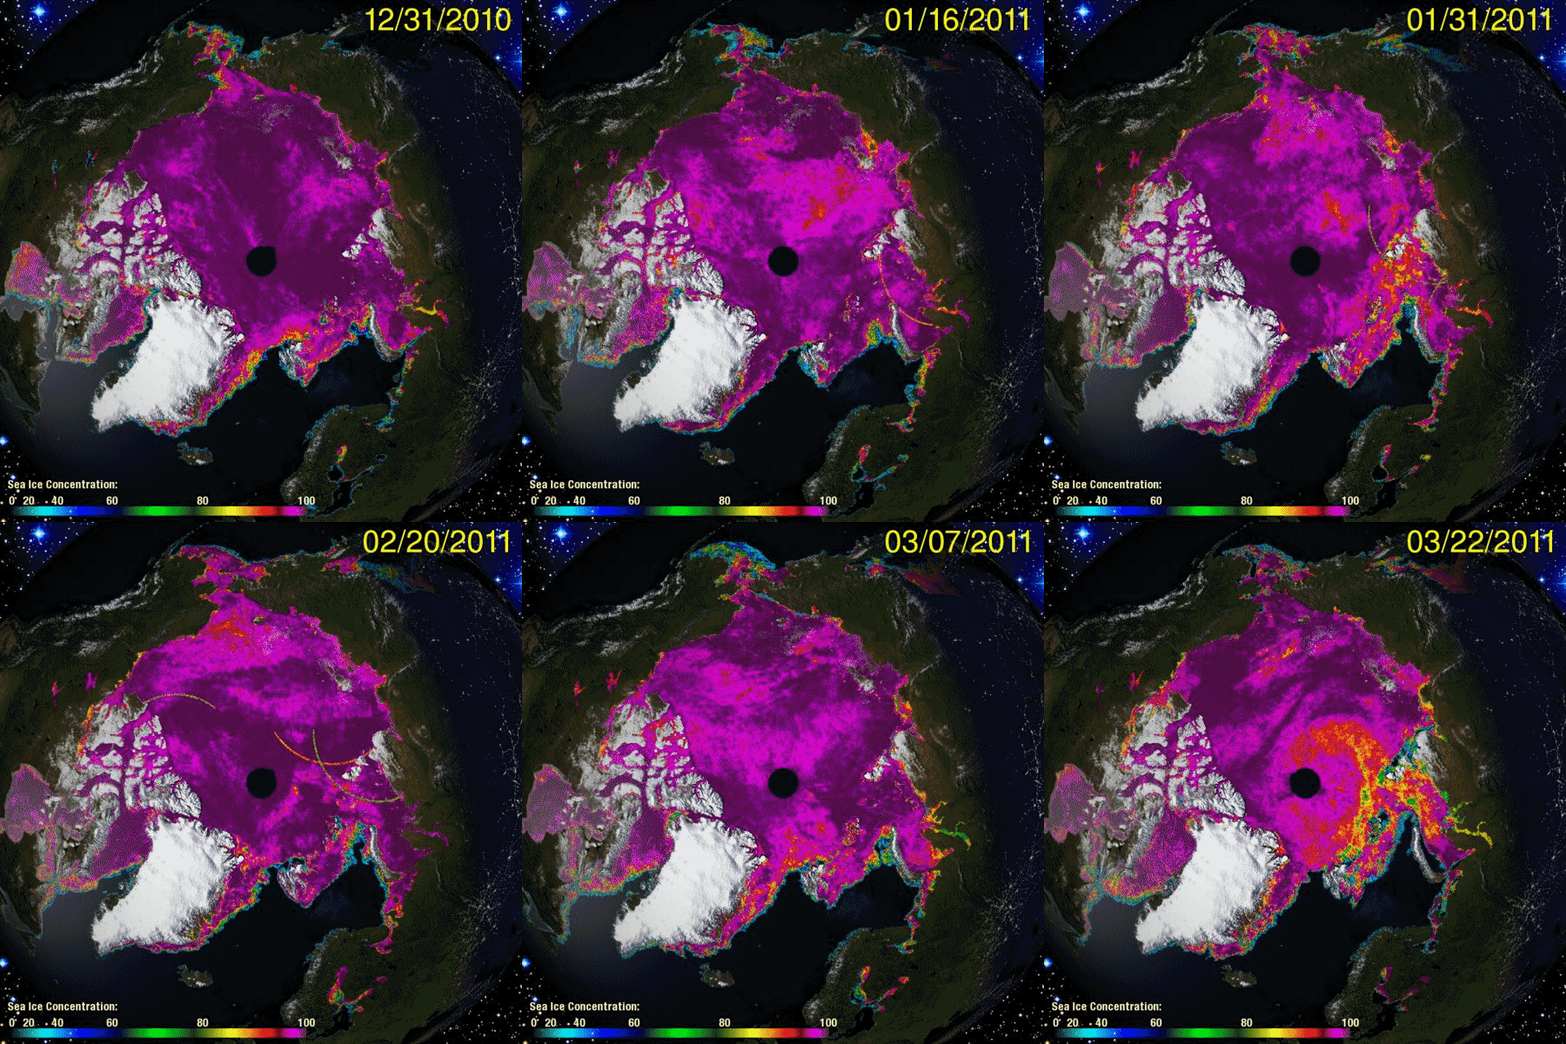
The animation below of the sea ice concentration chart from Cryosphere Today shows changes in ice distribution from 31 December 2010 to 22 March 2011 in 5 day steps.
cryosphere animation
Sea ice concentration Dec 31 2010 to Mar 22 2011

The chart of sea ice concentration should be read in conjunction with the PIPS ice displacement chart animation and the current ice thickness chart below.
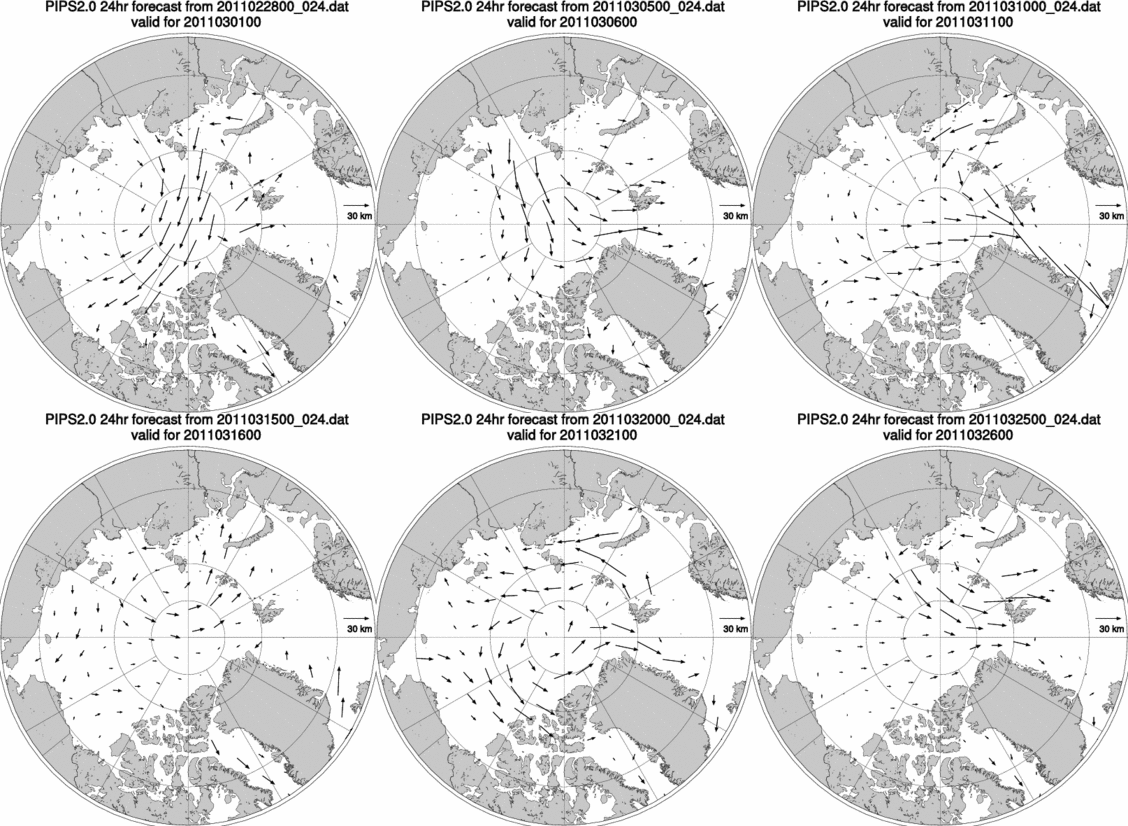
ice displacement animation
Ice displacement charts from March 01 to March 25 2011
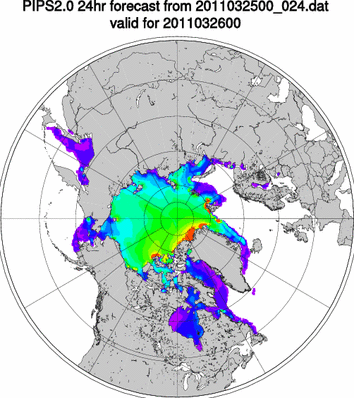

PIPS thickness
PIPS ice thickness forecast.

The red, yellow and green areas in the ice thickness chart are the last vestiges of sea ice thicker than 2.75 meters in the entire Arctic.  They consist of heavily fragmented ice much of which is being advected through the Fram Strait.  When the Nares Strait and NWP ice breaks up, that thick ice will be highly susceptible to advection through those passages.

The 3 to 5 thousand years old ice shelves which once extended north of Ellesmere island are now down to the last fragments.  If we discount those fragments there is little ice in the entire Arctic older than 5 years.  It bears constant repeating that the bulk of Arctic ice 2011 is 2 years old or less.

Nares Strait

Recent ice advection patterns; warm water advances into the Arctic from the Atlantic; ice distribution patterns: all of these things show that conditions continue to be advantageous for export of ice through Fram Strait.  Nares Strait is currently blocked by relatively weak ice.  As soon as the ice in Nares Strait breaks up, a continuation of current trends will be advantageous for the export of substantial volumes of the remaining older ice through that channel, supplementing the export through Fram Strait.

We are now (27 March 2011) within the time frame of my March 02, 2011 predition  for the breakup of the Nares Strait ice bridge.  Radar images show a melange of last year's floes and young ice.  This melange is so weak that a few cloudless days and / or a strong wind towards Baffin Bay will cause a rapid breakup of the ice bridge.  I expect to see ice being advected through Nares Strait about the 14th of April.
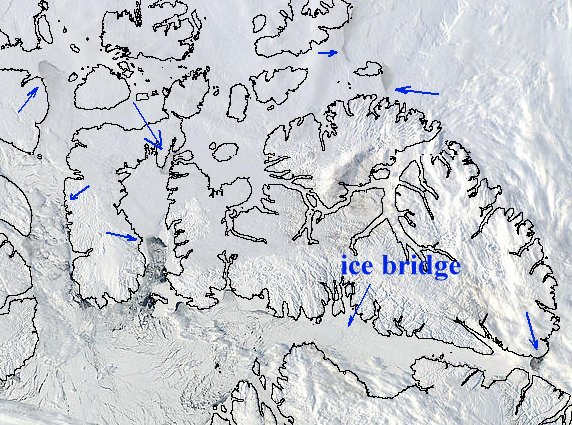
NWP Nares and Baffin Bay
NWP and Nares Strait

The arrows show 'places of interest' where ice is breaking up and being replaced by open water.  The ice bridge is still intact, but its breakup is imminent.
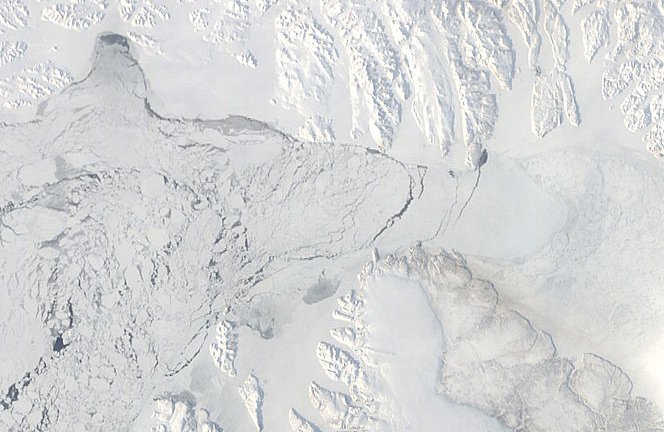
Nares ice bridge March 2011
Ice bridge at Kane Basin, Nares Strait March 26 2011


Ice volume

The decline in ice volume since 1979 is dramatically illustrated by this PIOMAS graph.
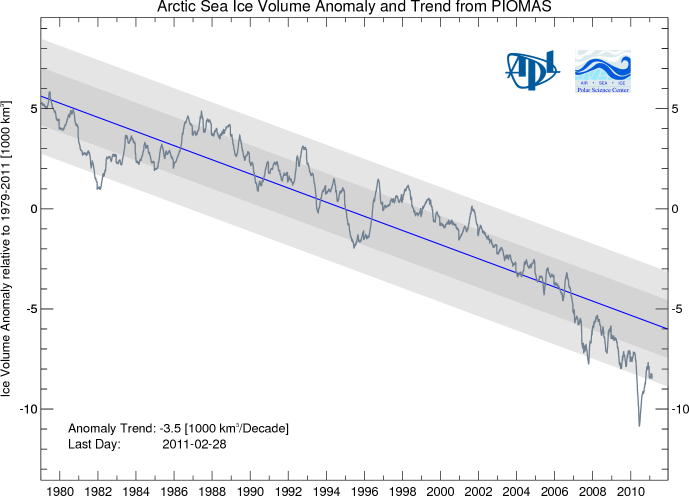
PIOMA ice volume
 
The importance of ice volume is that it reflects the ability of the Arctic sea ice cap to absorb heat without melting away entirely.  Thicker ice can survive summer melting longer than thinner ice.  Thicker ice has greater momentum by which massive floes slide over and under each other, slide over ice rubble, create massive compression ridges and generally make the ice more robust.  Thinner ice can melt away entirely, can fragment instead of slabbing.

An ice cap which is rejecting heat all winter can absorb the same amount of heat during summer without raising its temperature to the melting point.  Ice lost by ablation is readily replaced by the freezing of rain, snow and meltwater.  A robust ice cap, due to its thermal capacity, cannot melt away in summer.

The ice cap we see today is not robust.

Ice displacement patterns such as the one below will drive a great volume of ice out of the Arctic Ocean and into warmer waters.
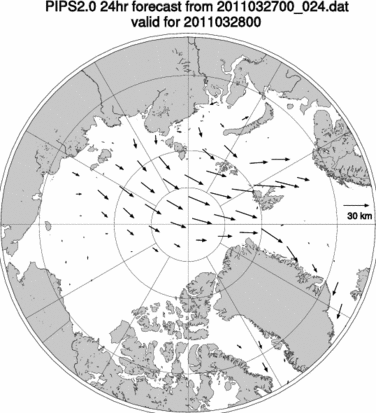
ice displacement

Summary

The melt season of 2011 is under way with less volume than former melt seasons.

Of that lesser volume, about 90% appears to be under 2.75 meters thick.

Much of the ice is less than 1 year old.

The Arctic's dynamic system seems primed to advect large quantities of ice out of the main ice cap area.

The Beaufort Gyre and Transpolar Drift have not yet appeared as stable patterns.  The instabilities in the ice drift patterns broadly favor ice export via Fram Strait.

Collapse of the Nares ice bridge is imminent.


Forecast

These forecasts represent what I expect to see based on a continuation of general trends.

Dates given should be taken as plus or minus 3 days.

The Nares ice bridge will be fragmented, and the ice in Kane Basin will be melting out by April 7th.

Ice from Lincoln Sea will be advecting through Nares Strait by April 14th.

The main North West Passage ice will show strong evidence of breakup and melt by April 30th.

By April 30th, ice extent graphs will show a strong downward trend similar to that of May - June 2010.

-------------------------------------------------
Sources:


http://nsidc.org/arcticseaicenews/2011/010511.html
Polar Science Center
http://arctic.atmos.uiuc.edu/cryosphere/
http://rapidfire.sci.gsfc.nasa.gov
http://www7320.nrlssc.navy.mil/pips2/


Further resources:

Arctic Sea Ice Blog
arctic sea ice graphs


Related articles:

Arctic Ice 2011 - Sail, Steam And Satellites
Arctic Ice March 2011
Arctic Ice March 2011 - Update #1
ice-in-baffin-bay
The ChatterBox Arctic Index

0 0

Printable Version  |  Link to this page

Comments

Prev  1  2  3  4  5  6  Next

Comments 201 to 250 out of 257:

  1. Nobody is "extrapolating" 30-yrs out. Model simulations in sophisticated AOGCMs that include feebacks and reproduce internal climate modes (such as AO and ENSO, they are not mere extrapolations as some keep insisting.
    0 0
  2. I can't believe no-one has called the contrarian/s on this before. The sophisticated ensemble of AOGCMs which include feedbacks and reproduce internal climate modes such as AO and ENSO, are not mere extrapolations of a trend. To suggest this is ludicrous and a strawan. Besides nobody I know of who works in this field extrapolating the current trend in Arctic sea ice out 30 years or so, so another strawman. With that said, and to stay on topic, it will be interesting to see how the AO behaves this melt season (after the wild swings this past winter) and how it affects the Arctic sea ice. I'm leaning towards the second lowest extent on record, and record low volume in September (for that month).
    0 0
  3. Albatross: there's no need to extrapolate 30 strawman years. We are in the end game. Very soon, the last raft of sea ice will vanish under the summer sun before our eyes. The deniers will then insist that it is a natural cycle because it grows back in winter. After the ice fails to grow back in winter the deniers will point out to those stupid scientists who don't know such things that its a natural cycle because there used to be crocodiles in the Arctic. If the Arctic this year merely repeats average behavior of the last decade we will see the 3rd lowest September extent. I see no reason for average ice loss, but rather a more rapid than average ice loss. A record below 4million km2 is highly likely.
    0 0
  4. Logicman @203, I agree, unfortunately some people keep insisting that "extrapolating" is all that is being done. Results from latest model runs presented at the EGU this week by Maslowski et al. suggest 2016 +/- 3 years for a mostly ice free Arctic ocean. [H/T to you for that info]. Wow, an extent below 4 million km^2...I hope that you are wrong. Which product is that for? PS: Have you seen that Hudson Strait already has large swaths of open water?
    0 0
  5. excuse me but "the results of a model" have never been a proof of anything, as far as I know. Do you have any clear validation of this model ? At least the record below 4 Mkm^2 is a prediction. Let's wait ...
    0 0
    Moderator Response: [Dikran Marsupial] Straw man: Nobody is saying that the results of a model are proof of something. Stop trolling.

    Models are used to tell us the consequences of a set of assumtions, nothing more, we all know that. Models are also used to generate falsifiable predictions, and are part of scientific method (Popper).

  6. 198: Albatross "That quote @197 was made 11 years ago. The AO has been reproduced in models for some time," Here is a more recent reference http://voices.washingtonpost.com/capitalweathergang/2011/02/dont_blame_the_arctic_oscillat.html "Scientists are trying to better understand the complicated processes that create these unusual, long-lasting flow geometries, otherwise known as AO phases. Some believe that the forcing comes from tropical weather phenomena, like El Nino or the Madden-Julian Oscillation. Matt Rogers' recently wrote about a mechanism proposed by researcher Judah Cohen linked to fall snow cover over Siberia. Andrew Freedman has written about possible connections to Arctic ice extent and global warming. Others believe the cause can be linked to the natural life cycle of really big storm systems, such as the blizzard that parts of the Northeast experienced the day after Christmas. Maybe it's all of them and while it is true that the AO index is a very useful statistical concept that gives a name to uncommon weather regimes, it does not explain how or why we get them." This is obviously not a well understood phenomenon. Again, claiming that "I see it in my computations" is very far from a real physical understanding - I'm surprised that you seem to think the opposite.
    0 0
    Moderator Response: [Dikran Marsupial] None of which contradicts the assertion that the AO is reproduced in model output, so the last paragraph is at best a distortion of Albratross' point of view. I'm glad Albatross has responded correctly to your trolling. I have been very tolerant of your disruptive behaviour on this thread, any more of this and your posts will be deleted.
  7. Again, more strawmen and distortions and mispresentations of others' understanding....not biting.
    0 0
    Moderator Response: [Dikran Marsupial] Quite right, however it is best if you just ignore it and leave it to the moderators.
  8. Dikran, You are right, my apologies. Will do as requested.
    0 0
    Moderator Response: [Dikran Marsupial] No problem; your restraint was commendable!
  9. Gilles, 206, Instead of wandering all over the place, please state clearly and concisely your position on the topic of this thread. Please do not immediately go on to support it with a tsunami of erudite arguments. All I'm interested in right now is figuring out what none of us can, which is what you actually believe. What is your position? In four sentences or less, with no distracting gamesmanship... what is it that you think? Consider it a challenge. Can you actually be concise, straightforward and clear for one, single post?
    0 0
    Moderator Response: [Dikran Marsupial] I believe Gilles has already done so here. His position appears to be essentially that there may be stuff we don't know about that is causing the ice to melt so we can't be sure that it is the warming that is doing it. The flaws in this line of reasoning have been pointed out (repeatedly), and further discussion is "off-topic" (as it would only be feeding the troll).
  10. it's rather difficult to have an open discussion with a gun laid at your face. Many of my posts have already been suppressed, and now you ask me questions that I am not allowed to answer. If this is your conception of scientific discussions, I understand that we can disagree....
    0 0
    Moderator Response: (DB) Only comments that are off-topic or in violation of the Comments Policy or are complaining about having to comply with said Policy force the moderators to intervene. Participating in this forum is a privilege, not a right. A privilege that the vast majority here respect and enjoy.
  11. Obviously we have different conceptions of "ad hominem comment", then. concerning the precise topic of the opening post, as far as I can see, it is kind of weather forecast of the next month for arctic ice sea. I do not have definite opinion about weather forecast - and I'm not at all a specialist of ice sea. I just made very general comments about the use of a curve showing a trend, the significance to be given to numerical simulations, etc... that could apply to any field. So concerning arctic sea ice, my opinion is : well, wait and see. As the term is rather short, we'll have soon an opportunity to check the forecasts. I think the main interest of the present comments should be following them up. First we're already on April 9th, so what about the first one ? "The Nares ice bridge will be fragmented, and the ice in Kane Basin will be melting out by April 7th."?
    0 0
    Moderator Response: [Dikran Marsupial] Nobody has said anything about "ad-hominem comments". The comments policy is here, I suggest you read it carefully, "ad-hominem attacks" is only one item on the list, a more relevant item is "off-topic comments". It is unfair to repeatedly disrupt the discussion of the science with incorrect and irrelevant discussion of epistemological issues that have already been answered. If you want to discuss the science relevant to the topic of the article, the moderators would sincerely welcome that.
  12. Gilles et al I think Gilles needs to tighten up his arguments - a bit of advice from one who is on his side of the debate. Anyone who wants some really relevant numbers on this argument - head over to the Flanner thread here: http://www.skepticalscience.com/Flanner2011.html#46658 where Sphaerica and Tom Curtis and me are in play. It is interesting to note that Moderator DM is very active in instructing Gilles. Having the power to delete one's opponents and not one's friends is wide open to abuse. I suggest Moderators need moderating themselves if this site is to be taken seriously as a contributor to the AGW debate. I have corrected some of the gross errors in other's numbers on this thread - without challenge from anyone including the Moderators who do know something about these numbers. If Moderators are to be pro-active and respected - they should suggest corrections to both pro-AGW arguments and anti-AGW arguments which are obviously factually wrong. That will discourage the tyre kickers, and trollers (a la Gilles), and lead to a higher standard of debate.
    0 0
    Moderator Response: [muoncounter] Do not worry about this site being taken seriously; that is not at issue. Further, demonstrate respect for the Comments Policy and the Moderators and perhaps you, too can contribute to a higher standard of debate.
  13. Gilles#211: "I'm not at all a specialist of ice sea. ... my opinion is : well, wait and see." Wouldn't it be preferable to consult specialists for their opinions? "First we're already on April 9th, so what about the first one ? " Breakup is underway. Score: Prediction 1, Wait and see attitude 0.
    0 0
  14. #211 - Gilles. My prediction was for April 07 plus or minus 3 days. The ice bridge main plug has been thinning and cracking. It is under tremendous pressure and will soon finish breaking up. After April 10, if the ice bridge has not broken up then I will accept that my forecast was out by however many days the ice bridge survives after April 10. If the ice bridge completely fails to break up this year then my score for that specific prediction will be zero out of 100 and I will buy you at least one beer. :)
    0 0
  15. logicman@214 I'm sure Popper would approve! ;o)
    0 0
  16. obviously Muoncounter hasn't carefully read the prediction. ;). Now Popper would say that a theory should be disproved by the fact that its prediction are not verified. But what if logicman's prediction isn't ? would you deduce that after all the artic ice melting is not due to anthropogenic factors? most probably, not. This means that logicman's predictions are *not* a solid test of the theory. That's just , say, like weather forecast, some probabilistic estimate, knowing the general physics of the ice. But of course they could have been made whatever the cause of the melting would be. Even if it were a natural cycle, observing the thickness of the ice, the cracks in the pack, and so on, could have led to the same kind of predictions (I'm not saying it is, I try to quantify the discriminating value of the prediction). So is there another feature that could unambiguously really proves, not that ice is melting more these last years (we all agree on that), but that it melts * mainly because of anthropogenic factors* ? is there a specific characteristic feature, that could prove it without discussion ?
    0 0
    Moderator Response: [Dikran Marsupial] Logicmans prediction was not a test of a specific theory, just a test of his ability to predict the course of the Arctic ice melt. Popper would still approve of that, I'm sure. However, your last sentence demonstrates that you haven't understood Popper at all, you can't prove any theory regarding the cause of the melting, only disprove.
  17. sorry DM, I think I understand Popper's paradigm as well as yourself. That's why I remarked that the kind of predictions made by logicman are not able to disprove the theory - so they're in his sense "weak" predictions. Although it's true we cannot prove a theory, the degree of faith that we can have in it is dependent on the number of unlikely predictions that it has made successfully (example : discovery of the massive bosons has given much confidence in the electroweak theory) . By unlikely, I mean that saying "the ice is thin, it will probably melt a lot this month" is much less unlikely that "the ice will be thin in ten years and will probably melt on month earlier".
    0 0
    Moderator Response: [Dikran Marsupial] Sorry I'm not biting, but as I said, discussion of empirical doubt is off-topic. My comment to logicman was a good-natured commendation of his good scientific attitude, it was not an invitation to return to an off-topic discussion. No more.
  18. so, any news from Nares ice bridge and Kane basin ? I presume that if it has not yet broken, the second prediction "Ice from Lincoln Sea will be advecting through Nares Strait by April 14th." is also less likely to happen ? that's unfortunate, because we would already be at a random chance of success (2 /4 ). Hope for logicman it won't be worse ...
    0 0
    Moderator Response: [Dikran Marsupial] Google provedes this
  19. Gilles#218: "any news from Nares " Obviously Gilles missed the link here, with photos dated 2 April.
    0 0
  20. DM your link states that "He said there could be a beneficial outcome if the calving drifts to block the Nares Strait and effectively prevents the loss of more ice from the Lincoln Sea.", so If I understand well, the drifting ice could block the Nares strait ? Muoncounter , the bet wasn't that it was "underway", it was that it would be broken on April 7th+/-10. As far as I can judge, it's an illustration of the danger of "extrapolating trends" without taking into account natural variability.
    0 0
    Moderator Response: [Dikran Marsupial] Yes, that is the way I read it.
  21. Neven's Arctic Sea Ice Blog highlights PIOMAS' predictions for the current 2011 melt season:

    PIOMAS 2011http://neven1.typepad.com/.a/6a0133f03a1e37970b014e876618e4970d-pi

    Note that PIOMAS bases its predictions on average conditions.

    The Yooper

    0 0
  22. That was a peek into the future; now for a look back (that pesky albedo flip taking shape, I bet):

    http://svs.gsfc.nasa.gov/vis/a000000/a003600/a003679/autumnTrend_28yr_IPOD.m4v

    The Yooper

    0 0
  23. 222, DB, Okay, that was scary. Please don't do that just before I go to bed.
    0 0
  24. ( -Snip- )
    0 0
    Moderator Response: [DB] Portions of comment solely complaining about moderation snipped.
  25. so any news from the ice of Lincoln sea?
    0 0
  26. As an aside, one of the findings from this year's Catlin Arctic Survey is that the holes they've been drilling have been through 1.6-meter-thick ice. A typical Arctic melt season will witness about 1.5 meters thickness sea ice melt; more if predominantly new ice (first-year ice - H/t to Artful Dodger). The Yooper
    0 0
  27. Yooper#226: Well, that leaves an entire 10 cm of ice through the summer. No problemo!
    0 0
  28. I hear the Catlin squad has dibs on that to keep their drinks cold (the CNN guys brought extra cups and tiny drink umbrellas)...
    0 0
  29. Then it's true: Arctic ice melt is caused by all those TV lights! Cue James Earl Jones: "This is CNN ... the Carbon News Network. We're the C in CO2!"
    0 0
  30. Trane or GE really missed out on sponsoring the mission. Think of the ad campaigns they could've used: "GE, our air conditioners will outlast the Earth's..." 20 more to page 6...
    0 0
  31. after these interesting, on topic,s thoughts, do you have news from Lincoln sea ? where is it to be found online BTW ?
    0 0
  32. nobody interested in the Nares strait and Lincoln sea anymore? looking for another more interesting "place of the month" ?
    0 0
    Moderator Response: [Dikran Marsupial] Whatever happened to "wait and see". When there is news, if it is not posted here by others, there is no reason why you shouldn't post it yourself. If there is no news available, it is hardly surprising there is no discussion. Just for the record, I am interested, but have no news.
  33. Thanks again for the continued comments. I was wrong. (How many times have you heard a denier say that?) My ice bridge breakup forecast was wrong. Ah well, we learn from our mistakes - hopefully. I hope to publish a new article tomorrow on my blog, giving details of why the ice bridge isn't breaking up as fast as I had expected. Naturally, I shall need to revise my other predictions. I am sorry to be so slow with this. Firstly, I had to investigate to see what factors I had missed. Secondly, I have other articles in my worklist. Thirdly, little things keep getting in the way of my writing: things like life, illness, etc. :)
    0 0
  34. suggestion , logicman : you weren't wrong because you missed something. You were wrong because your method is wrong - you didn't carefully check for the natural variability before extrapolating what you thought being a "trend" in the evolution of ice pack. Again, any "trend" must be compared with a natural historical variability before being given any significance. First express your observations as a "number of sigmas" above the average level - you may do better predictions.
    0 0
  35. Interesting, logicman, that in the rare event you make an error that you are given correction by one so petardly awash in his own unacknowledged errors. There's a saying in there somewhere about pots and kettles (and another about eyes and planks), but I won't mention it. Look forward to your update! The Yooper
    0 0
  36. #234 - Gilles Jumping the gun a bit, aren't you? My error was nothing to do with natural variability. It was an error of observation leading to an error in the application of knowledge of materials science to that specific chunk of ice in Nares Strait.
    0 0
  37. I have been a bit slow with my writing due to illness. Today, I finally managed to finish my April ice report. In it I show how the way that the Nares ice bridge formed led me to predict a too early breakup. http://www.science20.com/chatter_box/arctic_ice_april_2011-78127
    0 0
  38. The Arctic seems poised on the brink of another record melting season. The May 4 update on the National Snow and Ice Data Center website explains that after a slow April melt, the melting trend has recently accelerated, and the trend line, as seen in the daily image update, is poised to drop well below the 2006 record. National Snow and Ice Data Center website
    0 0
  39. Don9000#238: But it's back within the two sd gray bars, so it must all be a natural cycle. For now.
    0 0
  40. Thanks, Don. The mild Arctic winter has preconditioned the sea ice cap there for a near-record to possibly a record melt season. It will be interesting to watch unfold, like a train wreck. Or a Curry post. The Yooper
    0 0
  41. 238, Don9000, Interesting, but I wouldn't get too carried away with either the descent of the curve, or any particular measure of melt "performance." On the descent of the curve... sudden changes in winds and currents, clouds, temperatures/stalled air masses, etc. all lead to abrupt and unexpected reversals (in either direction). At the same time, for example, any 15% ice graph is a limited, scalar representation of a complex system. It's is breaking down a hugely complex dynamic to a single "representative" number. IJIS offers a different estimate and a more informative graph. My own opinion is that the COI number (30% or more instead of 15%) is a better method for most purposes, and the ice area instead of extent at Arctic ROOS is useful information. But none of these shows ice volume (i.e. area * depth) or the nature of the ice itself, so they all have limits. Lastly, looking at the actual geographic distributions in concentration at Cryosphere Today is hugely important to see what's happening. The animations give a sense of "flow" and hint at what might happen next, or what's happening now that's different from the past. Their archives and date-to-date comparison pages are great tools, too. For example, I don't know how often the huge drop in concentration that we now see at the pole itself has happened in the past. This year to date has been looking very scary, not necessarily because any measure of melt looks fast, but rather because all around this year looks different, and different can lead to fast or maybe scary fast. Then of course, later in the year it's fun to actual see things with your own eyes, using the North Pole Cams to see the melt pools develop, along with an occasional rainbow.
    0 0
  42. #238 Don9000 at 22:35 PM on 5 May, 2011 The Arctic seems poised on the brink of another record melting season.
     Not likely. A much larger area is covered by thick ice in the central arctic ocean now than in 2007.
    0 0
    Response:

    [DB] Why the cherry-pick of 2007 - a record melt year due to weather conditions (strong Arctic Dipole)?  The Central Arctic Basin has not had MY ice coverage in years; all ice there now is typically first year ice, most of which does not survive the melt season regardless of thickness.

    The reality is that spring 2011 conditions as measured by PIPS 2.0 are worse than those of spring 2010, a year of continuing ice loss without evident recovery and itself part of an ongoing trend towards zero and oblivion (cue: Fade to Black):

    April trend

    But thanks for providing readers with yet another measurement tool which they can play with: PIPS 2.0


    Courtesy Neven's Arctic Sea Ice blog:


    NSIDC has just released its April analysis. Some interesting tidbits:

    Arctic sea ice declined slowly through most of April. Because of the slow decline in April, ice extent for the month as a whole did not approach record lows, as it did in March. However, ice extent began to decline more quickly towards the end of the month.

    Central Russia saw an early retreat of snow cover, as a result of prevailing warm conditions during the past winter over the eastern Arctic and Siberia.

    (...)

    Ice extent declined through the month more slowly than usual, at an average rate of 29,950 square kilometers per day (11,560 square miles per day). The average daily rate of decline for 1979 to 2000 was 40,430 square kilometers (15,610 square miles) per day.

    Cool conditions helped retain ice in Baffin Bay, between Canada and Greenland. Most of the ice loss during April was in the Kara Sea, north of Siberia, and the northern Baltic Sea in Europe. Ice also retreated rapidly in the western Bering Sea and the Sea of Okhotsk.

    (...)

    For most of April, nearly all of the eastern Arctic, north of Europe and Russia, remained warmer than average. The largest anomalies were over central Russia, northern Siberia and the Laptev and East Siberian Seas, where temperatures averaged over the month were approximately 6 degrees Celsius (11 degrees Fahrenheit) above average. In contrast, most of the western Arctic was cooler than normal, with temperatures 6 degrees Celsius (11 degrees Fahrenheit) cooler than average over Davis Strait and Baffin Bay.

    The eastern Arctic remained warmer than average all winter. This suggests that that sea ice there did not thicken as much as in past winters, and may retreat rapidly as the summer melt season progresses.

    (Emphasis added)

  43. Response: [DB] The reality is that spring 2011 conditions as measured by PIPS 2.0 are worse than those of spring 2010
     The reality is that the proposition above is not true if by "worse" you mean extension of thick ice is smaller in the central arctic this spring than it was a year ago. Of course if you mean something else, it can be made true. Clarify your position please.
    0 0
    Response:

    [DB] See Riccardo's point below about cherry-picking.

  44. "The reality is that the proposition above is not true if ..." One region, one kind of ice, one day. The trick is to choose the criterion untill it matches your will. Kind of extreme cherry picking.
    0 0
  45. Riccardo @244, Agreed Also, it appears that the relatively thick ice that PIPS model is 'seeing" over the central Arctic Ocean may in reality not be so. Look at the image form Cryosphere today: Source] One last comment. IMHO, ice state in the boreal spring does not seem to be a terribly good indicator of minimum sea-ice extent area in September.
    0 0
    Response:

    [DB] Ice extent and area histories are no longer reliable comps to go by.  As the Barber video showed, even the MY ice no longer presents much obstacle to navigation in the Arctic.

    Just as temperatures and CO2 levels are changing in greater-than-linear-fashion, so too the demise of the Arctic sea ice; the losses overall are increasing in greater-than-linear-fashion.  The condition of the ice is a continuum; each season preconditions the ice for the next.  The recent winter was abnormally warm in the Arctic with greater warm oceanic water penetration from the Bering Straits and the North Atlantic.  This has set the stage for the 2011 summer melt season drama to be played out before us.

    We are in "uncharted waters", wherin past indicators (pre-2005) of melt performance and winter regrowth are no longer the reliable indicators of things to come that once they were.  Each year sees more MY ice loss through top-and-bottom melt and advection out the Fram Strait; additionally, less FY ice survives to MY ice status.

    Death Spiral.

  46. Albatross:
    IMHO, ice state in the boreal spring doe snot seem to be a terribly good indicator of minimum sea-ice extent area in September.
    [img src="http://www7320.nrlssc.navy.mil/pips2/archive/pips2_thick/2007/pips2_thick.2007050400.gif" height="220" width="200" /][img src="http://www7320.nrlssc.navy.mil/pips2/archive/pips2_thick/2010/pips2_thick.2010050400.gif" height="220" width="200" /] As emphasized by the comparison of BP's images to the same date on the record low 2007 year (from these, one would have projected that 2010 would have produced the lowest extent on record): [img src="http://www7320.nrlssc.navy.mil/pips2/archive/pips2_thick/2011/pips2_thick.2011050400.gif" height="220" width="200" /] Again, predicting any one year at any point is difficult to do. The only prediction one can realistically make is that the long term trend is going to continue to be downward, and new records will continue to be set (but not necessarily every year).
    0 0
    Moderator Response: [Sph] Bad images removed.
  47. Interesting comments! My understanding is rather incomplete, but since the Arctic basin and surrounding seas are adding more meltwater to the surface waters each melt season, I suppose this means that the intensity (is that the correct word?) of the halocline during the autumn and winter is increased. In other words, the increased summer melting and reduction in the overall ice volume must be making the surface waters of the Arctic fresher which may well cause the surface waters to take just a bit longer to freeze in the autumn. It seems to me that this is a variable that is potentially in flux for a number of different reasons, and this must have consequences if it is so. For example, I understand that the fresher water being added to the Arctic waters during the melt season results in more surface ice forming earlier in the fall/winter for the simple reason that it freezes at a higher temperature than saltier water. And I gather that the Arctic still has a well-established halocline despite the significant and continuing reduction in overall ice volume, but I also suppose that eventually the halocline will begin to break down, if the trend continues. Right now, my best guess is that the Arctic still has plenty of relatively fresh water at the surface. Also, given that the sea ice that forms is fresher if it forms at higher temperatures because it is then able to exclude more salt, I suspect that the ice that exists in the Arctic is fresher than it used to be. Has anyone studied this? If the ice is fresher than it was a few decades ago, it makes sense that it melts more rapidly once the temperatures warm in the spring. This is part of the reason I made my comment about the potential for a record melt, since not only are the air temperatures higher than they were a few decades ago, but the ice that is present may have a higher melting point. That said, it seems to me that eventually, as the Arctic is open to wave and wind action for longer periods of time, it will lose a significant portion of its fresher surface waters to the Atlantic in particular. Is this happening? Or is it predicted to happen? If it does, given the rising temperature trend, I would think that future sea ice formation in the Arctic will delayed and reduced since the surface water will be saltier and the air temperature will be warmer.
    0 0
  48. Oops! I see I said it would take the water longer to freeze in the autumn! That is a relic of a revision! Sorry!
    0 0
  49. Just ripped this off borrowed this from Neven's Arctic Sea Ice blog: [Courtesy of FrankD] Based on PIOMAS volume data. Can you say "Death Spiral faster than linear?"
    0 0
  50. Well, here we are in late May, and... [Caveat: I still say ice watching/predicting is a fruitless endeavor, because it is the long term impact of warming that matters, and regardless of how long it takes, it's going to happen... but with that said...] If you visually compare May 21 of 2007 to 2011, the extent is roughly the same, but there are many indicators that the 2011 ice is headed in a different direction. There are many areas where the ice is not as dense now compared with 2007, pointing to the potential for a lower final extent. It's also interesting to note the difference in snow cover on land at the same time. Visually compare May 21 2007 to May 21 2011 I hope things slow down.
    0 0

Prev  1  2  3  4  5  6  Next

You need to be logged in to post a comment. Login via the left margin or if you're new, register here.


The Consensus Project Website

THE ESCALATOR

(free to republish)


© Copyright 2024 John Cook
Home | Translations | About Us | Privacy | Contact Us