Climate Science Glossary

Term Lookup

Enter a term in the search box to find its definition.

Settings

Use the controls in the far right panel to increase or decrease the number of terms automatically displayed (or to completely turn that feature off).

Term Lookup

Settings


All IPCC definitions taken from Climate Change 2007: The Physical Science Basis. Working Group I Contribution to the Fourth Assessment Report of the Intergovernmental Panel on Climate Change, Annex I, Glossary, pp. 941-954. Cambridge University Press.

Home Arguments Software Resources Comments The Consensus Project Translations About Support

Bluesky Facebook LinkedIn Mastodon MeWe

Twitter YouTube RSS Posts RSS Comments Email Subscribe


Climate's changed before
It's the sun
It's not bad
There is no consensus
It's cooling
Models are unreliable
Temp record is unreliable
Animals and plants can adapt
It hasn't warmed since 1998
Antarctica is gaining ice
View All Arguments...


Username
Password
New? Register here
Forgot your password?

Latest Posts

Archives

Ocean Cooling Corrected, Again

Posted on 28 July 2011 by Rob Painting

The ongoing difficulty of accurately measuring the Earth's ocean heat content has led to premature "skeptic" claims about ocean cooling. A recent paper Von Schuckmann & Le Traon (2011) put the kibosh on ocean cooling claims. They find that from 2005 to 2010 the global oceans (10 to 1500 metres down) have continued to warm, although they caution that their result is based on the assumption that there are no more systematic errors in the data gathered from ARGO floats which measure ocean heat.

Figure 1 -Revised estimate of global ocean heat content (10-1500 mtrs deep) for 2005-2010 derived from Argo measurements. The 6-yr trend accounts for 0.55±0.10Wm−2. Error bars and trend uncertainties exclude errors induced by remaining systematic errors in the global observing system. See Von Schuckmann & Le Traon (2011)

The more (data), the merrier 

The ARGO float network began rollout in 2000, but prior to 2005 there wasn't sufficent global coverage, and because of this Von Schuckmann and Le Traon (2011) start their analysis from 2005 onwards. The authors found that only after November 2007 (when ARGO was 100% complete) is the ARGO network sufficiently robust to give accurate short-term trends of what they term 'global ocean indicators'. This being steric sea level changes (sea level rise from thermal expansion as the oceans warm), heat content, and ocean salinity. This is probably best illustrated in the figure below, where the authors apply their method of analysis to the satellite sea surface height (SSH) data (AVISO):
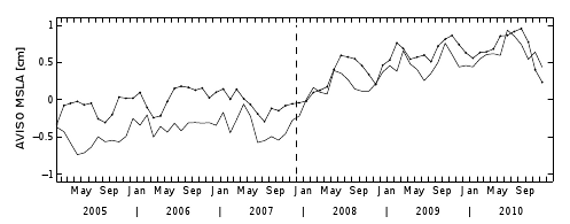
Figure 2 -Method validation using gridded altimeter SSH measurements (AVISO): gridded SSH during 2005–2010 has been subsampled to the Argo pro?le position and the simple box averaging method has been applied. Global mean SSH derived from the AVISO grid (bold line) is compared to its corresponding subsampled result.  

The two lines represent the satellite data and a subsampled set using the position of the ARGO float profiles and the authors 'box averaging' method - a method to account for the irregular distribution of ARGO floats in the ocean, and missing and spurious (faulty) data. After 2007 (vertical dashed line), when the ARGO installation is complete, it is obvious that both sets show greater agreement. This highlights how sensitive the short-term trends are to the number of ARGO floats in the network. 

Errors reduce as the length of observation increases 

Von Schuckmann & Le Traon (2011) also estimate the errors in global trends from the period analysed, and also future error uncertainty. For the 2005-2010 period the error uncertainty is plus/minus 0.1 watt per square metre; quite large considering the global trend over the period is 0.55 watts per square metre. However, after 15 years of observations the uncertainty drops considerably, down to ± 0.02 watts per square metre. This demonstrates how longer periods of observation, along with the complete ARGO network, are critical to derive more accurate long-term ocean trends. 

Ocean warming in context

The warming trend observed is slightly smaller than that seen in Von Schuckmann (2009), where the authors measure down to ocean depths of 2000 metres, and found a warming trend of 0.77 ±0.11 watts per square metre. However, it completely refutes a recent (2010) skeptic paper which suggested the oceans were cooling, based on the upper ocean down to 700 metres. Clearly much heat is finding it's way down into deeper waters. And although small in comparison, the deep ocean is gaining heat too. 

Upper ocean warming (0-700mtrs) is slower than that observed during the 1990's, but the oceans are still gaining heat. Indeed, the slow-down is to be expected if recent papers on increased reflective aerosols in the atmsophere are correct

Conclusion

The ARGO network was completed in November 2007, and only since then has the network been able to provide more robust short-term trends. Over the period 2005-2010 the oceans (10-1500 meters down) have warmed 0.55 watts per square meter, but error uncertainty is almost 20%. Uncertainty will reduce as the length of the observational record increases, but Von Schuckmann and Le Traon (2011), caution that this is provided no more systematic errors remain in the network.    

0 0

Printable Version  |  Link to this page

Comments

Prev  1  2  3  Next

Comments 51 to 100 out of 124:

  1. Re the GSL rise, some "skeptics" here are suggesting that the ARGO data are too short to arrive at a discernible trend between 2005 and 2010. Yet, another "skeptic" on the same thread wants to try and convince us that the rate of increase in GSL is decelerating at a significant rate over the same period using such scientific and compelling language as "for all practical purposes.". Well sorry, that does not cut it. So what do the experts in the field say concerning the rate of GSL rise (note the error bars)? "GMSL Rates CU: 3.2 ± 0.4 mm/yr AVISO: 3.22 ± 0.6 mm/yr CSIRO: 3.2 ± 0.4 mm/yr NOAA: 3.2 ± 0.4 mm/yr (w/ GIA)" [Source] Now with that all said, it does appear that the rate of increase in GSL may have slowed since around 2004. Unfortunately, this has led some people to get very excited as to the perceived implications (not only now but down the road too), and make such ludicrous assertions such as made by BP @ 41: "In this case current rate of ocean warming is 0.2°C/century and land based ice is not in immediate peril. I can live with that." To assert that is absurd, and just bad science period. Because, as found by Katsman and Oldenborgh (2011): "The analysis reveals that an 8-yr period without upper ocean warming is not exceptional [0-700 m]. It is explained by increased radiation to space (45%), largely as a result of El Nino variability on decadal timescales, and by increased ocean warming at larger depths (35%), partly due to a decrease in the strength of the Atlantic meridional overturning circulation." There is the (possible) mechanism required for the increase in deep ocean heat content that the "skeptics" keep whining about. They go on to claim that: "Recently-observed changes in these two large-scale modes of climate variability point to an up- coming resumption of the upward trend in upper ocean heat content." We'll have to wait and see, b/c if aerosols are indeed a role player it might not be internal variability that is explaining all of this. That is, this has all been further complicated by the huge increase in sulphate aerosols from Asia in the last decade, not to mention by a prolonged solar minimum. Last, but not least, "skeptics" seem very fond of ignoring error bars and uncertainty (but only when trying to make claims that it is not bad of course). The estimate of ice sheet loss, GSL rise and OHC are not hard and fast numbers that one can use make grandiose and bold deductions and predictions about with simple back-of-the envelope calculations.
    0 0
  2. Albatros #51 "Now with that all said, it does appear that the rate of increase in GSL may have slowed since around 2004. Unfortunately, this has led some people to get very excited as to the perceived implications (not only now but down the road too), and make such ludicrous assertions such as made by BP @ 41:" Why would you use the term 'ludicrous'? I checked the numbers BP offered up in support of his argument and they are correct. Furthermore, your quotation: "The analysis reveals that an 8-yr period without upper ocean warming is not exceptional [0-700 m]. It is explained by increased radiation to space (45%), largely as a result of El Nino variability on decadal timescales, and by increased ocean warming at larger depths (35%), partly due to a decrease in the strength of the Atlantic meridional overturning circulation." "There is the (possible) mechanism required for the increase in deep ocean heat content that the "skeptics" keep whining about." So it is 'whining' when skeptics point out inconsistencies in the AGW science, but it is OK for the AGW protagnists to offer only 'possible' mechanisms as evidence for maintaining a 0.39W/sq.m global warming imbalance, let alone a 0.9W/sq.m which is still being held fast by Dr Trenberth. Dr Trenberth responded on the **'Trenberth on Tracking...' SKS thread recently.. "ENSO involves a redistribution of OHC and losses to the atmosphere in the latter part of El Nino, and gains during La Nina, so this is internal to the climate system, not external (comment 31). The southern ocean is clearly playing a role (comments 48, 49)in taking up heat and mixing it deep, even though the magnitude of the observed warming is small. But the data are fragmentary and unsatisfactory in many respects. Nonetheless, the southern oceans, while playing some role, are not the main place where the heat goes in our model. We have a paper submitted that describes and documents that in more detail so it is premature to go into detail here." When does ENSO become an 'external' and not an 'internal' forcing of the climate system? El Nino and La Nina cycles are NOT 10 years apart. Dr Trenberth seems to be offering another 'model' in his upcoming paper rather than actual observations. We will read it with great interest. This is what Dr Trenberth** said on SKS about the 'Asian sulphates' explanation for the stasis in surface temperatures: "There is discussion in the comments of the supposed finding that increasing aerosol (pollution) from China may be the explanation for the stasis in surface temperatures and I do not believe this for a moment. Similarly, Jim Hansen has discussed the role of aerosol as a source of discrepancy. However, the radiation measurements at the top of the atmosphere from satellites (CERES) include all of the aerosol effects, and so they are not extra. They may well be an important ingredient regionally, and I have no doubt they are, but globally they are not the explanation." Sot there still remains the fundamental inconsistency in the AGW science - CO2GHG and its climate feedbacks are supposed to be producing an increasing imbalance at TOA and increasing surface warming and observations over the last 6-10 years show that this is not happening.
    0 0
  3. Is there an estimate with error bars of continental heat uptake ? I have seen estimates of 0.75x10^22 J but with no error bars Thanx sidd
    0 0
  4. To follow up to my own post: The hansen energy imbalance paper provides various estimates of contributions to heat uptake http://www.columbia.edu/~jeh1/mailings/2011/20110415_EnergyImbalancePaper.pdf sidd
    0 0
  5. Hello Ken, I'll respond to your post @52 as soon as I can find a suitable window of time. For now, I will note that your post is a great example of the blind spot that you have for BP's musings, and I'll note too that BP has still not responded to requests to provide a reputable scientific citation that refutes von Shuckmann and Le Traon (2011). Also, I would ask for you to please elaborate on what the implications of this perceived "fundamental inconsistency in the AGW science" are. Are you trying to suggest that the theory of AGW has been overturned? Are you suggesting that it means that climate sensitivity to doubling CO2 is grossly overestimated? Thanks.
    0 0
  6. Albatross @51: "There is the (possible) mechanism required for the increase in deep ocean heat content that the "skeptics" keep whining about. " This isn't anything I'm really an expert on, but I do note that there are (at least) two observed mechanism known to allow heat from the surface to interact with the ocean floor (and vice versa): 1. Interannual atmospheric variability forced by the deep equatorial Atlantic Ocean, also discussed here 2. Surface-Generated Mesoscale Eddies Transport Deep-Sea Products from Hydrothermal Vents, also discussed here I don't think heat transport was a main interest in either study, so that information might not be available (so far, I've only found the abstracts). But at least the second paper implies Reynold's numbers high enough to provide for mixing. The discussion of the second also implies that there hasn't been much research into the interaction between the ocean surface and ocean floor, so who knows what will be found if/when people start looking. But they provide decent known mechanisms for ocean surface/floor interactions.
    0 0
  7. KL -"This is what Dr Trenberth** said on SKS about the 'Asian sulphates' explanation for the stasis in surface temperatures:........ I know Doc Trenberth disagrees but the paper I linked to @45 doesn't agree with the 0.9w/m2 value often quoted. Furthermore the paper cited (Hatzianastassiou (2011) in Dana's recent post Michaels Mischief #1: Continued Warming and Aerosols shows a pronounced 'global dimming', particularly the southern hemisphere during the 'noughties '. Just saying you shouldn't get hung up on the 0.9w/m2 figure, be a genuine skeptic on that number.
    0 0
  8. KL - "Why would you use the term 'ludicrous'? I checked the numbers BP offered up in support of his argument and they are correct." That's curious Ken, for the best part of 18 months at least you have been proclaiming the ARGO dataset as the best measure of ocean heat content (it is - but still has issues to be resolved), but now it is clear that the oceans are still warming, albeit at a slower rate than the 1990's, the ARGO floats are now worthless?, because of BP's erroneous assertions? That's one big flip-flop.
    0 0
  9. A thing that may be useful to show: Sea level rise (detrended) vs. Multivariate ENSO Index From the University of Colorado article: "To compare the global mean sea level to the MEI time series, we removed the mean, linear trend, and seasonal signals from the 60-day smoothed global mean sea level estimates and normalized each time series by its standard deviation. The normalized values plotted above show a strong correlation between the global mean sea level and the MEI, with the global mean sea level often lagging changes in the MEI. Since the MEI has recently sharply increased (coming out of a strong La Niña), we expect the global mean sea level estimates to also reverse their recent downward trend and begin to increase as the La Niña effects wane." In the next months sea level should go up as the global ocean responds to the end of La Niña. We have just to wait and see.
    0 0
  10. Rob @58, It is unfortunate that Ken cannot see the absurdity of BP's claim that I quoted above. If people wish to see a correct accounting of the terms in Question then please read Hansen et al. (2011) that Sidd linked to above @54. It is a long document but I highly recommend that people interested in this issue read the paper-- it is an excellent investment of one's time. SteveS @56, Thanks, very interesting. You will most likely not convince BP or Ken though, they will most likely just brush it off or glibly dismiss it.
    0 0
  11. Albatross - I never expect to convince a faux skeptic, but genuine skeptics can't help but be convinced that global warming is real, it's happening now, and will be a huuuuge problem. But BP does raise an extremely worrying point, one I only hinted at in the post. The thermal component of sea level rise does appear to have slowed in the last decade. Yes, I know short datasets and large uncertainty and all that, but it seems to be the case. Sea level rise on the other hand continues to rise, confirming the accelerated melt observed on the Greenland and West Antarctic icesheets i.e. ice melt has made up a larger proportion of the sea level rise in the 'noughties'. So why is it worrying?. See the paper referenced in this post: Rising Oceans - Too Late to Turn the Tide?. The Role of Ocean Thermal Expansion in Last Interglacial Sea Level Rise - McKay (2011) I'll cut to the chase: "Taken together, the model and paleoceanographic data imply a minimal contribution of ocean thermal expansion to LIG sea level rise above present day. Uncertainty remains, but it seems unlikely that thermosteric sea level rise exceeded 0.4±0.3 m during the LIG. This constraint, along with estimates of the sea level contributions from the Greenland Ice Sheet, glaciers and ice caps, implies that 4.1 to 5.8 m of sea level rise during the Last Interglacial period was derived from the Antarctic Ice Sheet. These results reemphasize the concern that both the Antarctic and Greenland Ice Sheets may be more sensitive to temperature than widely thought." And note this recent paper on the Greenland icesheet: Sr-Nd-Pb Isotope Evidence for Ice-Sheet Presence on Southern Greenland During the Last Interglacial - Colville (2011) "These results allow the evaluation of a suite of GIS models and are consistent with a GIS contribution of 1.6 to 2.2 meters to the ≥4-meter LIG sea-level highstand, requiring a significant sea-level contribution from the Antarctic Ice Sheet." You'll note a great deal of coherency between the papers I'm referencing -the observations seem to fit. The last paper is more worrisome, even in the last interglacial, when the Northern Hemisphere summer saw the brunt of the warming, most of the melt contributing to SLR came from Antarctica.
    0 0
  12. Sea level budget over the 2005-2010 period (half of 2010 anyway): Black line is the sea level as observed by satellite altimetry, blue line is the steric (expansion due to warming), red is the ocean mass according to GRACE gravity satellites, and purple is the steric and mass combined. So a reasonable match considering the uncertainty in the datasets. Note the steric component tailing off. See: Balancing the Sea Level Budget - Leuliette & Willis (2011) There's a whole bunch of recent discussion papers at the Oceanographic Society magazine in the link above - for any interested readers.
    0 0
  13. Rob Painting #58 and #62 You have nearly answered your own question at #62. BP was pointing out that three sea level equivalent measures were inconsistent with the oceans gaining heat. Land Ice melt was equal to a mass increase +3.1mm/yr, Satellite SLR was equal to +2.3mm/yr so therefore steric rise must be negative (-1.1mm/yr if isostatic rebound is included). Therefore these measurements do not support a rise in OHC. That does not mean that any measurement is gold plated. Argo might be right in measuring a 0.39W/sq.m OHC increase and the satellite SLR wrong of the ice melt estimate wrong. You at #61 are now supporting the point with references that in last interglacial the large mass rise from Antarctica occurred with a negligible steric rise. The conclusion from that is during in the last interglacial all the heat went into ice melt and little into warming the oceans. A feasible transport mechanism for the heat would be needed - however as BP pointed out if you can concentrate the heat into melting land ice - you only need 1/58th the amount to get a unit rise in sea level compared with thermally expanding the oceans. Over to you for the feasible transport mechanism.
    0 0
  14. Rob @61 and 62, Thanks Rob, very interesting and not much reason to support BP's optimism that the alleged current rate of warming of 0.02 C/decade will continue, well he does not say how long he expects that to continue for, but given that he can "live" with that, one can probably assume it is on the order of decades. These vague, non-committal statements made by "skeptics" are really not helpful or constructive. "The thermal component on sea level rise does appear to have declined in the last decade" I think that you meant to say for the 2005-2010 period the steric contribution may have leveled off or decreased slightly (at least according to Leuliette and Willis, 2011) but is is difficult to say b/c of the relatively large error bars (there is so much overlap when one allows for uncertainties)-- all the more reason not to be making bold assertions that the "oceans are cooling" or that there is a "fundamental inconsistency in the AGW science" based on 5-6 years of noisy data derived from different observations platforms. As I mentioned earlier, Hansen et al. (2011) has also done some accounting for 2005-2010, and his number are very different from the amateur efforts here. Here are the estimated ranges in relative contributions for the 2005-2010 period: Ice melt: +1.27 to + 2.4 mm/yr Abyssal oceans and southern oceans: 0.156 mm/yr Steric rise: +0.55 to 0.83 mm/yr Total: +2.0 mm/yr to +3.4 mm/yr (mean near +2.7 mm/yr). Now, satellite GSL increase for the same period was +1.4 to +3.0 mm/yr (mean +2.2 mm/yr), data from Leuliette and Willis (2011). Pretty good agreement given the limitations of the observations. Now consider the that 'skeptics' here are alleging that for the same period the steric contribution was significantly negative (??)...well, two published papers by experts in the field disagree with that nonsensical assertion. PS: And this claim "however as BP pointed out if you can concentrate the heat into melting land ice - you only need 1/58th the amount to get a unit rise in sea level compared with thermally expanding the oceans.", seems to support the findings of the works that you cited concerning GSL during the last interglacial, not challenge them.
    0 0
  15. KL - BP was pointing out that three sea level equivalent measures were inconsistent with the oceans gaining heat." Which is inconsistent with direct observations from the ARGO thermometers, and with published studies. Land Ice melt was equal to a mass increase +3.1mm/yr, Satellite SLR was equal to +2.3mm/yr so therefore steric rise must be negative (-1.1mm/yr if isostatic rebound is included) The Rignot (2011) paper cited by BP says this: "In 2006, the Greenland and Antarctic ice sheets, experienced a combined mass loss of 475 ± 158 G t /y r , equivalent to 1.3 ± 0.4 mm/yr sea level rise." How do we get from that, to BP's 3.1mm per year? "Therefore these measurements do not support a rise in OHC. Yes, but they're BP's calculations. What more can I say? You at #61 are now supporting the point with references that in last interglacial the large mass rise from Antarctica occurred with a negligible steric rise. Very relevant methinks. It suggests that the ice sheets are going to dominate SLR in the future. In fact a recent paper on the new ice sheet models indicate it's too late for the Greenland Ice Sheet. But remember that the last interglacial was due to orbital factors- CO2 was much lower than today. In comparison the increased Greenhouse Effect will last for centuries, the oceans will continue to soak up heat for a very long time until equilibrium is reached. The current slow-down is only temporary I suspect, and largely due to global dimming and a decline in the radiative forcing over the last decade. From a physics-based point of view it makes sense, less solar radiation reaching the sea surface from the aerosols, and associated cloudiness, causing the heat uptake (daytime phenomenon) to slow-down. But the increased Greenhouse Effect has altered the thermal gradient in the ocean skin layer slowing the leakage of heat back into the atmsosphere. It will persistently warm for centuries.
    0 0
  16. Ken @63, "Land Ice melt was equal to a mass increase +3.1mm/yr" Wrong. You and BP are misrepresenting Rignot et al.'s (2011) results.
    0 0
  17. Hi Rob @65, We cross posted, and then I saw that we have both identified the same glaring error in their reasoning....
    0 0
  18. Albie @ 64 - Whoops, corrected. The funny thing is the 1/58th thing (note no error bars) is actually discussed in Leuliette & Miller (2011). Of course BP's calculations and linear mindset fail to account for the large annual fluctuations in both SLR and the steric component. I guess they can't be happening either?
    0 0
  19. Albie - check out the graph at @ 62. Are you thinking what I'm thinking? (Hint: the divergence)
    0 0
  20. #42 Rob Painting at 21:29 PM on 29 July, 2011 They [Von Schuckmann and Le Traon] use a more complete dataset and different analysis (infilling missing profiles with 'averaged anomalies' as opposed to zero anomaly infilling employed by Lyman et al for instance) and measure deeper into the ocean. 10-1500 metres, you will note, includes 690 metres of the top 700 metres of ocean. That's not the point. Both Levitus and Schuckmann provide error bars for their estimates. If these are correct, the 0.39 ± 0.07 W/m2 average of the latter study for period 2005-2010 and depth range 10-1500 m can be divided to 0.14 ± 0.06 W/mm2 imbalance for the upper 700 m and 0.25 ± 0.09 W/mm2 for the rest (700-1500 m). It means almost twice as much heat went into the lower layer then into the upper one, while their mass is pretty similar. It begs some explanation, doesn't it? This derivation does not depend on the details of the two studies, just on the estimates and error bars, and on the assumption their errors are independent of each other. If it is your opinion that the Levitus data are flawed in some manner and their estimate (including error bars) for the upper 700 m is off, please say so. And, of course, substantiate your claim. By the way, it would be much easier to evaluate the paper if they provided that breakdown themselves in units directly comparable to those used in other studies or at least published their supplementary data & algorithms online that could be used to do the job independently. Unfortunately they have chosen another course. _ While we are into this OHC thing, some words about how on earth can heat get down to the abyss at all are in order. The first thing to note is that the MOC (Meridional Overturning Circulation) is not a heat engine. That is, it does not convert temperature differences into mechanical energy to keep ocean currents moving, but it is the other way around. It depends on some external mechanical energy source to maintain circulation and redistribute heat. If a body of fluid in a gravitational field (like the oceans) is both heated and cooled at different places but at the same gravitational potential (e.g. at the surface on low and high latitudes respectively), that would not produce any macroscopic flow whatsoever. There are two caveats to this proposition. 1. Visible light (sunlight) and especially UV can penetrate into the ocean to some depth (a couple of hundred meters at most), so heating in fact happens at a somewhat lower geopotential than cooling, which is restricted to the surface (down to several meters, if waves are taken into account). But it would provide for a very shallow circulation only, not the kind of deep overturning observed. Also, it is worth noting that thermal infrared ("back radiation") can not penetrate into seawater at all (several mm at most). 2. There is also heating at depth, by geothermal heat flux, which is about 0.1 W/m2 averaged over the entire seafloor (and 0.04 W/m2 over the continents). In some regions (for example at the boundaries of the Nazca plate, South Eastern Pacific) it can be as high as 0.3 W/m2. This heating happens at the right geopotential (at the bottom), so it does produce overturning, albeit at a much slower rate than observed. Needless to say heat conductivity of seawater is so low, that by conduction alone (with no macroscopic flow) it would take ages for heat to get down to the abyss from the surface. There are parts of MOC that work as a heat engine indeed. Downwelling of cold saline water in polar regions is such an exception. However, if there were no other processes at work in other regions, the abyss would eventually get saturated with very cold water of high salinity and downwelling would stop altogether. Or rather, it would switch to the much slower rate permitted by geothermal heating alone. We should also note this part of the so called thermohaline circulation does not add heat to the abyss, but removes it from there. Currently deep water production is restricted to two distinct regions of the oceans. One is where the North Atlantic joins the Arctic ocean, the other is along the Antarctic coastline. In theory it could also happen in the North Pacific, but in fact it does not, for the salinity is too low there and the coastline is not cold enough. Details of the physics are somewhat different in the North and the South though. The North Atlantic Drift carries ample quantities of warm, highly saline water into the Arctic ocean (the high salinity is leftover of evaporation), which cools down there and when it gets next to freezing (the most dense state of seawater), it sinks. It is an intermittent process, restricted to "chimneys" (of diameter ~100 km and lifetime of several weeks) in the open ocean. Please note the heat carried to the polar region this way is lost to the atmosphere entirely, the cold saline water sinks to the bottom without it. This heat subsequently is radiated out to space, as that is the only heat reservoir around which is colder (-270°C). Antarctica is a special place. No warm current gets near to the continent, so salinity of seawater there is inherently lower than in the Northern Atlantic. On the other hand along the coastline, especially in winter, extremely cold gale force katabatic winds descend from the plateau creating polynyas (open water expanses) by blowing sea ice away. High chilly winds coupled with open water provide for vigorous cooling of water masses (because total area of air-sea interface is huge, think of sea spray) and as sea ice starts to form, salinity also increases by brine exclusion. Cold dense water then descends to the abyss along the continental slope. At the underside of great Antarctic ice shelves even super-cooled water is formed. Its potential temperature is below freezing, that is, it only stays fluid because of pressure, it would freeze if raised to the surface. In general abyssal water of Antarctic origin is somewhat colder but less salty than its Arctic cousin. But still, we need an energy source to keep the engine going. In other words, abyssal waters have to be warmed up and diluted in order to be able to raise somewhere and make room for more cold, dense polar water. The process that does exactly that is supposed to be deep turbulent mixing, driven by external mechanical energy sources like tides and winds. Tidal forcing is a considerable source of mixing, but it is deterministic and independent of all other forcings on climate. It is also cyclic, not exactly, but close enough. The Metonic cycle (the period the National Tidal Datum Epoch [NTDE] of the U.S. is based on) is 19 years long. Or more precisely it is 235 synodic months which is 1h 38' longer than 19 tropical years. The nodal cycle of lunar orbit happens to be only slightly shorter than that (18.5996 years). It means if one is looking for trends in deep turbulent mixing, it is best to consider multiples of the Metonic cycle. Epochs shorter than that (like 6 years) are to be considered as a last resort only if one does not have data with longer timespan. Even then some caution is in order, to filter out tidal effects on trends as much as possible (the same is true for sea level studies). The other source is internal waves excited by winds. One can see that distribution of wind power is extremely uneven on the surface of Earth. It is concentrated in three regions, the Southern ocean, the Norh Pacific and the Norh Atlantic. Of these winds in the south are the most intense by far (and surprisingly mild over the continents). The only problem remaining is that in the open ocean turbulent mixing is measured to be at least an order of magnitude smaller than needed to maintain the observed flows in MOC. The solution seems to be there are narrow regions where topography of the bottom is very complex, like over mid ocean ridges or certain rugged continental slopes where deep turbulent mixing can be up to two, sometimes even three orders of magnitude higher than average. However, these sites are poorly known and most are not even identified yet. So, the very energy source driving MOC and making thermohaline downwelling possible is not well constrained. It is also one of the (many) weak points of GCMs (General Circulation Models). This process is represented in them only through parametrization and even if we knew much better the process going on in real oceans, their too coarse resolution could not accommodate to the small scale vigorous and probably intermittent mixing which characterizes it. Anyway, the take home message is that MOC (Meridional Overturning Circulation), consequently heat exchange between the surface and abyss is not driven by temperature differences, but external mechanical energy sources. Of course winds (unlike tides) are not independent of climate (they are driven by a heat engine, as the atmosphere is mostly heated from below and cooled from above), but in this respect one has to study winds over the southern ocean first (roaring forties & stormy fifties), as according to some estimates up to 80% of deep turbulent mixing happens here (or rather, in restricted sub-regions of it). Therefore if one is interested in heat transport to the lower layers of oceans, one should pay close attention to those remote and alien waters.
    0 0
  21. BP has still not acknowledged and corrected his colossal error @9 (an error that is still being happily perpetuated by fellow "skeptics" despite it being brought to their attention a couple of times up thread),and BP has also repeatedly ignored the challenge made to him by KR and me to "As Albatross asked earlier, do you have any peer reviewed references that contradict Von Schuckmann and Le Traon 2011?. Instead, we get more pontification and hand waving from BP....this pattern by "skeptics" of hi-jacking threads and throwing them off topic is becoming incredibly tiresome.
    0 0
  22. Hi Rob @68, Re the divergence. I'm not sure-- a problem with the ARGO data post 2009?
    0 0
  23. #71 Albatross at 02:15 AM on 1 August, 2011 BP has also repeatedly ignored the challenge made to him by KR and me to "As Albatross asked earlier, do you have any peer reviewed references that contradict Von Schuckmann and Le Traon 2011?" No need for that. Leuliette & Willis (2011), cited by #62 Rob Painting already refutes Rignot's exaggerated claim of sea level rise by melting land based ice (rate changing from 2.3 to 3.1 mm/year between 2005 and 2011). Actually not even half that value is true (according to Leuliette & Willis), which allows for some mild warming below 700 m by increased deep turbulent mixing indeed. So, just for the record: ice is not melting that fast. _ I also notice my reply to #51 Albatross has disappeared. It means I am supposed to tolerate insults from Albatross, but even mild irony is unacceptable if it is directed to him. Understood, reworded version follows. #51 Albatross at 16:37 PM on 30 July, 2011 To assert that [current rate of ocean warming is 0.2°C/century] is absurd, and just bad science period. Even with Trenberth's 0.9 W/m2 imbalance at TOA (which was never based on actual measurements, but on virtual "experiments" performed on computational climate models and which is ruled out by now) warming rate of oceans is still at most 0.4°C/century. In order to get dangerous warming in a century (as projected by IPCC) one has to find a way to maintain ~3°C more temperature difference between the oceans and the surface than there is today. Unfortunately the more vigorous deep turbulent mixing is supposed to be, the more impossible it seems to achieve that goal. And Von Schuckmann & Le Traon are trying to push exactly that process to the limit.
    0 0
    Response:

    [DB] Your implications of fraud and malfeasance are insulting, revolting and disturbing (in no particular order), and are a violation of the Comments Policy.

    Please note that posting comments here at SkS is a privilege, not a right.  This privilege can and will be rescinded if the posting individual continues to treat adherence to the Comments Policy as optional, rather than the mandatory condition of participating in this online forum.

    Moderating this site is a tiresome chore, particularly when commentators repeatedly submit offensive or off-topic posts. We really appreciate people's cooperation in abiding by the Comments Policy, which is largely responsible for the quality of this site.
     
    Finally, please understand that moderation policies are not open for discussion.  If you find yourself incapable of abiding by these common set of rules that everyone else observes, then a change of venues is in the offing.

    Please take the time to review the policy and ensure future comments are in full compliance with it.  Thanks for your understanding and compliance in this matter.

  24. Berényi Péter - From Leuliette & Willis (2011), "Because of both uncertainties in the observational systems and interannual variations, it has been estimated that a minimum of 10 years is necessary to meaningfully interpret global trends in sea level rise and its components" They also note that "Global mean sea level change from TOPE X/Poseidon, Jason-1, and Jason-2 has had a relatively consistent trend of 3.2 ± 0.8 mm/yr over 18 years." Hence your statement that "rate changing from 2.3 to 3.1 mm/year between 2005 and 2011" (a six year period, not 10) is quite puzzling. You have certainly not presented a refutation of Von Schuckmann & Le Traon. If anything, your posts point to the differences in opinion about the GIA values - Von Schuckmann & Le Traon use one rate for their calculations, Leuliette (page 5) uses a different one with a 1 mm/y difference. There are certainly going to be short term variances in OHC trends. There's also going to be changes in forcings, such as Asian aerosols over the last decade. None of this significantly affects the long term path we've chosen (CO2 increases) that includes a great deal of warming over the next century and then some, sea level rise effects on many coastlines (and here we are, essentially a littoral species according to population distributions), and serious costs for adaptation. You've misrepresented L&W 2011, cherry-picked some short term data to claim a major decrease in warming rates, assume that this will continue for a significant period of time, and assert that "In this case current rate of ocean warming is 0.2°C/century and land based ice is not in immediate peril. I can live with that." This is notably contradicted by observed accelerating land based ice melt rates (so so many references), ARGO OHC data, and the basic physics of the greenhouse effect. It amounts to sticking your fingers in your ears and singing "Lalalala...". While I dislike characterizing it as such, this is an awful lot of work put into denial.
    0 0
  25. #58 Rob Painting at 08:23 AM on 31 July, 2011 That's curious Ken, for the best part of 18 months at least you have been proclaiming the ARGO dataset as the best measure of ocean heat content (it is - but still has issues to be resolved), but now it is clear that the oceans are still warming, albeit at a slower rate than the 1990's, the ARGO floats are now worthless? They are certainly not worthless. And as I have already pointed out, coverage was virtually global by the end of 2003 (but not before). It got denser later on, but that's another question which can be dealt with using larger error bars for the early period. Systematic errors due to the gaping hole in the Southern ocean (and to a smaller extent elsewhere) are gone by that time. So it is rather hard to justify cutting data at the beginning of 2005 as Von Schuckmann & Le Traon do. The issue for the last 18 months was with using ARGO data from 2002-2003, when coverage was still poor to justify the huge jump of estimated OHC in late 2002 − early 2003, so that's another question. Unfortunately I can not access the full Argo database online at the moment, but the NOAA NODC OCL Global Ocean Heat Content page provides data for the upper 700 m of oceans (from the beginning of 1955, but since about 2003 their data are derived almost exclusively from ARGO). This dataset is based on Levitus 2009. They also provide proper error bars, so it is possible to calculate rate of warming for this layer for seven years between 2004-2010. It is 0.088 ± 0.076 × 10²² J/year, which is 0.077 ± 0.067 W/m2 if projected to the ocean surface (as Von Schuckmann & Le Traon do) or 0.055 ± 0.047 W/m2 if projected to the entire surface, which is certainly better, as it is directly comparable to TOA (Top of Atmosphere) radiative imbalance. Even if we suppose twice as much heat was sequestered below 700 m, it is still only ~0.17 W/m2, which is less than half of their figure for 2005-2010 & 10-1500 m (0.39 ± 0.07 W/m2). If adding a single year to the data makes such a huge difference, one can hardly say with any certainty that Von Schuckmann & Le Traon have proven that the oceans are still warming at any specific rate. BTW, for 2006-2010 the Levitus data give −0.011 ± 0.109 × 10²² J/year (for the upper 700 m), which is -0.007 ± 0.068 W/m2 globally, so it is very hard to refrain from the notion the specific starting year 2005 was cherry-picked on purpose.
    0 0
  26. #74 KR at 05:43 AM on 1 August, 2011 Hence your statement [...] is quite puzzling Would you please read first what was being said? For calculating deceleration (with error bars, −0.1 ± 0.03 mm/yr2) for GSL, I have used the entire satellite record, which spans 18.3249 years at the moment. The six year period was chosen for land based ice melt rates, relying on Rignot 2011, it seems wrongly, because their estimates are unrealistically high. Even in this case I have used their entire dataset and restricted the estimates to 2005-2010 only because Von Schuckmann & Le Traon uses that specific (too short) period in their paper. the basic physics of the greenhouse effect It is off-topic here, but basic physics predicts a much lower rate of warming. It can only be made high by playing with feedbacks, which is not basic physics.
    0 0
  27. BP - what is refreshing here is to see you that you do have faith in the Argo network. I am working from memory here so correct me if I am wrong, but I understand your position on the evidence for global warming so far to be: Surface temperature records are wrong - it underestimates the UHI effect. Glacier/ice are melting due to black carbon, not increasing temperature Satellite LT measurements are way too complicated with too many corrections needed. Cant trust the results. GSL is rising only due to melting ice from black carbon - the rest of the rise is due to placement of tide stations and of course highly unreliable satellite measurement. So, if after 15 years, say 2020, of full coverage argo network (so full sun cycle is sampled), and it shows OHC continuing to increase, will you accept that we have global warming? - or will you then decide that Argo network is flawed? In short, is there any conceivable data that would cause you to change your mind?
    0 0
  28. #65 Rob Painting at 01:19 AM on 1 August, 2011 The Rignot (2011) paper cited by BP says this: "In 2006, the Greenland and Antarctic ice sheets, experienced a combined mass loss of 475 ± 158 G t /y r , equivalent to 1.3 ± 0.4 mm/yr sea level rise." How do we get from that, to BP's 3.1mm per year? Just a bit more attention, please. Rignot also says ice loss of polar ice sheets accelerates at a rate of 36.3 ± 2 Gt/yr2, which makes 0.101 ± 0.006 mm/yr2 (and 2006 was five years ago). Also, he happens to mentions GIC (Glaciers & Ica Caps) which add another 402 ± 95 Gt/yr in 2006, that is, 1.1 ± 0.3 mm/yr. Also with acceleration of course, 11.8 ± 6 Gt/yr2 in this case, that is, 0.033 ± 0.014 mm/yr2. Go figure.
    0 0
  29. #77 scaddenp at 07:20 AM on 1 August, 2011 In short, is there any conceivable data that would cause you to change your mind? A long, continuous, global, dense and consistent database of UTH (Upper Tropospheric Humidity) would be nice. The same for cloud cover. And windspeed over the Southern ocean. Declassifying some military databases perhaps? Mining them for climate indicators?
    0 0
  30. BP "Rignot also says ice loss of polar ice sheets accelerates at a rate of 36.3 ± 2 Gt/yr2, which makes 0.101 ± 0.006 mm/yr2 (and 2006 was five years ago). Also, he happens to mentions GIC (Glaciers & Ica Caps) which add another 402 ± 95 Gt/yr in 2006, that is, 1.1 ± 0.3 mm/yr. Also with acceleration of course, 11.8 ± 6 Gt/yr2 in this case, that is, 0.033 ± 0.014 mm/yr2................Go figure Go figure indeed. At least I now know how you arrive at your erroneous calculations, so it's useful in that respect. Just how much of Rignot (2011) did you read? You committed the logical fallacy of linear extrapolation. Here's a hint: I think it's a bit rich for you to proclaim the experts wrong when you don't even understand the basics.
    0 0
  31. BP - that is intriguing list. From that I take it Argo would not cause you to change your mind. "A long, continuous, global, dense and consistent database of UTH (Upper Tropospheric Humidity) would be nice. The same for cloud cover. And windspeed over the Southern ocean." Now what robust predictions from climate theory about these data sets cause you to think that these would change your mind? And yet data sets that directly measure warming you discount?
    0 0
  32. Scaddenp @81, BP seems to be uncritically accepting the results of Paltridge et al. (2009) with regards to trends in upper-tropospheric moisture. He ought to read Dessler and Davis (2010): "In response to decadal climate fluctuations, the NCEP/NCAR reanalysis is unique in showing decreases in tropical mid and upper tropospheric specific humidity as the climate warms. All of the other reanalyses show that decadal warming is accompanied by increases in mid and upper tropospheric specific humidity." But this is going horribly OT.
    0 0
  33. Scaddenp - windspeed over the oceans at mid latitudes is important for vertical mixing of heat into the depths. And cloud cover over the Southern Hemisphere has increased in the last decade (consistent with the indirect effect of aerosols). It's detailed in the Hatzianastassiou (2011) paper I linked to at @57. The paper should published at the end of August (hopefully). Albatross - I'm wondering whether BP's humongous error in his calculations has dawned on him yet, and will he come back to apologize for slurs against Eric Rignot and co-authors, and Von Schuckmann and Le Traon?
    0 0
  34. Rob @80, It may help for Berényi Péterto look at Hansen et al. (2011), specifically Fig. 18 and the accompanying text: "The "high" estimates in Fig. 18 for Greenland and Antarctica, respectively, 281 and 176 Gt/year (360 Gt = 1 mm sea level), are from Velicogna (2009). A recent analysis (Rignot et al., 2011) compares surface mass budget studies and the gravity method, finding support for the high estimates of Velicogna (2009). The low estimate for Greenland, 104 Gt/year, is from Wu et al. (2010). The low estimate for Antarctica, 55 Gt/year is the low end of the range -105 ± 50 Gt/year of S. Luthcke et al. (private communication, 2011). The high value for melt of glaciers and small ice caps (400 Gt/year) is the estimate of Meier et al." Also see my post @64 for a summary. The claim made here by "skeptics" for a mean annual contribution of 3.1 mm/yr from ice melt between 2005 and 2010 (the period under consideration) is simply not supported in the literature, even after allowing for acceleration. It seems that what Berényi Péter has done is to estimate rate of increase in 2011 (using a start value in 2006), and assumed that that value applies each and every year from 2005-2010. Ironically Berényi Péter repeatedly accuses Rignot et al. (2011) of overestimating the ice loss, but he in fact appears to have artificially inflated their numbers. Although Berényi Péter used all the satellite data to calculate his rate of increase, it seems that he uses the rate of increase in in 2011 (he does not provide specifics or an equation, but it looks like a quadratic fit), and that value is of course in disagreement for the mean linear rate of increase obtained by all the official agencies for the same satellite GSL dataset. What he should be doing is looking at the mean rate of increase in the satellite GSL data for 2005-2010, just as the scientists at the agencies did. Finally, Berényi Péter has failed to demonstrate that the fit he decided to use (a quadratic or whatever he used) for the satellite GSL data is indeed better fit to the data than a linear fit at statistically significant level. So at the end of the day, Berényi Péter has failed to concede that he is wrong and correct his errors (despite a few people pointing this out and trying to explain to him where he went wrong), and he has failed to refute von Shuckmann and La Traon (2011). Quelle suprise. Now I am done wasting my valuable time on BP.
    0 0
  35. Rob, "and will he come back to apologize for slurs against Eric Rignot and co-authors, and Von Schuckmann and Le Traon." Doubtful. Also, I have yet to see a 'skeptics" or someone in denial about AGW concede an error or correct said error. But we can always hope that if they are operating in good faith and being true 'skeptics' in search of the truth, that they will do so (i.e, correct errors and apologize for slurs against scientists).
    0 0
  36. I asked BP what data would convince him that he was wrong which makes his choice of these parameters odd in my opinion. It would imply that these parameters are able to unequivocally show global warming whereas he denies more conventional measures. I am intrigued as to why he has picked these and also why not Argo which looks to me like the most precise instrument for global heat balance that we possess.
    0 0
  37. Of course, it should go without saying that if BP can conceive of no data that would convince him that he was wrong, then he is in boat as poptart and should be ignored. From some posts, he seems to be motivated by an abhorrence for windmills but I suspect AGW offends his political values. If so, then it would be interesting if he would comment on my comment concerning political acceptable solutions if convinced that mitigation was cheaper
    0 0
  38. You would not think that the Rignot (2011) paper would create such a controvery. People seem to accept part of the conclusion, but not others, even though the are connected. Everyone seems to agree that the Rignot paper claimed an ice mass loss of 475 +/- 95 Gt/yr. There appears to be disagreement about whether the ice mass loss is accelerating, and whether it is linear. If it is linear, 36 Gt / yr as shown in the plot by RP in @80, then the ice loss for 2011 would be 655 Gt, which equates to about 1.9 mm / yr of SLR. Rignot (2011) also mentioned that the contribution from mountain glaciers was 402 Gt/yr, with an accelerated rate of 12 Gt / yr. Albatross @84 showed that this values comes from Meier, et. al. (2007). That would amount to another 1.3 mm /yr of SLR. Eliminating the rounding, results in a 2011 SLR of 3.1mm / yr. As Albtatross pointed out in @84, this is at the high end. Wu found a total of 159 mm /yr from Greenland and Antarctica, which equates to 0.44 mm /yr of SLR. We clearly have a wide range of values. Since the values taken from Rignot (2011) exceed the recently measured SLR (The University of Colorado has acknowledged a deceleration recently from the 18-year trend), claims that these values overestimate the loss of glacial ice from Greenland and Antarctica appear justified. This is supported by the findings of Leuliette & Willis (2011) showing a SLR of 2.2 mm /yr. The question posed is whether Rignot (2011) contradicts the results of von Schuckmann and La Traon (2011). Clearly, both cannot be accurate, unless the SLR values are significantly low. Either Rignot's mass balance valus are too high, or his acceleration is in error, or von Schuckmann and La Traon are calculating too high of a steric component to SLR. Both of these calculations appear to much greater sources of error that the measured SLR values. Personally, I believe they are both too high, and am siding with the values presented by Leuliette & Willis (2011).
    0 0
  39. Albatross, KR, Rob Painting Quoting the original Rignot et al.(2011) paper thus: "Using techniques other than GRACE and MBM, the mass loss of mountain glaciers and ice caps (GIC), includin the GIC surrounding Greenland and Antarctica, has been estimated at 402 ± 95 Gt/yr in 2006, with an acceleration of 11.8 ± 6 Gt/yr2 over the last few decades [Kaser et al., 2006; Meier et al., 2007]. Our GRACE estimates and associated errors account for the leakage from the Greenland and Antarctica GIC, and, as discussed earlier, this leakage is small. The MBM estimates completely exclude the GIC. In year 2006, the total ice sheet loss was 475 ± 158 Gt/yr(regression line in Figure 2c), which is comparable or greater than the 402 ± 95 Gt/yr estimate for the GIC. More important,the acceleration in ice sheet loss of 36.3 ± 2 Gt/yr2 is three times larger than that for the GIC. If this trend continues, ice sheets will become the dominant contribution to sea level rise in the next decades, well in advance of model forecasts [Meehl et al., 2007]." Glacier & Ice Cap loss in 2006 is 402+/-95 Gt/yr Ice Sheet Loss in 2006 was 475+/-158 Gt/yr Total in 2006 : 877+/-253GT/yr Acceleration both respectively: 11.8 + 36.3 = 48.1Gt/yr2 BP at #9 then multiplied the acceleration by 5 years (2006-10) to give an approx extra 240Gt/yr. The total in 2010 was therefore 877 + 240 = 1117 Gt/yr. Equiv sea level rise assuming 360Gt/yr = 1mm/yr is therefore 1117/360 = 3.1mm/yr. Where is BP's 'colossal' error in this calculation? Now Rignot et al.(2011) might be an overestimate of land ice melt and these SLR estimates have wide error bars - however if satellite total SLR has slowed to about 2.3mm/yr then ice melt mass contributions in the 2-3mm/yr range (even Dr Trenberth quoted 2mm/yr in his Aug09 paper)means that steric rise is very small, negligible or negative. No steric rise means no heat sequestered in the oceans which as the major heat store on the planet means no warming.
    0 0
  40. ETR #89 I posted #90 at the same time as you did #89. It seems we are saying pretty much the same thing - except you probably said it better. Can you find any 'colossal' errors in BP's posts? In fact I find his contributions startling, original and well researched, and when the smoke clears from the flak BP attracts - his arguments invariably stack up.
    0 0
  41. Albatross - Thank you, that clarifies matters a great deal. Berényi took the highest available melt estimates (and not checking whether accelerations from >5 years ago held until now), the lowest available SLR estimates (very short term, statistically unsupportable), and used those singular values to claim Von Schuckmann & Le Traon (2011) was invalid. A reasonable approach might be to look at the high and low estimates for both melt and SLR, with uncertainties, and see how the Von Schuckmann paper estimates fell relative to those bounds. But that wouldn't have supported his argument. So - cherry picking numbers from both extrema of input/output values that contradict, possibly confirmation bias, no consideration of uncertainties or disagreements in the field - yet another BP kerfuffle, another waste of time.
    0 0
  42. #90 Ken Lambert at 23:58 PM on 1 August, 2011 No steric rise means no heat sequestered in the oceans which as the major heat store on the planet means no warming. Personally I don't believe much heat can be sequestered in the deep ocean. That's because its temperature is regulated. Not by simple quasi-linear feedbacks, but by a true nonlinear regulator, a thermostat. At least as long as there remains some sea ice anywhere on the planet in any season. And not even the wildest projections suggest it would disappear altogether any time soon at any conceivable level of CO2 (lets say in a million years). Simply the current configuration of continents is such it can't happen at all. Sea ice, even if it is gone for the summer, winter come returns. Now, downwelling happens where seawater is densest, that is, where its temperature is just above freezing. If there is sea ice, it must happen somewhere close to the edge, where there is still open water (to make heat exchange with the atmosphere possible). Temperature of these water masses is not determined by climate, but by the physical properties of water. If climate changes, the location of downwelling can (and does) shift, but it always finds the proper place where temperature is next to freezing. It means if by some increased mechanical forcing (probably more intense winds) a bit more heat gets mixed down to the abyss, sooner or later abyssal waters get lighter than ice-cold waters at certain locations above, so they simply switch place. It does not mean heat content of the deep ocean can't fluctuate, because characteristic reaction times of the system can be quite large. Actual location of downwelling can also change, because the thermostat only requires downwelling to happen somewhere (anywhere) along the ice edge, where salinity happens to be the highest and/or cooling is most vigorous. For example under certain circumstances downwelling in the North Atlantic can shift south or cease for a while altogether (for several centuries) which can have a huge impact on the local climate of lands bordering this ocean (Europe & Norh America), but would not influence deep ocean heat content much, because if it increases, flux of downwelling integrated over the entire surface should also increase and temperature of downwelling water is strictly constrained.
    0 0
  43. Ken, It appears that we were in the same mind frame. Thank you for the compliment. I agree with BP @93, in that the deep ocean cannot warm if the surface does not. Any warming of ocean water will simply cause that water to rise closer to the surface, and settling at that depth which corresponds to its density. BP says this quite well.
    0 0
  44. #94 Eric the Red at 01:22 AM on 2 August, 2011 I agree with BP @93, in that the deep ocean cannot warm if the surface does not. More than that. The surface may warm on average, still, temperature of the abyss is determined by the coldest patch of open water available, which is just above freezing as long as sea ice exists anywhere. Distribution of salinity may complicate the picture somewhat, but since with large scale freezing of seawater salinity of the fluid phase increases by brine exclusion, it does not make much difference.
    0 0
  45. BP, Do you realize that even a 0.1 deg C temperature increase in the 90% of the ocean that comprises the deep ocean is an immense amount of heat?
    0 0
  46. #96 Bibliovermis at 03:21 AM on 2 August, 2011 Do you realize that even a 0.1 deg C temperature increase in the 90% of the ocean that comprises the deep ocean is an immense amount of heat? Of course. But the warming we are taking about here is only 0.002°C annually, fifty times less than your 0.1°C. That's close to the accuracy/precision limit of thermometers applied by ARGO. And even if it were 0.1°C: how would it induce a more than an order of magnitude larger warming on the surface? The easier heat goes into the deep ocean, the slower the surface is able to warm up if it is heated. Think about it.
    0 0
  47. BP, Let's do a quick "back of the envelope" calculation. Ocean's Depth and Volume Revealed ocean volume: 1.332 billion cubic kilometers water heat capacity: 4.186 joule/gram °C 90% x 1.322 billion cubic kilometers x 1 million grams / cubic meter x 1 billion cubic meters / cubic kilometer x 4.186 joule/gram °C x 0.002 °C = 9.96 x 10^21 joules argument #122: Trenberth can't account for the lack of warming A global energy imbalance of 0.9 W/m^2 means the planet is accumulating 145 x 10^20 joules per year. --- The surface is warming the deep ocean, rather the deep ocean inducing the surface to warm. The easier heat goes into the deep ocean, the slower the surface is able to warm up if it is heated. Think about it. You are simultaneously presenting contradictory arguments and dismissing entire fields of research with that hand waving.
    0 0
  48. KL- "Where is BP's 'colossal' error in this calculation? Ken are you serious? Look at Rignot (2011): 2006 was a year of exceptional ice loss from Greenland and Antarctica, but look at 2007-2009, ice mass increased. So how can they be contributing to total sea level rise in those years? Go back as far as you like, there is huge year-to-year variability in the surface ice mass balance. Compare the observations to BP's calculations - he simply assumes that the ice loss that occurred in 2006 has happened every year since, and yet he was the one that referenced Rignot (2011) in the first place. And is typical of BP, he never acknowledges his mistakes, or apologizes for slurs against actual scientific experts, but simply moves on to the next bit of nit-picking. It's a shining example of the lengths even very intelligent people, like BP, will go to in order to fool themselves.
    0 0
  49. ETR - 'I agree with BP @93, in that the deep ocean cannot warm if the surface does not." The deep ocean is warming, particularly the layer between 3000-4000 mtrs deep. See Kouketsu (2011). Does that mean you agree the surface is warming?
    0 0
  50. Rob @89, Yes. It may be worse than that though. As I noted earlier @84, the "skeptics" elected to start in 2006 when they should have started in 2005. Worse still, they appear to have then decided to calculate the expected contribution in 2010 (using the 2006 start and then applying the expected annual increase) and then assumed that that 2010 value (the end point value) applies to each and every year in the 2005-2010 period. The mean contribution from ice melt to GSL for 2005-2010 (allowing for increased melt) was about 2.6 mm/yr (I don't have the numbers in front of me, so I will have to double check that). So yes an error on the order of 0.5 mm/yr when the error bars are also about 0.5 mm/yr is significant. But maybe Ken is coming around. He was adamant @63 that: "so therefore steric rise must be negative (-1.1mm/yr if isostatic rebound is included)." Now he is saying @89 that: "means that steric rise is very small, negligible or negative." So perhaps he is finally getting the point. The point being that 6 years is simply too short a period to be making grand assertions that "the oceans are cooling", or the science of AGW has major inconsistencies or that the centennial-scale warming is 0.2 C. Moreover, as shown by Katsman and Voldenborgh (2011) such slowdowns (or even periods of cooling) are not fairly common. The fact the the rate heat is accumulating in the oceans may have decreased in this time is not equivalent to cooling, they are just accumulating heat at a slower pace, probably in response to the dramatic increase in aerosol loading and the prolonged solar minimum. What also makes me a little nervous with these calculations is that a zero lag is assumed, and we know that there are lags in the system. So that too complicates matters. You are correct Rob, this thread is yet another example of the tricks of the trade used by "skeptics" and those in denial about AGW.
    0 0

Prev  1  2  3  Next

You need to be logged in to post a comment. Login via the left margin or if you're new, register here.


The Consensus Project Website

THE ESCALATOR

(free to republish)


© Copyright 2024 John Cook
Home | Translations | About Us | Privacy | Contact Us