Climate Science Glossary

Term Lookup

Enter a term in the search box to find its definition.

Settings

Use the controls in the far right panel to increase or decrease the number of terms automatically displayed (or to completely turn that feature off).

Term Lookup

Settings


All IPCC definitions taken from Climate Change 2007: The Physical Science Basis. Working Group I Contribution to the Fourth Assessment Report of the Intergovernmental Panel on Climate Change, Annex I, Glossary, pp. 941-954. Cambridge University Press.

Home Arguments Software Resources Comments The Consensus Project Translations About Support

Bluesky Facebook LinkedIn Mastodon MeWe

Twitter YouTube RSS Posts RSS Comments Email Subscribe


Climate's changed before
It's the sun
It's not bad
There is no consensus
It's cooling
Models are unreliable
Temp record is unreliable
Animals and plants can adapt
It hasn't warmed since 1998
Antarctica is gaining ice
View All Arguments...


Username
Password
New? Register here
Forgot your password?

Latest Posts

Archives

Why Wasn't The Hottest Decade Hotter?

Posted on 15 July 2011 by Rob Painting

After a rapid rise in global surface air temperatures during the late 1970s to 1990s, the rate of global warming in the last decade or so has slowed. A recent scientific paper, Kaufmann (2011), suggests that once relevant factors are taken into consideration, the observed slow-down from 1998-2008 is in line with scientific understanding of the climate. 

Rapid industrialization in East Asia, particularly China, led to a big jump in sunlight-reflecting sulfate aerosol pollution, mainly through coal burning. This additional reflective aerosol pollution sheilded the Earth from greater warming, but is only a temporary reprieve. Sulfates have a short lifetime in the atmsophere, and when East Asia stops burning so much coal, the Earth is going to get an extra nudge in warming. 

20th to 21st Century global warming
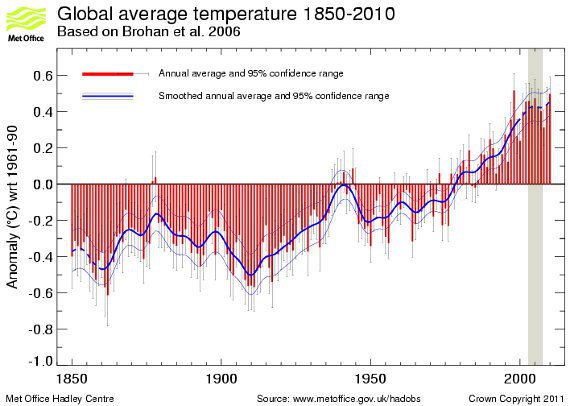
Figure 1 - Hadley Centre temperature record (HADCRUT3).The red bars show the global annual average near-surface temperature anomalies from 1850 to 2009. The error bars show the 95% uncertainty range on the annual averages. The thick blue line shows the annual values smoothed. Vertical banded column indicates the 'slow-down' period.

The Hadley Centre dataset shows less global warming, compared to other records, primarily because it excludes measuring the Polar regions where warming is happening much faster than the global average. However the Hadley data still shows the decade 2000-2009 as the warmest on record. Looking at the above graph, it's clear that, despite the long-term warming trend, there are a number of short-term periods where global temperature shows little or no warming. So another slow-down in warming is hardly a novel observation.  

Why the Pause?

To identify what may have led to this slow-down, Kaufmann (2011) use a statistical model to compare natural and human-caused forcings. They find that the increase in greenhouse gases was exceeded by an even greater increase in sunlight-reflecting sulfate aerosols, which originate from the rapid industrialization of China.  Chinese coal-burning in particular doubled in the 4 years from 2003-2007, and makes up some 77% of the 26% global increase over that time.

The result of the modeling is that the cooling effect of sulfates nearly cancels out the warming effect of greenhouse gases, allowing natural processes to control the climate. In this interval, the small drop in sunlight reaching the Earth as part of the natural solar cycle, coupled with more episodes of La Niña (natural globally cool episodes) leads to a much smaller push in the direction of warming.  
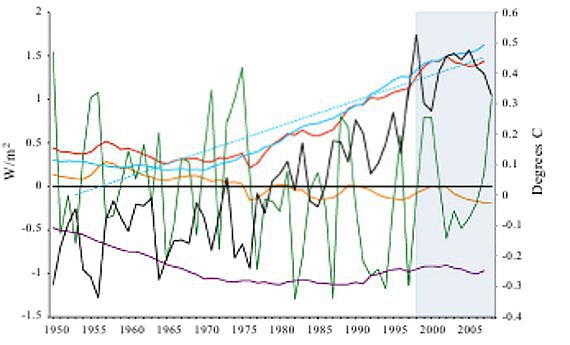
Figure 2 - Radiative forcing of human-caused sulfur emissions (purple line), net human-caused forcing (blue line), linear estimate of net human-caused forcing (blue dash), total radiative forcing (red line), radiative forcing of solar insolation (orange line), and observed temperature (black). The Southern Oscillation Index (divided by 10) is given in green. SOI data are presented as annual mean sea level pressure anomalies at Tahiti and Darwin. Post-1998 period of interest (highlighted gray).  From Kaufmann (2011).

Kaufmann (2011) looks at other factors, such as Black Carbon (soot), and possible cooling caused by a reduction in water vapor in the stratosphere, however these are found to have a negligible effect on global temperature. 

Another look at sulfate emissions

Smith (2011) look at human sulfate emissions from 1850-2005, based on estimates of production and consumption. They find a drop in the last part of the 20th century, but from 2000 to 2005 there is a big increase, largely from East Asia (China) and international shipping. So, this study is pretty much in agreement with the emissions data from Kaufman (2011).
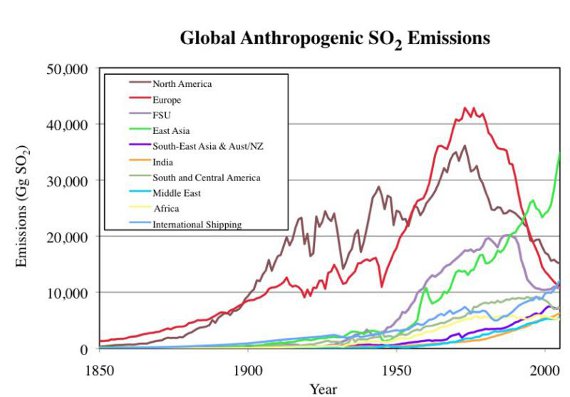
Figure 3 - Global sulfur dioxide emissions by region (North America = USA+Canada; East Asia = Japan, China, and South Korea). From Smith (2011).

How do East Asian emissions become global?

Being based on a statistical model, rather than a climate model, Kaufmann 2011 can't tell us how a dramatic increase in East Asian sulfate pollution can have such a global effect; however, there has been earlier work addressing this question.

Rasch (2000) use the NCAR climate model to quantify the effect of reflective sulfate aerosols based on their location, or source. Those emissions which come from the Asian region are quite different from those that stem from pollution in North America and Western Europe. Unlike those regions, emissions from Asia are able to reach the upper atmosphere and spread out over both hemispheres, and thereby have a greater global impact. 

Manktelow (2009) looked not only at the sulfate aerosols themselves, but also the impact they have on cloud formation. Their model reveals that both North America and East Asia have an impact 3 to 4 times greater than Europe because local weather patterns are able to loft sulfates up into the upper atmosphere, affecting cloud-forming processes. Once again demonstrating that not all sulfate emissions are created equal; Asia in particular packs a greater wallop. 

First the good news.......then the bad

If the findings of Kaufmann (2011) are confirmed by other research, and it is accepted that East Asian sulfate pollution shielded the Earth from greater warming during 1998-2008, this is both good and bad news.  It's good that the planet did not suffer greater warming, but bad because this effect is only temporary.

Sulfate aerosols have a short lifetime in the atmosphere, often measured in weeks and months, but up to 3 years if they reach the upper atmosphere. In contrast, greenhouse gases, especially CO2, will  linger for centuries everywhere in the atmosphere. As East Asia begins to install smokestack scrubbers to reduce sulphate pollution, and they need to for reasons such as health and acid rain , then the cooling effect of those reflective aerosols will be lost. Once that happens we should observe a noticeable increase in global warming.  

0 0

Printable Version  |  Link to this page

Comments

Prev  1  2  

Comments 51 to 56 out of 56:

  1. I wish I had more to add, but almost all my thoughts have been covered by others. Sphaerica, FTIW, I share your fear at #16. If you view all the decade or less ups and downs as short-term deviations from a mean caused by short-term drivers, and the mean is moving upward, driven by the longer term increase in CO2, (A bit more than linearly, Eric, as has been discussed before, Monckton Myth #3: Linear Warming.), then, yes, once the short-term drivers have subsided, there will be a spike to return to the mean. Though, I've all but given up on any turn of events, like repeated record losses of Arctic ice, serving as a wake-up call or stunning skeptics into accepting the reality of our situation.
    0 0
  2. Bibliovermis, See Rob's plot of the 5-year moving average. All the subtleties are lost on longer term averaging. The recent flattening may just be a repeat of the previous three.
    0 0
  3. Regarding Manktelow (2009), I would guess that there would be obfuscation of differences by latitude. Not only would circulation patterns, including Hadley cells, create differences in the altitudes reached by the particles, where aerosols in the the lower lats reach higher altitudes and have longer residence time, but lower latitudes receive more watts per square meter than higher latitudes.
    0 0
  4. Rob @ 48: Thanks for the clarification. I suspect I made an error of granularity regarding decadal anomaly vs annual.
    0 0
  5. Eric the Red, The goalpost has now been moved into the straw field. One's subtlety is another's well known & understood physical effect. Yes, the solar cycle does affect the climate. Using a 5 year moving average, the hottest 30 5-year-periods are the past 30; 1941-1945 is #31. The average rate of change over those 30 periods is +1.7. The last 10 periods have been the Top Ten; 1996-2000 is #12. Period Endpoint: Anomaly (change) 2007: 55.7 (+0.4) 2010: 55.5 (+0.1) 2009: 55.4 (+2.0) 2006: 55.3 (+1.5) 2005: 53.8 (+5.9) 2008: 53.4 (-2.3) 2004: 47.9 (+3.2) 2002: 44.9 (+3.4) 2003: 44.7 (-0.2) 2001: 41.5 (+3.8) 5 of those top ten had an above average change.
    0 0
  6. Bibliovermis, I think you are getting closer. The average rate of change is 1.7 over the past 30 years (I assume your math is correct). The average rate of change from 2001-2005 is 3.2, the average rate of change from 2006-2010 is 0.3. See the difference? That is what is evident in Rob's plot. Yes, it all may be due to solar effects. If so, then warming will resume at its earlier rate when the sun picks up again.
    0 0
  7. Chris G - "Though, I've all but given up on any turn of events, like repeated record losses of Arctic ice, serving as a wake-up call or stunning skeptics into accepting the reality of our situation." Me too. The media narrative will be on nations scrambling to exploit the Arctic's natural resources, with no mention of how it came to be that way.
    0 0
  8. Eric the Red, what you have failed to show is that the flattening is in anyway significant. That seems highly unlikely given Tamino's graph shown on post post 46.
    0 0
  9. Along the lines of #16 and #51, more decadal variability in global temperature presents deniers with more opportunities to put forth visually-appealing "step change" nonsense. Bob Carter Does his Business
    0 0
  10. Those who like moving averages (I'm one, if they are done right) should remember that when you have a rising trend, a moving average carried out near the right hand end of the time series will tend to underestimate the underlying curve. That's because the moving average - no matter how you calculate it - cannot include the higher but currently non-existent values for times in the future. So the moving average tends to level off, or at least underestimate, a rising trend near the end of the data series. To smooth the last decade's worth of data - with an eye towards trying to establish a flatter trend - then, requires a smoothing window much shorter than a decade. But then it won't do much smoothing. Conversely, a 20 or 40 year window for a moving average won't respond much to changes in the last decade of data, except for some underestimation of a rising trend. So neither a short nor a long window can really speak to the possibility of a leveling off for the last decade. But it's possible that a comparison of short vs long averaging windows could detect a change in the behavior. I haven't tried this myself so far, but in the past I've read papers about detecting maneuvers of aircraft by comparing long and short time window averages of their radar signatures. This is possible because a maneuver changes the statistics of the (noisy) radar time series. IIRC (and it was a long time ago), you look at the variances of the data in the long and short windows. Maybe a similar technique could identify real changes in the temperature behavior. That would be interesting.
    0 0
  11. The attempt to relate the claimed slower rate of warming in the 00's to the solar cycle has been debunked repeatedly. It can be statistically manipulated into apparent existence (Ricky Lintzen had the biggest float in that parade). Trouble is, these statistical evaluations don't match the observational evidence - heat-signature extremes and anomalies. There's a good scientific case for a warming booster from the aerosol decline in 90s (bye-bye USSR), and a masking effect from the ABC in the 00's ... but the notion that these 'x-year moving averages' from source subset du jour is 'the warming trend' is lame. Most of them would be altered if they didn't support the pre-determined conclusion.
    0 0
  12. It's been interesting reading the comments. I thought the "skeptics" were the only ones who 'can't see the woods for the trees', apparently not so. Some "warmists" are gonna have conniptions reading the comments from studies I'm writing about now!
    0 0
  13. Kevin Trenberth led the IPCC group that produced this chart:

    He says: "We used 25 years in Chapter 3 of IPCC as the lowest trend we provided that was meaningful…."

    All the denier noise about "trends" with shorter time periods is much ado about nothing.
    0 0
    Moderator Response: [RH] Rescaled image to 450.
  14. David Lewis - The linear trend in the IPCC graph totally obscures the recent 'slow-down'. Again - the point of the article is not that long-term global warming is happening (shucks, we know that), it's examining short-term variability.
    0 0
  15. The way Kaufmann et.al. express themselves in their first paragraph indicates they are attempting to counter what deniers are saying about the period between 1998 and 2008. Deniers and non specialists taken in by them who are foaming over about that time period aren't debating fine points of how to come up with better and more accurate explanations other than the old standbys of natural variability and/or its something we don't know. The deniers are using this time period to question the entire thing - whether global warming is happening at all. Now if what you wanted to do was to counter ignorant arguments that a certain ten year trend "proves" whatever, you'd start by laying out what scientists are generally agreed upon, which I take it is the IPCC AR4 chart produced by the group led by Trenberth, which is why I posted it in comment #63. I.e. the shortest meaningful time period the global warming "signal" is held to be seen clearly was taken by the IPCC AR4 to be 25 years. Trenberth reaffirms this as of late 2010. Obviously, I, or far less likely, Trenberth, or even the IPCC AR4 which after all had a cutoff date for data many years ago now, might not have a clue. I would defer to Kaufmann et.al. on what a meaningful time period generally accepted by climatologists is. But they don't bring up what the IPCC says, or anyone else, and they do not say what they believe, except they have a theory they suggest throws some light on the period in question which they publish seeking comment and recognition for. Fine, but they aren't restricting themselves to discussion of how to throw some light on what people have had to call natural variability and/or something we don't understand in the past. Their paper was produced to address the deniers and their gibberish, as they explained in their first paragraph. Kaufmann et.al. address alternate explanations, i.e. for instance, they say they don't agree with Solomon et.al., i.e. Solomon's suggestion in Contributions of stratospheric water vapour to decadal changes in the rate of global warming. They are offering their own theory to explain, as you say, "short term variability". But I can't forget their introductory paragraph where they told me they did this research to explain why a period with start and end points chosen by deniers that is far shorter than the minimum the IPCC found was generally agreed to be a meaningful period to look at this signal actually has meaning they can explain. Why play on the denier's playing field according to their rules? Just because deniers are making a big deal out of one ten year period that they say contradicts everything climatologists have ever said or will say, why do Kaufmann et.al. have to try to explain that ten year period without even mentioning that by the way, the IPCC used 25 years as the minimum meaningful period? What Hansen did in Global Surface Temperature Change was bring up and dismiss the deniers. He wrote: "of course it is possible to find almost any trend for a limited period via judicious choice of start and end dates". Then he took on Solomon et.al, which he called a "more moderate assessment" of the period in question by comparison with denier gibberish. He quoted Solomon: "the trend in global surface temperature has been nearly flat since the late 1990s despite continuing increases in the forcing due to the sum of the well-mixed greenhouse gases". Then he immediately and directly contradicted Solomon et.al. with "[this] is not supported by our data." And then he explained his groups latest examination of the long term trend data: "On the contrary, we conclude that there has been no reduction in the global warming trend of 0.15-0.20 degrees C per decade that began in the late 1970s". If you are discussing short term variability, then make it clear. The deniers aren't discussing that topic.
    0 0
  16. Just a bit of serendipity, wrt Chinese aerosols, and moving from the scienmce to something more anecdotal. My sunday paper today had an atricle about growing Chinese tourism to Australia, how they aren't all doing the packaged tour group thing. On man, a tour guide called Mr Zeng commented on what most strikes chinese tourists to Oz. 1. The space. That they can go to places where there are no people. That outside peak hour you can actually get a seat on any train or bus 2. How blue the sky is. It amazes them. Many young chinese have never seen a blue sky. For them, the sky is something that is always 'foggy'. I can speak from personal experience, having spent several years travelling in China on business, the air is always hazy or dirty in some way. Everywhere. You can fly from one end of the country to another and you will always see haze. When the Chinese are able to get their act together (and they will - the West underestimates the capacity of the Chinese at their peril) the change in warming could be very interesting.
    0 0
  17. David Lewis - "If you are discussing short term variability, then make it clear. The deniers aren't discussing that topic." Did you miss this bit from the above post? "Looking at the above graph, it's clear that, despite the long-term warming trend, there are a number of short-term periods where global temperature shows little or no warming. So another slow-down in warming is hardly a novel observation." And is the title not a bit of a gimme? Like I alluded to earlier, 'warmist' comments are disappointing. Break free from your antagonistic tendencies and look at the evidence. For instance in the recent Trenberth thread you referenced James Hansen's lecture. Note what he says at about 44 mins. He says that the planetary energy imbalance flattened out. This is clearly labelled in figure 1 of his recent paper Earth's Energy Imbalance and Implications Hansen seems to largely agree with the findings of Kaufmann (2011) - both suggest that the aerosol forcing increased over the period, allowing natural processes (such as decreased solar activity) to dominate. Want to see the upper ocean (700mtrs) heat content data?
    0 0
  18. What we see here is another tragedy of the deniers hijacking the discussion. There is a difference between discussing a reduced energy imbalance due to the solar minimum and the goalpost-moving "global warming has slowed / stopped / is now global cooling" tripe.
    0 0
  19. I'm sorry for the antagonistic tone. I've been struggling with the ideas put forward by Hansen for some time. But I studied Trenberth some months ago and now when I read Kaufmann the same issue came to my mind. I am trying to write a piece about the point also expressed here by "barry" in comment #10, i.e. "the mainstream has consistently said that a decade is too short to establish a meaningful (statistically significant) trend, so when the article [your post] heads up with; "the rate of global warming has slowed" it looks like we've finally admitted what the skeptics have been saying.... So I forcefully express my agreement with comment 10 using my own argument, and I agree it sounds very antagonistic. I spent some more time with the Kaufmann piece - I tried to read the Supporting Appendix but it is too technical for me to get very far. They did use GISTEMP data and run their simulations - they say so in the appendix. I wonder why they restricted all mention of GISTEMP to the Supporting Appendix and stayed with the Hadcrut3 1998 2008 data which they referenced in their main article. Its like they wanted to use the dataset most in line with their opening sentence "data for global surface temperature indicate little warming between 1998 and 2008". Re: you say Hadcrut3 "shows less global warming" because it "excludes measuring the Polar regions". Two points: first, its a global average surface temperature chart. If people use words like "it shows less global warming" they know what they mean and I know what they mean but there is room for confusion. I.e. going back to that quote from Trenberth: "the anthropogenic global warming signature is not large enough to overwhelm natural variability and so the trend from increased GHGs is only clear on time scales of 25 or more years. We used 25 years in Chapter 3 of IPCC as the lowest trend we provided that was meaningful…" So if the global warming signal can't be seen in a ten year dataset, that HadCrut3 dataset can't show less global warming. Trenberth's stolen emails were distorted by deniers exploiting a similar imprecise use of words. Second, Hadcrut doesn't "measure" the polar regions, but neither does anyone else. Hadley Center explains: "There are very few observations in the Arctic and Antarctic. GISS attempts to estimate temperatures in these areas, HadCRUT3 does not. This is the major source of difference between the analyses, which can be seen if, instead of a global average, one takes the average temperature anomaly between 60S and 60N. Over this slightly smaller area, the GISS and HadCRUT3 analyses give very similar results." So GISS is making an educated guess, it seems to me to be a better way short of taking the measurements, but the fact is they aren't taking measurements. I went back to the Hansen Lecture around minute 44 as you suggested. He points to a chart

    he calls it "the sum of the GHG and the aerosols, where the aerosols have been specified to be that which gives the agreement with the medium response function and what you see is that these two, the two principal forcings, greenhouse gases and aerosols cause this imbalance, [and] they cause the temperature change which is the major part of the observed temperature change, but they also cause this energy imbalance, which flattened out"

    "because of that decrease in the greenhouse gas growth rate." By "decrease in the GHG growth rate", I'm thinking he means this chart from Perceptions of Climate Change:

    which he used to show that the rate of increase in total GHG is actually less now than the peak rate of the mid 1980s. Back to Hansen: "But because it flattened out like that that allows small forcings to have a noticeable effect." So Kaufmann says Chinese aerosols masked the total global GHG forcing power for a while allowing smaller forcings to have a noticeable effect, and Hansen points to a lesser rate of increase in the total of GHG, if Hansen is talking about the same thing when he points to this flattening on this graph saying this allows the smaller forcings to have a noticeable effect. He finishes the talk with something I don't understand about Pinatubo: "And one of the interesting effects is the volcanoes. The Pinatubo aerosols gave us this big negative forcing and a cooling factor in 1991, and that only lasted for a couple of years. You wouldn't think it would be affecting things in the last ten years, but actually it does. Its because after the aerosols disappear, they're no longer influencing the amount of sunlight absorbed by the planet, but they're still influencing the heat radiation to space because they caused a cooling of the ocean, and therefore you continue to get this rebound effect after the volcanic aerosols are gone and that then causes a decline in the radiation imbalance in the last decade. And the other thing the solar irradiance…. ….So I think that the planetary imbalance is about 5 or 6 tenths of a watt. And if it's half a watt then in order to restore planetary balance and stabilize climate you'd have to reduce CO2 to 360 ppm other things being equal. And if its 3/4 of a watt, and I think averaged over a solar cycle it might be more like 3/4 of a watt, if that's the correct number then you'd have to reduce to 345 ppm. … In order to understand this we would like to have a model that really simulated this correctly. And I think that requires an ocean model that mixes ocean water and heat more realistically. That's what we're hoping this collaboration with …. Maybe we can get a more realistic ocean, if in fact I'm right that our ocean is mixing too much, but anyway, that's the story …." Kaufmann et.al. supporting appendix contained a reference to work at Princeton by Yuan Xu regarding the trend in Chinese SO2 emissions:

    The Chinese SO2 may have peaked around 2006. Their total coal generation is slated to double by 2035 or so it seems, but they are replacing inefficient plants with more efficient ones even as they expand their overall fleet, while applying sulphur mitigation measures at fantastic rates to lower their emissions. Here's three equal sized areas, in the US midwest, Europe near Italy, and China around Beijing, data by Ozone Monitoring Instrument Group which is detecting SO2 concentration averaged 2005 - 2007 the peak of Chinese emissions, keep in mind that tiny dot in Sicily is the Mt Etna volcano, then look at China

    [Source]
    0 0
    Moderator Response: [RH] Rescaled image to 450 and added link to source image. Try to limit your images to 450 because it breaks the page formatting when you use larger images. ...Thx.
  20. David, Nice post. I agree that short term changes in temperatures have been given too much attention, and may not be indicative of longer term trends. However, that does not mean that we should not investigate the reason for these short term changes and determine whether they are due to aerosols, volcanic eruptions, oceanic decadal cycles, solar cylces, or any other cause. Better understanding of the variables which influence climate will only lead to better understanding of the climate as a whole. IMO, too many people are making too much of the difference between the GISS and CRU datasets. While GISS may be more accurate, it has a higher uncertainty due to the estimate of polar temperatures. Consequently, I prefer to use the CRU dataset for analysis, acknowledging that I may be substituting accuracy for precision. Either way, the trends are similar. We should also not neglect longer term influences when determing temperature trends. As pointed out in the previous graph, the 25-year temperature trend was the highest. However, was it the most accurate? The 15-year CRU temperature trend is similar to the 130-year trend (~0.06C / decade). While many of the arguments put forth recently are plausible explanations for the observations, we do not know yet whether they have any significant contribution at all. That said, I am leaning towards aerosols at the moment; all aerosols, which includes your volcanic arguement also.
    0 0
  21. I don't say short term changes in the average global surface temperature chart have been given too much attention. The discussion in the literature shows where some of the attention of some of the best scientists is, i.e. Solomon, Hansen, Trenberth, now Kaufmann, etc., and I don't have a comment anyone should pay attention to about whatever those people want to devote some of their attention to. What I'm saying is many non-specialists have misunderstood what the significance of this discussion is, and there is a way to address part of that, which is to be very clear when discussing the issue. Lovelock for instance, after he read Trenberth's original "missing energy" Perspectives piece in Science, decided "something unknown is slowing global warming". He writes Stewart Brand (the Whole Earth Catalog guy) about it, and Brand changes his standard talk as he tours his book Ecopragmatism and started to say maybe "nothing" would happen in the future as a result of the accumulating GHGs, mentioning the possibility that some mysterious force might counteract it all. Both Brand and Lovelock started touting a book (The Climate Caper) which has a Foreword by Lord Monckton. Brand calls the author, Paltridge, a "sensible skeptic" (Paltridge is just a standard issue, preposterous denier who says things like the IPCC is the worst thing that has happened to science itself in the last several hundred years), and Lovelock complains to Brand he can't understand why his climatologist friends are shunning him now that he is "consorting" with skeptics (i.e. Paltridge). All this, because Lovelock misunderstood what it meant when Trenberth expressed his frustration because the scientific community can't nail down what he's calling his "missing energy" given the "revolution" in observational data that is becoming available. As scientists zero in on being able to explain a lot more than they used to be able to do, instead of resorting to having to say things like its "natural variability" or they don't know, their discussion of how best to proceed in the quest to understand is leaving more room than necessary for non-specialists (especially those who don't understand how little value is in what deniers say) to start giving credence to the idea that climate science is getting less certain about basics such as its far past time to do something about the accumulating GHGs. Solomon, in Contributions of stratospheric water vapor to decadal changes in the rate of global warming for instance, wrote about the last decade saying “the trend in global surface temperature has been nearly flat since the late 1990s despite continuing increases in the forcing due to the sum of the well‐mixed greenhouse gases", Hansen then uses that quote to set up his announcement in Global Surface Temperature Change that what Solomon writes ”is not supported by our data. On the contrary, we conclude that there has been no reduction in the global warming trend of 0.15°C– 0.20°C per decade" which would lead anyone to believe that Hansen thought Solomon was saying there had been a reduction in the global warming signal. Maybe she does think this, but it isn't clear to me. What's clear to me is people are talking about short term trends and long term trends in confusing ways. Regarding short term trends, if a ten year trend was meaningful in the sense Trenberth is using, a lot of ten year trends randomly selected out of the dataset would tend to agree on the big picture, i.e. an accelerating long term warming trend, which they don't. If you carefully select the start and end date you can get a ten year trend to show just about whatever you want, a fact the deniers are exploiting. Hansen points to aerosols repeatedly with increasing emphasis - eg his May 5 2011 Earth's Energy Imbalance and Implications paper's Abstract, sixth sentence, "Continued failure to quantify the specific origins of this large forcing is untenable, as knowledge of changing aerosol effects is needed to understand future climate change". He compares how likely it is that anyone could be accurate, who for modelling purposes selects a number or range to represent aerosol forcing, by saying that asking his grandchildren, one of whom didn't understand that numbers could be greater than 1, is as grounded in the scientific method as what anyone else is doing.
    0 0
  22. Thanks Rob for this article, even if I'm still not totally convinced about the relevance of the choice of the niño-flawed 1998-2008 decade limits as we talked before, which might finally be more blunderer in a certain way than deliberate. #69, David Lewis : "Hansen finishes the talk with something I don't understand about Pinatubo: "And one of the interesting effects is the volcanoes. The Pinatubo aerosols gave us this big negative forcing and a cooling factor in 1991, and that only lasted for a couple of years. You wouldn't think it would be affecting things in the last ten years, but actually it does. Its because after the aerosols disappear, they're no longer influencing the amount of sunlight absorbed by the planet, but they're still influencing the heat radiation to space because they caused a cooling of the ocean, and therefore you continue to get this rebound effect after the volcanic aerosols are gone and that then causes a decline in the radiation imbalance in the last decade" This new study may provide a subsidiary volcanic explanation to the Pinatubo's : "Major influence of tropical volcanic eruptions on the stratospheric aerosol layer during the last decade" (Vernier et al, 2011). But what are these minor tropical volcanic eruptions causing an important source of stratospheric aerosols ? Were they proved to have been more active during this last decade ?
    0 0
  23. Papy - thanks for the Vernier (2011) abstract link. I'll see if I can track down a copy of the paper - it might be worth a post.
    0 0
  24. If so and to complete, there seems to be a complementary study in my french source of the "Institut Pierre Simon Laplace" : "The persistently variable « background » stratospheric aerosol layer and global climate change" (Solomon et al, 2011).
    0 0
  25. Papy - ta, already have that Solomon (2011) paper. Seems that a clutch of papers on aerosols have been published very recently. Myself and a couple of other authors are discussing them at the moment. Should have some posts on them shortly. What specifically interests me is what effect (if any) the Asian (& volcanic) aerosols may have had on ENSO, and the uptake of heat into the oceans.
    0 0
  26. The Global Volcanism Program has a page "Has volcanic activity been increasing?" They say "we don't think so". A dramatic increase in volcanoes per year has been reported for centuries apparently, but they say this is due to more reporters rather than more volcanoes.
    0 0
  27. David Lewis - your link doesn't enlighten us as to the degree of tropical volcanism. This is important because nearer to the equator and the plumes can reach high up into the stratosphere. That's not the case for volcanoes at high latitudes. Furthermore the studies mentioned actually go into a lot more detail, such as satellite observations.
    0 0
  28. The Solomon paper is suggesting that stratospheric aerosols are persistently variable, and assessments such as UNEP, something Solomon was one of ten lead authors of, affirm that: "there is no long term systematic global monitoring system to document long term future changes in stratospheric aerosols that could affect ozone and climate" so they are basically saying this is a factor models will have to take into account if they want to increase the possibility they might get accurate one day, based on impressions of the data they could get their hands on. But with data assessed to be like this, what would they suggest a modeller do? Toss a coin? Maybe that's why Hansen just asked his grandchildren.... I thought if the volcano people didn't think there was an increase in global volcanism it might mean they don't think there has been an increase in tropical volcanism. The Vernier paper abstract suggests an increase in volcanism but doesn't say increased compared to anything in particular. They mention the Brewer-Dobson circulation which might mean they feel they've observed something new there - The UNEP assessment discusses this circulation: "the Brewer Dobson circulation is not a measureable quantity and hence trends... are inferred...." "climate model simulations consistently predict an acceleration of the Brewer-Dobson circulation in response to increasing greenhouse gases..." although not predicted to be detectable yet "Certainly any change in the strength of the Brewer-Dobson circulation would alter the thermal structure of the stratosphere." It might be that volcanoes of a size that weren't thought to be powerful enough to be injecting material directly into the stratosphere, because of a misunderstanding of how Brewer-Dobson circulation works, or because it has changed, are suggested to be injecting material by Vernier. The Brewer-Dobson circulation is the way air circulates from the troposphere to the stratosphere and back....
    0 0
  29. David, note this bit from the Solomon (2011) paper "Near-global satellite aerosol data imply a negative radiative forcing due to stratospheric aerosol changes over this period of about –0.1 W/m2, reducing the recent global warming that would otherwise have occurred." Ties in with the title of my post very well methinks. Of course, they're referring to volcanic stratospheric aerosols, a separate issue. Certainly interesting stuff.
    0 0
  30. NOAA put that -0.1 W/m2 differently, by saying it amounts to 1/3 of the increased power of CO2 added since 2000, which has been offset by this stratospheric aerosol effect Solomon et al are suggesting. Last year NOAA said Solomon was looking at water vapor which she had also observed to be variable. She had calculated an effect that "caused surface temperatures to increase about 25 percent more slowly than they would have otherwise", since 2000. The paper. is the same one mentioned in previous comments. "Why Wasn't the Hottest Decade Hotter" is a good title for everything like this.
    0 0
  31. I've made a spanish version of the first graph for my blog. http://i.imgur.com/Vs9ls.jpg
    0 0
  32. #50 and others re solar activity (related to 10.7cm solar radio flux): Would anyone care to comment on these NASA predictions? source

    0 0
    Moderator Response: [Dikran Marsupial] Please limit the width of images to (say) 450 pixels (I have fixed this post already). Secondly, link only posts are discouraged; don't simply post an image an ask for comments, instead explain why you think the image is interesting and explain why comments would be informative.
  33. (continued) My feeling is that there may be something to be read into (a) the current longer cycle (max June 2013) and (b) an apparent underlying 900 to 1000 year cyclic trend in sunspot activity rising from the Maunder minimum in the Little Ice Age. The fact that the 2021 minimum is also predicted to be very low might indicate a long term downturn at least in solar activity.
    0 0
    Moderator Response: [Dikran Marsupial] (a) the solar cycle length - climate relationship is debunked here. (b) reliable sunspot data doesn't go back far enough to reliably detect a 900-1000 year cycle. Also if you look at temperature data that has the effects of ENSO and volcanic activity taken out (see e.g. here) there is very little sign that the solar minimum has had much of an effect on temperatures. The 11-year solar cycle is barely detectable in temperature data, the change in solar forcing is really very small. Please do yourself a favour and go through the answers to common skeptic arguments listed to the left of the page.
  34. I do tend to agree. I was just interested to see what others thought about it. I guess the various institutes in 9 countries are wasting their time and money with the CLOUD experiment. People see what looks like half a 900 year cycle just because the climate was cold during the Maunder Minimum and then both increased till 2000.
    0 0
    Moderator Response: [Dikran Marsupial] As I said, if you are interested to see what other people think about some subject, why not just read the relvant articles and responses first. The EU isn't wasting money on CLOUD; it is in the nature of research that some projects end up confirming an hypothesis and some end up rejecting them. If you know the outcome before performing the experiment it isn't research.

    Secondly seeing what looks like half a 900 year cycle is "climastrology". Human beings are excellent at spotting patterns in data where no pattern actually exists, especially when it fits their preconceived opinions. Next time if you want to talk about cycles, then at least present a statistically sound demonstration that such a cycle actually exists.
  35. "People see what looks like half a 900 year cycle just because the climate was cold during the Maunder Minimum and then both increased till 2000" Sunspot cycles have been getting weaker for the last 40-50 years. At best there's been no trend in solar irradiance during that time; it's probably declined a very small amount. So no, "both" have not been increasing till 2000. And no, warming didn't end in 2000 either. We just had the warmest decade on record (and easily, too), according to all data sets. The oceans are still gaining heat. As for seeing a 900 year cycle in 400 years of data, I don't think there's much to say other than it's sheer folly.
    0 0
  36. As I said, I tend to agree. I have not at any stage taken a position that solar winds cause climate change. I am just saying that it is one of many hypotheses that (other) people do seem to keep putting forward, and I was genuinely interested to see if there was anyone in this forum who held to such views. If there had been, then I too would have pointed out that, even where there have been attempts to reconstruct sunspot data for thousands of years back, there is (as best I can ascertain) no statistically significant information either for or against correlation.
    0 0
    Moderator Response: [Dikran Marsupial] There is a word for that kind of behaviour, namely "trolling". If you were genuinely interested in opinions here on the solar cycle length - climate correlation you would have found the relevant article, read it and the responses, and added a comment at the end saying that you felt that there was no statistical evidence for or against. Do not do this again. If you want to discuss an issue, do so directly, on an appropriate thread and state your own position clearly and unambiguously in your initial post.
  37. DougC#86: "there is (as best I can ascertain) no statistically significant information either for or against correlation. " Look harder, there's plenty of information against. See the 'It's cosmic rays' thread.
    0 0

Prev  1  2  

You need to be logged in to post a comment. Login via the left margin or if you're new, register here.


The Consensus Project Website

THE ESCALATOR

(free to republish)


© Copyright 2024 John Cook
Home | Translations | About Us | Privacy | Contact Us