Climate Science Glossary

Term Lookup

Enter a term in the search box to find its definition.

Settings

Use the controls in the far right panel to increase or decrease the number of terms automatically displayed (or to completely turn that feature off).

Term Lookup

Settings


All IPCC definitions taken from Climate Change 2007: The Physical Science Basis. Working Group I Contribution to the Fourth Assessment Report of the Intergovernmental Panel on Climate Change, Annex I, Glossary, pp. 941-954. Cambridge University Press.

Home Arguments Software Resources Comments The Consensus Project Translations About Support

Twitter Facebook YouTube Mastodon MeWe

RSS Posts RSS Comments Email Subscribe


Climate's changed before
It's the sun
It's not bad
There is no consensus
It's cooling
Models are unreliable
Temp record is unreliable
Animals and plants can adapt
It hasn't warmed since 1998
Antarctica is gaining ice
View All Arguments...


Username
Password
New? Register here
Forgot your password?

Latest Posts

Archives

Murry Salby - Confused About The Carbon Cycle

Posted on 13 August 2011 by Rob Painting

Every year humans release about 30 billion tons of carbon dioxide (CO2) into the atmosphere through the burning of fossil fuels, such as coal and oil. This is causing the Earth to warm by disrupting the biological (fast) carbon cycle, and is therefore increasing the Greenhouse Effect. Although there are large annual fluctuations in carbon dioxide, as it is exchanged back-and-forth between the atmosphere, oceans, soils, and forests, just under half of human emissions (the airborne fraction) remain in the air because the oceans, soils and forests are unable to absorb all of it. As a result, carbon dioxide has been steadily accumulating in the atmosphere.

Figure 1 - Fraction of the total human emissions (fossil fuel burning & land use change) that remain in the: a) atmosphere, b) land vegetation and soil, c) the oceans. From Canadell (2007)

Murry Salby, a professor at Macquarie University in Sydney, Australia, has an upcoming paper that attempts to pin the current rise in carbon dioxide on rising temperatures. Having listened to a podcast of a talk Salby gave at the Sydney Institute earlier this week, he demonstrates a remarkably poor understanding of the carbon cycle, and his hypothesis seems to stem from this fundamental misunderstanding.

Salby's carbon cycle confusion

Professor Salby refers to a number of graphs in his talk, but I have been unable to track down copies of these, therefore we'll have to rely on what I'm able to glean from the podcast, and given it's length, I'll only address some of the more obvious mistakes. At the beginning of the talk Salby states:

"current CO2 values are 380pmmv"(parts per million by volume) 

Not an encouraging start that he cites the atmospheric CO2 concentration as it was in 2005, rather than the 393 parts per million by volume (ppmv) it currently is in 2011. Not a fatal flaw of course, but not encouraging either. 

"Net annual emission has an average increase of about 1.5ppmv per year. We're on the right planet. That's the annual average increase you just saw. But it varies between years, dramatically by over 100%. From nearly zero in some years to 3ppmv in others. Net global emission of CO2 changes independently of of the human contribution"

At this point the accentuation and drama in Salby's voice make it sound as though he has stumbled onto something momentous, something no one else has noticed before. On the face of it, it seems preposterous that the army of scientists that have worked on carbon cycling over the years could have missed something so glaringly obvious. No, of course they haven't.

As discussed in the first paragraph of this post (and evident in Figure 1), the natural flux of CO2 in and out of natural systems varies from year-to-year. This flux is 20-30 times larger than the annual contribution by humans, but this balances out in the long-term. This variability is driven largely by El Nino and La Nina in the tropical Pacific, which shifts rainfall patterns over much of the world and is associated with warming and cooling of equatorial waters in the Pacific. The change in seawater temperature, and episodic upwelling of carbon-rich deep water, significantly affects the uptake and outgassing of CO2 from the oceans, and of course rainfall variation greatly affects plant growth. 

The upshot is that land vegetation takes up more CO2 during La Nina, and expels more CO2 during El Nino. In the ocean, the opposite trend occurs - El Nino leads to more CO2 absorption, and La Nina is when the oceans give up more CO2 (Figure 2). 

Figure 2 - (a) time trend in the exchange of CO2 by land-based vegetation (& soil microbes) with the atmosphere. (b) same - but for exchange of CO2 by ocean with atmosphere. Red indicates El Nino and blue La Nina phase. See Keeling (1995).  

There is simply no reason why the annual fluctuation should match the human contribution. At least Salby doesn't explain why he expects this to be the case. 

Having now convinced himself that short-term net CO2 has nothing to do with the human contribution, Salby therefore deduces long-term net CO2 must also be unrelated to human emissions. He goes on to derive a formula for CO2 rise associated with temperature. Salby claims a good match back to 1960 but therefafter it deviates from actual CO2 measurements by 10ppmv. By 1880, prior to atmospheric CO2 sampling, he estimates atmospheric CO2 at 275ppmv with a whopping uncertainty of 220 to 330ppmv!

In order to explain the deviation between the surface temperature record and his calculated atmospheric CO2 level, Salby blames the surface temperature record as being unreliable. As for his calculated trend disagreeing with the ice core record for the year 1880 (i.e the CO2 in air, from that period, trapped in ice cores) he 'disses' the ice core record claiming it to be only a 'proxy'. Which is news, I'm sure, to respected ice core experts like Dr Richard Alley.

You will note that every time the data disagrees with Salby's 'model', he trusts his 'model' over the data. Which contravenes the 'skeptic lore' that models are worthless and must be bashed, and only data should be trusted.

Q&A time - try not to shoot yourself in the foot!

The question & answer session at the end of Salby's talk throws up a few more comments that just reinforce that he has strayed into a field of science which he just simply doesn't understand. Witness:

"I think it's a pitfall that people look at the ice proxy of CO2 and take it literally. It's not atmospheric CO2, and I don't believe it's CO2 that was even in the atmosphere when that piece of snow was layed down"

This is nonsense. Perhaps Professor Salby should have acquainted himself with glaciology research before making such comments, because CO2 from ancient air trapped in the ice cores is precisely what is measured, albeit with some uncertainty in dating some sections.

"CO2 after the turn of the (21st) century continued to increase, in fact if anything slightly faster, but global temperature didn't. If anything it decreased in the first decade of the 21st century. Now I'm confident the IPCC (Intergovernmental Panel on Climate Change) will come up with an explanation, in fact they've come up with several"

It's here we need to back the truck up a bit. Salby's entire premise is that CO2 in the air directly dependent upon temperature - increase temperature and you increase CO2. Yet here he argues that CO2 can increase without an accompanying increase in temperature. Which contradicts his 'model'. By this time Salby is too focused on 'dissing' the IPCC to notice his own incoherency, and none of the audience picks up on this either.  

Note that SkS recently discussed the 'noughties slow-down' in global temperature here and here.

If the curve fits 

Seasoned readers will notice similarities between this Salby claim and a Lon Hocker rebuttal here at SkS last year. But the whole premise seems to follow along the lines of other recent flawed works tendered by Roy Spencer and Craig Loehle & Nicola Scafetta. That is: find some tenuous statistical relationship between two sets of data, and use these to assert the mainstream scientific establishment is wrong. The fact that there is no physical basis for the statistical relationship, or it doesn't fit within the well-established scientific framework, or is contrary to numerous other sets of data, never seems to warrant attention by "skeptic" scientists. It should, because of the implications one can draw. 

So what does this work by Salby imply, if it were true? From what I can gather from Salby's podcast, a 0.8°C change in average surface temperature is supposed to lead to about 120ppmv change in CO2. Therefore we can work backward in time to estimate what he reckons atmospheric CO2 would be at the time of the last Ice Age (glacial maximum), a time when global temperatures were about 4-6°C cooler than now . Today atmospheric CO2 is about 393ppm, so with 4°C cooling you already have a negative value for CO2 when we re-trace our steps back to the last ice age. Therefore all plant-based life on Earth must have died (and all the animals that depended on them) according to Professor Salby. And the Earth froze solid too.

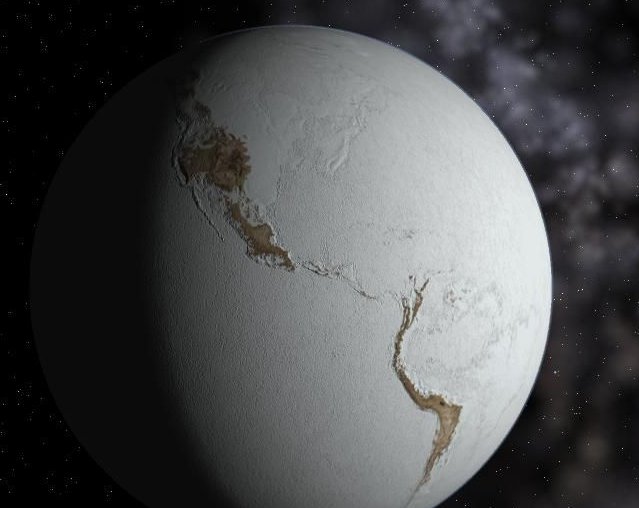
Figure 3 - the last Ice Age according to Murry Salby? Fictional image from celestiamotherlode.net  

Science - a description of reality, but YMMV

Without viewing Salby's calculations on the temperature/net global CO2 relationship, it's not possible to provide the 'killer blow' to his assertions; however, I don't believe that's necessary, considering the many flaws in Salby's work and fundamental reasoning.

The gradual increase in atmospheric CO2 is less than the total emissions of CO2 from human sources, so by elementary deduction, the excess must be going into the oceans, forests and soils, the other components of the fast carbon cycle.

A tell-tale signature of human fossil fuel emissions is the large fraction of CO2 being driven into the oceans. According to Henry's Law, we would expect the oceans to absorb more CO2 as the air above it becomes increasingly saturated with CO2. In other words the CO2 must be coming from a source external to the fast carbon cycle. This is supported by measurements showing that CO2 is accumulating in the ocean, and is reflected in the declining oceanic pH, showing the ocean is actually gaining CO2 over the long-term, not losing it, as Salby seems to believe.

We also know that the world's land vegetation has increased in mass - through re-growth in forests in the Northern Hemisphere, and CO2 fertilization of tropical forests. So that is gaining carbon too, and the areas affected are so large, we would expect them to have an effect on atmospheric CO2 levels at a global scale.  

There are a host of other problems with Salby's 'model', such as the ice core record, and where the warming came from in the first place, but there's no need to go into these details when the fundamental premise of Salby's argument is so clearly wrong.  

This blog post has been used as a rebuttal to the climate myth "Murry Salby finds CO2 rise is natural" which can be found at http://sks.to/salby

0 0

Printable Version  |  Link to this page

Comments

Prev  1  2  3  Next

Comments 51 to 100 out of 115:

  1. Dale wrote: "it's 3am here, so you'll excuse me if I skip your steps." Ignoring for the moment the fact that you didn't answer the question posed to you, I am happy to continue with it tomorrow. If you have the patience to wait for Salby's paper, I have the patience to wait until tomorrow to explain to you why there is no real need to wait until Salby's paper arrives. I have noticed however over the years that as a rule, "skeptics" are unwilling to follow this particular step by step explanation, and refuse to engage with it, because they know there will come a point where they are proved wrong. Please prove an exception to the rule. "If your steps are like the SkS explanation, then I can already predict you assume a limited or no natural variance in natural sources/sinks." No such assumption is involved at any stage (in fact if you follow the steps towards the end I will show a plot that demonstrates that the natural carbon cycle is both unbalanced and highly variable). If you think that it does, then you don't understand the argument, however you can always prove me wrong by pointing it out when you think the assumption has been made. You can only do that though by following the derivation and agreeing or refuting the points step by step. "That is where I disagree, and that I think there is more variance." As I have already pointed out, it is well known that there is considerable variance in the carbon cycle from year to year. I have also explained why it doesn't explain the long term trend. So, do you agree that conservation of mass applies and the annual rise in atmospheric CO2 is equal to the sum of emisions (from all sources) minus the sum of all uptake (basically only natural sinks)? Yes or No?
    0 0
    Moderator Response: [Dikran Marsupial] I suggest we ignore Dale on this thread until he answers the question. Either he is interested in the scientific truth, in which case he will go through the exercise with me step by step and we can resolve the issue in a scientific manner, or he is a troll. It is up to him to demonstrate which is the case, but this will only work if we ignore him until he has answered the challenge or ducked it.
  2. @DSL, "What is the evidence that suggests more natural variance? Why do you think this?" Human emissions are a constant stream. Year on year ppmv rises varies between 0 and +3 (1.5 +-1.5). Since human emissions are constant and would cause the same increase each year, what causes the variance? Natural variance. That means there's a 30GT per year variance. @Dikran, "So, do you agree that conservation of mass applies and the annual rise in atmospheric CO2 is equal to the sum of emisions (from all sources) minus the sum of all uptake (basically only natural sinks)? Yes or No?" Yes.
    0 0
  3. Ok, so there's variance, but you said "more" variance. What do these variations have to do with the trend in atmospheric CO2? You aren't heading toward some form of "El Nino causes global warming" are you?
    0 0
  4. DSL Of course I'm not saying that. ENSO is only one part of the puzzle which affects weather. Though a sustained ENSO in one direction may influence climate (not control it). But what it does do is alter weather in the greater Pacific basin (Aust and US included) which influences plant growth which in turn alters the carbon cycle.
    0 0
  5. Dale#52: "Since human emissions are constant... " Incorrect. Emissions go up and down with global economic activity. See the graphs here. The portion of anthro CO2 that remains in the atmosphere varies with the ocean's ability to soak it up and year-to-year changes in growing conditions. "That means there's a 30GT per year variance." That makes no sense at all.
    0 0
  6. Muoncounter, In the first graph blue (emissions) looks pretty consistent to the linear trend. You're not confusing the Green (what goes to sinks) and the red (what stays)? Salby contends that natural variance absorbs between none or all human emissions, the difference between rear to year ppmv increase based on isotopes, so since we currently emit about 30GT that's the natural variance. That's his claim.
    0 0
  7. Dale#56: "confusing the Green ... and the red" No, you appear to be confused. First it was "human emissions are constant" and the varying delta CO2 was some sign of '30 GT of natural variance'. Now its "pretty consistent to the linear trend," which is not a constant. If Salby contends that "natural variance absorbs between none or all human emissions," he's right just as often as a stopped clock; the average airborne fraction is about 50%. From data I've seen, its never as low as 'none' and never as high as 'all.' So '30 GT natural variance' does not compute. Looks like a low on average of ~40% and a high on average of ~70%. Natural variance (crudely speaking) +/-15%. But you've missed the more important graph: in the current world, atmospheric CO2 increases whether temperature anomalies go up or down. How can this possibly mean increasing temperature causes increased CO2? Oh, then there's that mass problem. Where'd the cumulative mass of our emissions go, if not into the atmosphere?
    0 0
  8. muoncounter, A consistent rise with little deviation is a constant rise. As I said, it's Salby's claim, not mine. And until the evidence which led him to the claim is released, there's nothing further I can say about it. I never said that temperature causes increased CO2, Salby does in his podcast. But hypothetically speaking, if temperature increases and a number of natural events occur, they could increase CO2. So indirectly temperature could increase CO2. Take for example the Russian permafrost. As it thaws, GHG's are released. Or more plant growth in the northern and southern extremes where carbon sinks aren't as efficient, more CO2 would be released (rot etc). There's also a new study out a couple weeks ago that claims higher temps stunt tree growth, thus reducing their efficiency as carbon sinks. In a lot of these cases there is lag between the temp increase and the CO2 increase (rotting and new growth doesn't occur straight away for instance). But without researching it deeply I couldn't say definitely if their could be a link. I'm just speculating off the top of my head. As for where emissions go, into sinks of course. The atmosphere isn't the only place emissions go.
    0 0
  9. Dale#58: "until the evidence which led him to the claim is released" No need to wait. The evidence is already out there and is publicly available. Shown below is 1965-2010 emissions (red is 2000). source Not constant; not even that close to 'consistently linear,' whatever that means. Ups and downs due to economic activity. The graph linked earlier showed atmospheric CO2 increases are smaller after the years of lower CO2 emissions (no surprise there). But it does strongly suggest that there aren't any 'hypothetical natural events' taking up the slack. The big natural events -- Pinatubo, for example -- are well-known and well-studied. "I'm just speculating off the top of my head" Well, that's a start. But if you are just speculating, how can you be so confident about natural variation? I always thought speculation was akin to guessing. Not a very skeptical thing to do.
    0 0
  10. Dale, everything you say is 'hypothetically speaking', 'speculating', 'maybe' or 'could', and none of it is backed up with evidence. Hypothetically speaking, some hitherto unknown natural cycle could drive rapid warming since the Industrial Revolution. Hypothetically speaking, faries could live at the bottom of my garden, too. Until you, or Salby, or anyone else can provide evidence for these magic natural cycles driving the rapid 20th Century warming, they remain merely fairies at the bottom of the garden. Scientifically, nothing you or Salby has said troubles climate science in the slightest, which can already explain very well the recent warming and its attendant variations.
    0 0
  11. Dale Thanks for engaging with the exercise, much appreciated. So we can re-express the conservation of mass by writing dC = E_a + E_n - U_n where dC is the annual increase in atmospheric CO2, E_a is annual emissions from anthropogenic sources (fossil fuel use and land use changes), E_n is total annual emissions from all natural sources and U_n is total annual uptake of CO2 by all natural sinks. This should be uncontraversial as it is merely a restatement of the first step in algebraic terms. Next, subtracting E_a from both sides, we have dC - E_a = E_n - U_n Do you agree that this is correct?
    0 0
  12. Yes I agree, it's a simple algebraic statement that the annual change less what we throw up there, is representative of the natural cycle.
    0 0
  13. Dale Glad we agree so far. So following from dC - E_a = E_n - U_n we can work out the difference between E_n and U_n without knowing anything about the values of E_n and U_n, provided we know dC and E_a. Specifically, if we know that the left hand side is negative (i.e. E_a > dC) then the right hand side must also be negative (i.e. U_n > E_n). Do you agree with this? p.s. sorry got subscripts wrong, should be fixed now.
    0 0
  14. And equally valid, if E_a < dC then the right is also +, as well as if E_a == dC then the right is also 0.
    0 0
  15. Dale Great, so we agree that if E_a > dC then we know that U_n > E_n. Lets look at the data. In the plot below, the blue line shows annual anthropogenic emissions from fossil fuel use and land use changes; the red line shows the annual change in atmospheric CO2 calculated from the obsevations made at Mauna Loa. All three datasets are available from the Carbon Dioxide Information Analysis Centre. The green line shows the inferred difference between natural emissions (E_n) and natural uptake (U_n). Note the plot is labelled a little differently such that dC = C', F_a = E_a, F_i = E_n and F_e = U_n. Do you agree that E_a > dC for every year of the last fifty years (at least until 2006), and hence we know that for the last fifty years U_n > E_n?
    0 0
  16. For the sake of the lesson I will retain questions till the end. But yes, we'd already concluded above that natural sinks remove on average ~50% of human emissions (as shown in the above graph).
    0 0
  17. Dale you have missed an important point. It isn't just that the natural sinks remove ~50% of human emissions. U_n > E_n means that the natural uptake removes ALL of the natural emissions as well as ~50% of human emissions. The remaining ~50% of anthropogenic emissions is what has been causing atmospheric concentrations to rise. Back to the step by step: You agree that for the last fifty years natural uptake has exceeded natural emissions (U_n > E_n). Do you agree that this means that the natural carbon cycle has consistently opposed the rise in atmospheric CO2 as in each of the last fifty years it has taken more CO2 out of the atmosphere than it has put in?
    0 0
  18. Crickets.
    0 0
  19. @rustneversleeps, Unfortunately, Dale does. ;) @Dikran "U_n > E_n means that the natural uptake removes ALL of the natural emissions as well as ~50% of human emissions." I'll come back to that at the end of the steps. ;) But yes, sinks have removed more than the natural cycle puts in.
    0 0
  20. Dale wrote "I'll come back to that at the end of the steps. ;)" No, we had better deal with it now. If you disagree with that statement it means you must have misunderstood a previous step. If U_n > E_n it means that natural uptake was sufficient to take up all of the natural emissions for that year, as well as a bit more. That "bit more" has averaged about half of anthropogenic emissions. If you disagree with that, you need to explain your position.
    0 0
  21. Okay let's look at it via numbers. Say for argument, E_n is 70 and E_a is 30. This makes a total of 100 E. Thus since we know on average ~50% of E_a is taken up, U_n must be 85 (E_n + (0.5 * E_a)). However due to mixture E_n and E_a are removed in ratio, unless you claim U_n is intelligent enough to discern the difference and remove all of E_n first. Thus by the numbers above, 85% of E_a is removed, and 85% of E_n is removed, which leaves total remaining E of 15 (0.85 * (70 + 30)) made up of 10.5 E_n and 4.5 E_a.
    0 0
  22. Dale So how much of the rise in atmospheric CO2 is the natural environment responsible for in your example?
    0 0
  23. Dale - You are making the classic Ship of Theseus error, confusing components with structure, or in this case amounts. An amount of CO2 equal to about half of anthropogenic emissions remains in the atmosphere. It doesn't matter whether those are all anthropogenically produced molecules, decayed plant matter, exchanges with the ocean, etc. - it's the amount that matters when discussing climate. To quote Heroclitus - "Ever-newer waters flow on those who step into the same rivers." Yet you still get just as wet...
    0 0
  24. Nature is responsible in ratio between E_n and E_a, so in the example above, 70% whilst humans are responsible for 30%.
    0 0
  25. KR, Dikran stated that ALL natural emission are removed and half of human emissions remain, which is just simply not true. Unless you are claiming that natural sinks can discern between natural and human carbon in the air and prioritise natural carbon over human carbon.
    0 0
    Moderator Response: [Dikran Marsupial] It should have been obvious that I was talking about amounts of CO2, not the molecules themselves, that would be absurd. There is no mechanism by which the sinks differentiate between anthropogenic CO2 and natural CO2, nor is there a mechanism to differntiate between natural CO2 emitted last year and this, which would also be required under your misinterpretation!
  26. Dale wrote: "Nature is responsible in ratio between E_n and E_a, so in the example above, 70% whilst humans are responsible for 30%." So you are saying that in that year the natural environment caused 70% of the rise of 15 units of atmospheric CO2 that happened that year, even though it took 15 units of CO2 out of the atmosphere more than it put in? Hint: The natural environment is responsible for 100% of the uptake and we are responsible for (essentially) 0% of it.
    0 0
  27. Dale - As he has noted, Dikran is well aware that what remains in the air is not just anthropogenic CO2, but rather a mix of CO2 from anthropogenic, biological, and natural chemical sources. Again, though, it's the amount of CO2 in the increase, in ppm - that's what is important. You are making semantic/rhetorical points of no scientific import. If you claim it's an error that invalidates the mass balance discussion, I would consider you to be either sadly misdirected or deliberately disingenuous. If it makes you comfortable, insert the phrase "an amount equal to" before every CO2 amount, as in: Dikran - "That "bit more" has averaged about half of an amount equal to anthropogenic emissions" -- Dikran - There are some differences, in that isotopic uptake of plants differs between various carbon weights, and anthropogenic carbon has a different isotopic mix than stuff in the biological side of the carbon cycle. That's useful for tracking purposes. But yes, Dale is either quite confused or trolling.
    0 0
    Moderator Response: [Dikran Marsupial] Yes, the point about the isotptic differences is correct (but I didn't want to overly complicate things). I am interested to see how Dale will answer my most recent question.
  28. Excuse me, but being precise is trolling? I've had other people in this very thread "correct" me as I wasn't precise, yet when a "sceptic" does it it's trolling? If we want to look at isotopes, is it correct to say that human emissions contain a higher ratio of C12 to C13? Since in fossil fuels C14 and C13 breakdown over time to combinations of methane, nitrogen and C12. Is it also fair to say that around 85% of plant life "prefers" the lighter isotope of C12 over C13 (it's well documented that the ratio of C13 in these plants is lower than atmospheric ratio of C13). Thus even though the C12/C13 ratio of human emissions is different to the natural C12/C13 ratio, the increased amount of C12 would be "preferred" by these plants. So that would imply that these plants "eat" human CO2 at a faster rate. Of course, this has been observed with the faster growth of C3 plants over C4 and CAM plants.
    0 0
    Moderator Response: [Dikran Marsupial] Precision ought to be tempered by common sense. Common sense should have told you that I didn't mean natural uptake took up the same molecules of CO2 that had been released that year by natural sources.

    I suggest we leave the isotpic arguments until later.

    Pedantry is often used by trolls to avoid addressing the substantive issues and obuscate the discussion. It is a good idea to ask if the meaning is not clear so that honest precision is not confused for trolling (it also facilitates the discussion of the substantive issues).
  29. I apologise if my comment was taken as trolling but since I had been corrected for precision in the past I thought that was the culture here. And the meaning of "all natural emissions" is pretty clear. Please continue your lesson. To answer your last question, yes nature has taken out more than put in.
    0 0
  30. Daly @78, I get rather [ -snip- ] just making things up on this forum. For example:
    "If we want to look at isotopes, is it correct to say that human emissions contain a higher ratio of C12 to C13? Since in fossil fuels C14 and C13 breakdown over time to combinations of methane, nitrogen and C12."
    In fact C14 decays into N14, and electron and an antineutrino. As protons (ie, hydrogen ions) are not a decay product, there is no possibility of forming methane from the decay of C14. C13, in contrast, is stable and does not decay. Consequently C12 is not the decay product of any Carbon isotope.
    0 0
  31. Dale @71, in your example, you would agree that the presence of E_a is causing natural processes to absorb 10.5 units less of E_n than it otherwise would have. In other words, even in your pedantic example, human emissions are responsible for 100% of the increase, 15% by directly increasing the atmospheric concentration, and 85% by substituting for natural emissions that otherwise would have been removed.
    0 0
    Moderator Response: [Albatross] Fixed bold tag
  32. If I'm going to be continuosly called a troll, I will just simply leave.
    0 0
    Moderator Response: [Albatross] Please do not leave just yet. You are making progress on this matter. Dikran may well convince you yet. Everyone, please exercise maximum patience with Dale. And Dale, people would not get so frustrated with you if you a) Listened and b) Stopped making stuff up.
  33. Dale You appear to have missed my last question, which cannot be adequately answered "yes nature has taken out more than put in." My last question is repeated below.
    Dale wrote: "Nature is responsible in ratio between E_n and E_a, so in the example above, 70% whilst humans are responsible for 30%." So you are saying that in that year the natural environment caused 70% of the rise of 15 units of atmospheric CO2 that happened that year, even though it took 15 units of CO2 out of the atmosphere more than it put in? Hint: The natural environment is responsible for 100% of the uptake and we are responsible for (essentially) 0% of it.
    0 0
  34. Dikran, I think both of us used the word "responsible" incorrectly above. Nature did not cause an increase in my example. The total weight of emissions being less than the intake is the cause of the rise. If E_n had dropped by 15, then the rise would be zero. Again the total weight of emissions is the cause of no rise.
    0 0
  35. Dale If that was an honest question, my sincere apologies. You have indeed been quite involved and reasonable in a discussion that 'skeptics' tend to avoid. I have repeatedly, however, seen the Ship of Theseus question (which molecule is which) inappropriately invoked up in mass balance discussions, on multiple threads and blogs. Since in regards to climate we're concerned about CO2 concentration, not the origin of individual molecules, claiming (as some have) that we aren't raising atmospheric concentrations based on the ancestry of those molecules is simply an incorrect view. Isotopic analysis is quite useful for determining the rates at which CO2 moves from one climate compartment (air, water, soil, plants, rocks) to another. But again, the relevant quantities for climate change are total CO2 concentrations and amounts, not origins.
    0 0
  36. Sorry I said less than above when I meant more than.
    0 0
  37. KR, Agreed that total amount is more important than source. My point really was that its untrue to say nature sinks all of its own and only half of human emissions. The ratios are irrelevant when the total weight is out of sync.
    0 0
  38. Dale I think my use of "responsible for" is reasonable, as it would be reasonable to say that "my wife spends more than I earn and is responsible for the increase in our debts" (happily not actually true ;o). Your use of "responsible" however is not reasonable, as illustrated by the apparent paradox in your position highlighted by my last question. So the question is, given that the natural environment is known to have taken in more carbon dioxide than it emitted every year for the last fifty years, in what way is it the cause of the observed rise over that period? Common sense says that it isn't the cause, it has opposed the observed rise.
    0 0
  39. In terms of the evidence presented in this thread, the cause is human emissions. But I do proviso that statement with "in terms of the evidence in this thread". The complexity of the carbon cycle is not that simple in reality, and the calculation methods of levels of emission and intake do raise some questions. For instance, how are human emissions calculated? In the link you provided above they state that they use UN energy reports. I ask what values they use to calculate emissions, because every coal plant is different in emission amount by a huge variance. As an example, two of my local power stations (near Melbourne) produce 1.4 GT/year in a 1600GW plant and 1.1 GT/year in a 2200GW plant. Obviously, emissions per GW is hugely different between these plants. Also, does the calculation take into consideration any CCS deployed at the plants? The 2200GW plant (Loy Yang A) uses algae CCS technology to reduce the 1.1 GT/year by around half (though admittedly the technology is still in testing and only operates about half the year for the last ten years). But you can see my point. If for example the calculation puts an arbitrary 875 GT/GW/year (the Hazelwood value) it does not represent at all the Loy Yang A calculation which ends up at 500 GT/GW/year. Does the human emission calculation take these things into consideration, or is it a calculation based on some arbitrary universal figure? This is important, because if the actual human emissions are less than the estimated amount, it throws a lot of other calculations out of whack, such as human impact on climate, temperature change, etc. Which also brings questions on how the natural in and out figures are calculated. How accurate to reality are they?
    0 0
  40. Dale#89: "complexity of the carbon cycle is not that simple in reality," Makes no difference: Look at the seasonal range of atmospheric CO2; at MLO, it's a range of about 6ppm from peak to trough. This hasn't changed much: That's your natural cycle. Nothing in that cycle explains the increase from ~310 ppm to more than 390 ppm in under 50 years. If there were only natural cycles at work, we would see the seasonal and not the trend. "if the actual human emissions are less than the estimated amount," You're speculating once again; you really don't produce any evidence that this is a significant concern. There are people who do this for a living; have you looked into their work? It will take a lot more than a generic 'if' -- it makes just as much sense to speculate that polluters under-report their emissions.
    0 0
  41. Dale's last argument is feeble. CO2 CRC shows only 4 operational captures and 1 operational storage in Australia. My guess is that this number is likely to be even lower in China and India. The chance that it makes a substantial difference is close enough to zero to be ignored. I also think Tom Curtis has a good point in post #81 above.
    0 0
  42. Phillipe, I didn't include Loy Yangs CCS in the 500 GT/GW/year calculation, I based it on the full 1.1 GT/year figure. And yes Toms point that E_a offsets U_n which leaves some of natural CO2 in the air.
    0 0
  43. muoncounter, Its also valid to speculate that the UN might be inflating the numbers too, but we should focus on the science and not potential corruption in those two bodies. I still ask, is a single value used to represent all power stations, or do they use all stations reported emissions?
    0 0
    Response:

    [DB] "Its also valid to speculate that the UN might be inflating the numbers too"

    Not here, not on this blog, not by you or anywho; not on my watch.  Not gonna happen.  Next time comment goesa bye-bye.  Capiche?

    Cf. Comments Policeeya.

  44. Dale#93: "I still ask, " Look it up. Posing a variety of questions just to give the impression that there is doubt is a FauxNews tactic. That wouldn't be skeptical. And do not suggest corruption; that violates the CP.
    0 0
  45. Why is it valid to speculate that the UN might be inflating the numbers? This is a nonsensical statement. The UN has nothing to gain from doing this. The more "controversy" there is about climate, the more funding these corrupt bodies will get. Spreading doubt would be actually good for them. The moment the science is totally "settled" there will be no reason to keep up much of an IPCC. You are showing your true intentions with that kind of poorly veiled accusations, and the attempt at disguising it with a tepid self correction. "We should focus on the science" indeed, so why throw that inane corruption remark in the first place? Your response in #92 seems to reinforce my point. Whatever difference could be there is so small that it does not matter. A working estimate can de berived from simple extraction and sales of FF figures from year to year, since there is no significantly increasing storage of unused fossil fuel from year to year. This is a rather pointless argument, little more than splitting hairs. Not very interesting.
    0 0
    Response:

    [DB] "Why is it valid to speculate that the UN might be inflating the numbers?"

    That was just an attempt to derail this thread.  Please ignore it.

  46. [DB] That was just an attempt to derail this thread. Please ignore it. That's it, I'm out. I thank you for the good discussion we had. I'll point out that muoncounter started that train of thought with his implication that business corrupts their emission reporting by reporting less. Yet his comment remains unmoderated. From #90: "it makes just as much sense to speculate that polluters under-report their emissions."
    0 0
    Response:

    [DB] Actually, it was pretty transparent.  However, should you wish to abandon the attitude & check the tone at the door and actually enter into dialogue with individuals extremely well-versed in climate science, then you will be welcomed upon your return.  In and of itself, SkS is witness to some of the finest science dialogue on the intertubes, (relatively) free of insults and the usual aspersions/comspiracy theories that abound in the usual places.  Ciao.

  47. Dale - I was attempting to give you the benefit of doubt, to work from the assumption that you were actually interested in discussing the science of climate and climate change, and in this case, critically examining a 'skeptic' argument that appears to be poorly reasoned. Your "UN" conspiracy comment just throws that out the window. If you (or for that matter anyone, in any discussion) starts with the assumption that the majority of people spending their life-work in a science field are lying, there is nowhere for the discussion to go. Personally, I now consider you someone in denial or a troll, and will treat your comments accordingly.
    0 0
  48. Dale - Muoncounter's quote in #90 clearly indicated that such a speculation was nonsense. 'Nuf said.
    0 0
  49. Dale#96: "muoncounter started that train of thought" I did not speculate one way or the other; I offered the flip side of the big 'if' to demonstrate the utter pointlessness of such speculation. This a denier tactic straight out of the pages of FauxNews: the unfounded and meaningless question. Repeat it enough times and it gets picked up as if the content is true. But when all else fails and the argument still isn't going your way, start throwing the good old 'corruption' bombs. Sad, very sad.
    0 0
  50. For those interested in the answer to Dale's question @89, I refer you to CDIAC, and in particular to Boden et al, 1995 which explains the methodology used:
    "3. CO2 Emission Calculations The methods of Marland and Rotty (1984) were used to estimate the amount of CO2 emitted to the atmosphere from fossil-fuel burning, gas flaring, and cement production. This section briefly summarizes these methods and states some of the assumptions used in these methods [for a complete discussion see the copy of the Marland and Rotty (1984) paper provided in Appendix B]. As indicated earlier, the primary data used to calculate the CO2-emission estimates came from the UNSTAT Database. Fuel production data were used in generating global CO2-emission estimates because these data are more complete than energy consumption data. For regional or national emission estimates, however, one needs to know the amount of fossil fuels consumed in each region or nation, and not the amount produced, to calculate the CO2 emitted. The calculation of CO2 emissions from fossil fuels is conceptually very simple (Marland and Rotty 1984). For each type of fuel, the annual CO2 emissions are the product of three terms: the amount of fuel consumed, the fraction of the fuel that becomes oxidized, and a factor for the carbon content of the fuel (Marland and Rotty 1984). That is, CO2i = (Pi) (FOi) (Ci), (1) where subscript i represents a particular fuel commodity, P represents the amount of fuel i that is consumed each year, FO is the fraction of P that is oxidized, C is the average carbon content for fuel i, and CO2 is the resulting CO2 emissions for fuel i expressed in mass of carbon. For CO2 emissions, fossil fuels can be divided into the usual groups of solid, liquid, and gas fuels. An identical procedure has been adopted by the IPCC in prescribing a methodology for countries to use in estimating and reporting greenhouse gas emissions (IPCC 1995). Global total CO2-emission estimates are generated by using the above equation, where P represents production data from the UNSTAT Database for all primary solid, liquid, and gas fuels. Because secondary fuels are derived from primary fuels, they need not be included."
    (My emphasis) Because fuel use data are used in the estimates of global emissions, not energy production data, Dale's expressed concern is unjustified. However, of necessity average values for the various multipliers for different fuels must be used. Along with other factors this leads to an estimated error "from 6 to 10%". That is significant, but it is nowhere near enough to suggest that Humans are not responsible for rapid rise in CO2 concentrations.
    0 0

Prev  1  2  3  Next

You need to be logged in to post a comment. Login via the left margin or if you're new, register here.


The Consensus Project Website

THE ESCALATOR

(free to republish)


© Copyright 2024 John Cook
Home | Translations | About Us | Privacy | Contact Us