Climate Science Glossary

Term Lookup

Enter a term in the search box to find its definition.

Settings

Use the controls in the far right panel to increase or decrease the number of terms automatically displayed (or to completely turn that feature off).

Term Lookup

Settings


All IPCC definitions taken from Climate Change 2007: The Physical Science Basis. Working Group I Contribution to the Fourth Assessment Report of the Intergovernmental Panel on Climate Change, Annex I, Glossary, pp. 941-954. Cambridge University Press.

Home Arguments Software Resources Comments The Consensus Project Translations About Support

Twitter Facebook YouTube Mastodon MeWe

RSS Posts RSS Comments Email Subscribe


Climate's changed before
It's the sun
It's not bad
There is no consensus
It's cooling
Models are unreliable
Temp record is unreliable
Animals and plants can adapt
It hasn't warmed since 1998
Antarctica is gaining ice
View All Arguments...


Username
Password
New? Register here
Forgot your password?

Latest Posts

Archives

IPCC Draft Report Leaked, Shows Global Warming is NOT Due to the Sun

Posted on 14 December 2012 by dana1981

This post has been re-published by The Guardian

Alec Rawls, an occasional guest poster on the climate contrarian blog WattsUpWithThat who signed up to review the upcoming Intergovernmental Panel on Climate Change (IPCC) Fifth Assessment Report (as anyone can), has "leaked" a draft version of the report and declared that it "contains game-changing admission of enhanced solar forcing."  This assertion was then repeated by James Delingpole at The Telegraph (with some added colorful language), and probably on many other climate contrarian blogs.

If the IPCC was to report that the sun is a significant player in the current rapid global warming, that would indeed be major news, because the body of peer-reviewed scientific literature and data clearly show that the sun has made little if any contribution to the observed global warming over the past 50+ years (Figure 1).

contributors 50

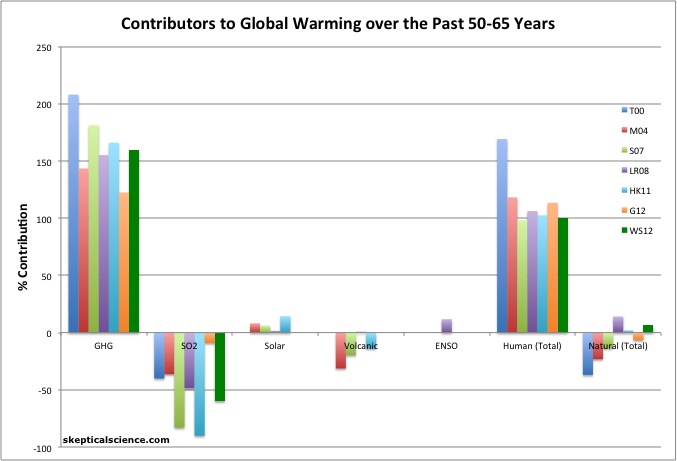
Figure 1: Percent contributions of greenhouse gases (GHGs), sulfur dioxide (SO2), the sun, volcanoes, and El Niño Southern Oscillation (ENSO) to the observed global surface warming over the past 50-65 years according to Tett et al. 2000 (T00, dark blue), Meehl et al. 2004 (M04, red), Stone et al. 2007 (S07, green), Lean and Rind 2008 (LR08, purple), Huber and Knutti 2011 (HK11, light blue), Gillett et al. 2012 (G12, orange), and Wigley and Santer 2012 (WS12, dark green).

So why would the latest IPCC report contradict these studies when its purpose is to summarize the latest and greatest scientific research?  The answer is simple — it doesn't.  Rawls has completely misrepresented the IPCC report.

Cosmic Source of Confusion

The supposedly "game-changing admission" from the IPCC report is this:

"Many empirical relationships have been reported between GCR [galactic cosmic rays] or cosmogenic isotope archives and some aspects of the climate system...The forcing from changes in total solar irradiance alone does not seem to account for these observations, implying the existence of an amplifying mechanism such as the hypothesized GCR-cloud link."

This statement refers to a hypothesis of Henrik Svensmark from the Danish National Space Institute, who has proposed that galactic cosmic rays (GCRs) could exert significant influence over global temperatures.  The GCR hypothesis suggests that when they reach Earth, GCRs (high-energy charged particles originating from somewhere in our galaxy) are capable of "seeding" clouds; thus at times when a lot of GCRs are reaching the Earth's surface, more clouds will form.  Clouds generally have a cooling effect on the Earth's temperature, because they reflect sunlight. 

So the hypothesis goes like this: high solar activity means a strong solar magnetic field, which deflects more GCRs away from Earth, which means less cloud formation, which means less sunlight is reflected away from Earth, which means more warming.  This GCR-caused warming would amplify the warming already being caused by increased solar activity.  Conversely, cooling from decreased solar activity would hypothetically be amplified by more GCRs on Earth, more clouds, more reflected sunlight, and thus more cooling.

It's important to note that so far virtually all scientific research on GCRs has shown that they are not effective at seeding clouds and thus have very little influence over the Earth's temperature.  In fact, as Zeke Hausfather has noted, the leaked IPCC report specifically states this:

"...there is medium evidence and high agreement that the cosmic ray-ionization mechanism is too weak to influence global concentrations of [cloud condensation nuclei] or their change over the last century or during a solar cycle in any climatically significant way."

But more importantly in this context, even if GCRs did influence global temperature, they would currently be having a cooling effect.

Solar Activity is Down, Greenhouse Gases are Up

Rawls also provides the following quote from the IPCC report (emphasis added):

"There is very high confidence that natural forcing is a small fraction of the anthropogenic forcing. In particular, over the past three decades (since 1980), robust evidence from satellite observations of the TSI [total solar irradiance] and volcanic aerosols demonstrate a near-zero (–0.04 W m–2) change in the natural forcing compared to the anthropogenic AF increase of ~1.0 ± 0.3 W m–2."

The term "radiative forcing" refers to a global energy imbalance on Earth, which may be caused by various effects like changes in the greenhouse effect or solar activity.  A positive forcing will result in warming temperatures, while a negative forcing will result in cooling.

Here the IPCC is saying that since 1980, the sun and volcanoes have combined to cause a slightly negative global energy imbalance, which means they have had a slight cooling influence on global temperatures over the past three decades.  Indeed, solar activity has decreased a bit over that timeframe (Figure 2).

Figure 2: Global temperature (red, NASA GISS) and Total solar irradiance (blue, 1880 to 1978 from Solanki, 1979 to 2009 from PMOD), with 11-year running averages.

As we would expect, lower solar activity including a weaker solar magnetic field has translated into a slight increase in GCR flux on Earth (Figure 3).  Note that on the left-hand axis of Figure 3, GCR counts decrease going up the axis in order to show the relationship with temperature, since fewer GCRs hypothetically means fewer clouds, less reflected sunlight, and higher temperatures.

cosmic rays vs temps

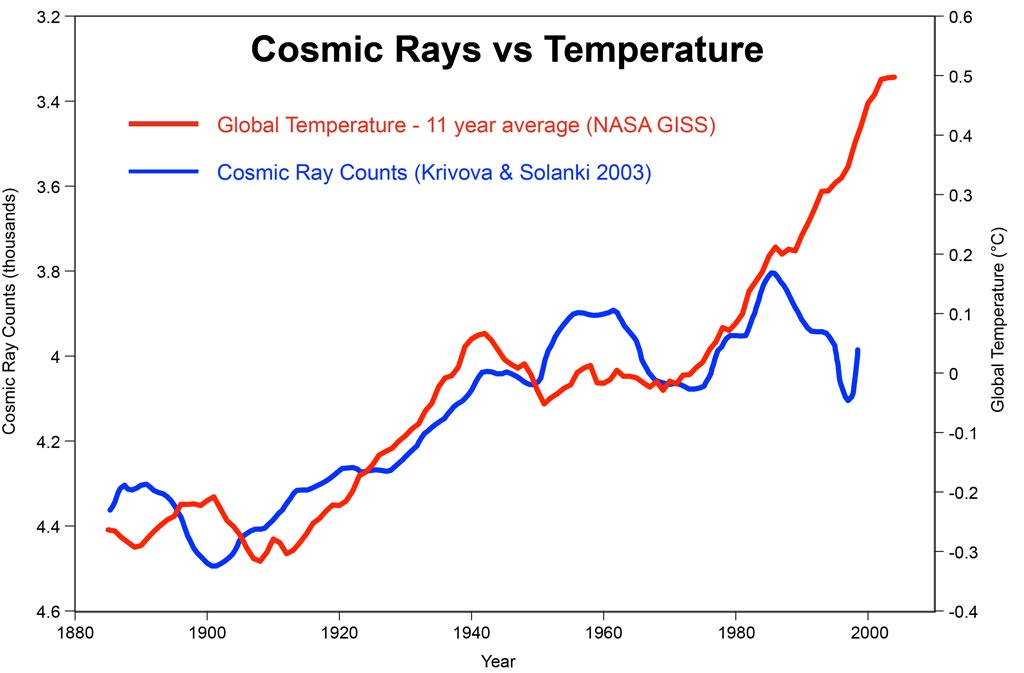
Figure 3: Global average surface temperature (red, NASA GISS) vs. GCR flux on Earth (blue, Krivova & Solanki 2003), with 11-year running averages.

So, if GCRs really do amplify the solar influence on global temperatures, since 1980 they are amplifying a cooling effect.  In fact, GCRs reaching Earth recently hit record high levels (Figure 4), yet temperatures are still way up.

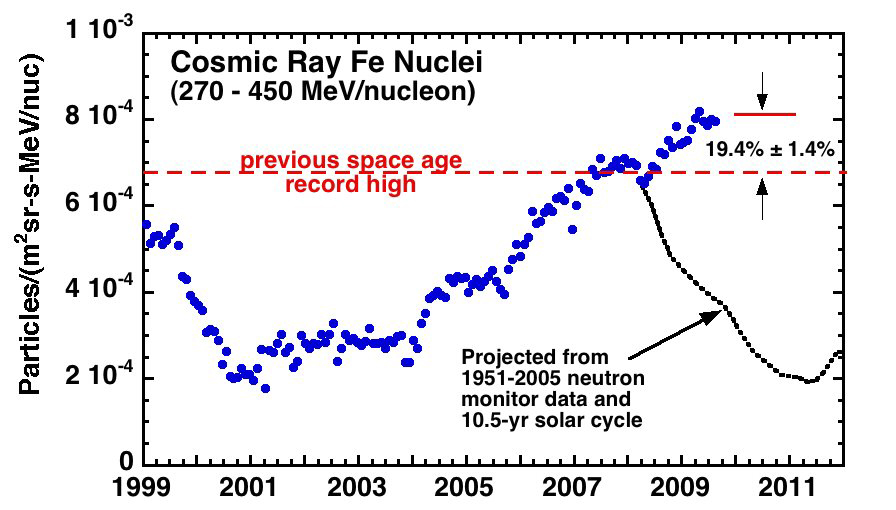
Figure 4: Record cosmic ray flux observed in 2009 by the Advanced Composition Explorer (NASA)

Physical Reality Intrudes on Rawls

Rawls has argued to the contrary by claiming that the climate is still responding to the increase in solar activity from the early 20th century, and that GCRs are amplifying that solar warming from over 60 years ago.  This argument is simply physically wrong.  As Figure 2 illustrates, when solar activity rises, temperatures follow suit very soon thereafter.  In fact, during the mid-20th century, solar activity and global surface temperatures both flattened out.  Are we to believe that the planet suddenly began responding to the pre-1950 solar activity increase in 1975—2012, after not warming 1940—1975?  The argument makes no physical sense.

On top of that, the hypothetical GCR process is a relatively rapid one.  Cloud formation from GCR seeding should occur within days, and clouds have very short lifetimes.  For GCRs to have a warming effect, solar activity must be increasing right now.  It is not, in fact solar activity has been essentially flat and slightly declining in recent decades.  Changes in solar activity from 60+ years ago have no bearing whatsoever on GCRs today.

IPCC Shows Global Warming is NOT Solar

To sum up,

  • The leaked IPCC report states that there may be some connection between GCRs and some aspects of the climate system.
  • However, the report is also consistent with the body of scientific literature in stating that research indicates GCRs are not effective at seeding clouds and have very little influence on global temperatures.
  • Solar activity has been nearly flat and slightly decreasing in recent decades, meaning that if GCRs do amplify solar influences on climate, they are amplifying a cooling effect.

The body of peer-reviewed scientific literature is very clear: human greenhouse gas emissions, not solar activity or galactic cosmic rays, are causing global warming.  The leaked IPCC report is entirely consistent with this conclusion.  In fact, in attempting to argue to the contrary, Rawls has scored an own goal by showing that if anything, GCRs are currently amplifying a solar cooling effect.

0 0

Printable Version  |  Link to this page

Comments

Prev  1  2  3  

Comments 101 to 115 out of 115:

  1. Newsflash: In breaking news, Alec Rawls finds (-snip-). Claims refutation of altitudist dogma that Everest's summit is the highest location on Earth. Anthony Watts breathless with anticipation of this new, ground breaking revelation.
    0 0
    Moderator Response: [DB] Inflammatory snipped.
  2. Let's sum up here. brr is arguing that there may be a solar factor which amplifies the TSI forcing. I have no problem with that - there may very well be. brr claims this is Rawls' entire argument, which is not true. As Tom notes, Rawls also claims that solar amplification could account for a significant amount of the warming over the past half century. That argument is discussed in the "Physical Reality Intrudes on Rawls" section in the above post. So brr, now that I've agreed that there might be a solar amplification factor, are you willing to admit that such a factor could not account for the recent global warming, given that solar activity on the whole is down over the past 60 years?
    0 0
    Moderator Response: [DB] Note that brr is yet another sock-puppet of banned user Dale...and has also recused himself from further participation here.
  3. Calling Mr. Rawls. Mr. Rawls, are you in the building? Can you come to the comment stream and defend your integrity? It's taking quite a beating. Dale was unable to render life support. Indeed, he appears to have accidentally dropped a bottle of oxygen on what was left.
    0 0
  4. "...since 1980 they are amplifying a cooling effect..." I don't think that is anywhere close to the truth. I downloaded the count from the Moscow monitor, which has data from 1958 to 2012. Keep in mind the "troughs" in the count should be warming pulses if the GCR/cloud theory is correct, and the "peaks" should be cool/neutral phases for climate. Also keep in mind the warm forcing from GCR is not only the depth of the trough, but really the breadth/depth combination. However, using just peak/trough values, in the Moscow database the deepest trough is around 1990, the lowest peak is the one ending in 1998. Hence the greatest warming effect should have been in the 1990's for GCR if theory is correct, not as stated: a cooling effect since 1980. That brings us to the next point. The count clearly went back up since 2000, since the trough from 2000 to 2003 is clearly not as deep as the troughs in the count at 1982 and 1991. However, it does last longer so net forcing might still be high compared to other troughs. Since 2003 the count really bounced back up, the peak of 2009 being higher than any other in the record. However, keep in mind temperature has not really been increasing since 2000, so that does not invalidate the GCR/cloud hypothesis.
    0 0
  5. Klapper, you're trying to refute a statement about a long-term trend by cherry picking short-term data. If you read SkS regularly, you should know that's not a valid approach.
    0 0
  6. I have been on vacation the last week and am trying to sum up this latest non-scandal. It seems like a guy with limited (if any) scientific credentials violated his confidentiality agreement with IPCC by releasing draft text prematurely. And, the real punch line here is that he claims to have had a moral obligation to do so. I would think the real news story here is about this unethical individual breaching his contract with IPCC. Have I missed anything? I'll wait until September to read the final IPCC text.
    0 0
  7. My new paper 'Inverse Correlation with the Wearing of Hats with Global Warming' This is in Press and the data must remain secret. We note that there is a variation due to the libido of the hat/non hat wearer of both genders. We call this the southern libido oscillation. This can mask the true trend of Global Warming and lead to apparent quiescent states due to of loss of libido. We discuss melting of the heart and lack of judgment in choice of partner with or without hat. We thank the Mad Hatters for their financial support. In conclusion the wearing of more hats is the fundamental way to solve this problem. Bert
    0 0
  8. My previous post was a total joke! It was aimed at the ignorati who peddle drivel from other ignorati. I just used their recipe to make stuff up! we can always use a good laugh. Bert
    0 0
  9. With regard to whether or not there is significant “Svensmark” contribution to 20th century GW …… The IPCC, in repeated reports, consistently dismissed solar radiance as a factor … correctly …… but has, for 15 years, consistently ignored whether or not Sun varying magnetic field strength has modulated GCR input to Earth, & hence, low cloud cover/Earth temperature. CO2,CH4 (+ feedbacks) getting nearly all the cudos). Historically, the ‘Svensmark contribution‘ to CC has a lot going for it; ‘matching’ numerous (92%) CC events in the past millions of years, including more recent events such as the Ice Ages, the bronze age warming, Roman warming, MWP, LIA, the 35 year period of strong warming in the 1st half of the 20th century (just as strong as the warming in the last 35 years), the ~ 30 years of cooling - 1950-1978 ….. the Sun magnetic field strength again resuming it’s strong 20th century rise in 1978; a rise of > 100% over the last century (& the largest rise in at least the past 1,000 years) ….. but this rise petering out by the late 80’s ….. whilst Earth temperature has continued to increase ….. Thus, the Svensmark’s (partial) explanation of recent GW dismissed! Svensmark’s ‘cloud chamber experiments’ of 1997 & more recently, that showed a GCR connection to cloud formation were ‘poo-pooed’ …… CERN ‘proof’ being required. The long awaited (15 years) CERN #1 experiment eventually carried out last year & showed that GCR’s can indeed facilitate cloud nuclei formation ….. but in no way proving that the ‘Svensmark mechanism’ for CC is particularly relevant to large scale cloud formation/loss & significant effect on Earth temperature. A sigh of relief for the IPCC! However, far more conclusive evidence for Svensmark has come to light. Dragic, et al have taken a simple approach to proving/disproving Svensmark. They have analysed ‘diurnal temperature variation’ for 184 European weather stations over the last 50 years & compared this with 50 years of ‘muon counts’ (measured in Germany) during strong Solar flare events. We all recognise that on any given cloudy day, it’ll be cooler than a clear day, & similarly we all recognise that a cloudy night is warmer than a clear night. Guess what - for strong Solar flares a very strong correlation to Earth cloud cover (intuitively) proved! A few days after a strong Solar flare (lasting a couple of hours) Europe gets 0.38C hotter for a couple of days; after a very strong Solar flare, a couple of days later, Europe is 0.5C hotter for a couple of days. (the observed delay is the period for dissipation of existing clouds & reduced formation of replacement clouds) I have no idea what the correlation of a few hours of strong Solar flare activity producing a couple of days of significantly raised Earth temperature is ….. compared to decades of (100%) raised Sun magnetic field on diminished Earth cloud cover/raised Earth temperature – but i’d presume it to be also significant over most of the last century. Thus, I am reluctant to dismiss the Svensmark ‘mechanism’ for CC which has such a good historical record & is now proven to be an operative mechanism in cloud formation. Setting aside any contribution from CO2,CH4, are we perhaps missing something? We talk about GHG’s referring to (mainly) CO2 & CH4 & bringing in H2O (gas) as a climate forcing agent. Note that H2O as CLOUD is condensed water. CO2, CH4 have discrete absorption peaks which only account for a very small portion of Earth OLR absorption, whilst clouds REFLECT energy, this reflectance being a much, much larger factor in Earth energy balance as it operates over the FULL Earth OLR ….. Perhaps, even a small mechanism that affects cloud formation has a large ‘multiplier’ effect? Why have the World’s oceans, to a depth of 52 metres (at least), been in a cooling trend for two decades? And exhibited a huge thermal uptake & release of heat? – a cyclic temperature variation of 0.25C/11 years; this cycle in temperature far greater than any change in overall Earth temperature during this period & in accord with the Sun’s solar cycle. (SODA data) And why has there been considerably greater heating of just the northern hemisphere in the past couple of decades? & loss of Arctic ice whilst Antarctica has apparently being gaining 49Gt/annum recently, & overall, getting colder? The population & pollution in the northern hemisphere is far greater than in the southern hemisphere (whilst CO2 is the same everywhere). Could it be that settling pollution particles are turbidifying the surface water of the northern hemisphere oceans & thus trapping more Sun energy at the surface (AKA a farmer’s cloudy dam which looks inviting for a dip on a hot day – but is ‘brass monkeys’ when you break through the hot surface water), the top ½ metre or so of the ocean, this hotter water being in contact with the atmosphere & causing it to heat. With the turbid surface water trapping more energy, the Sun’s rays penetrate more weakly, explaining the temperature decline of the ocean over the last 20 years to a depth of 52 metres – roughly the depth of the penetrating power of the Sun’s rays ….. Just some thoughts for comment – whilst I continue to be a ‘fence sitter”
    0 0
  10. col8, taking your paragraphs one by one: 1. Not true. The IPCC has considered all of the scientific evidence on factors having potential to contribute to climate change/warming including all solar contributions that are under study in the scientific community. The significant number of papers published on real and potential GCR effects are all obviously considered in arriving at periodic IPCC assessments as inspection of the references cited in the IPCC reports shows. A major reason for rejecting the CRF effect as relevant for contemporary warming is that the CRF has trended in a slightly cooling direction as temperatures have risen markedly during the last 50 years. 2. You’ll need to provide some evidence for those assertions! There is very little evidence that the GCR component of the solar output is responsible for any apparent correlations between climate-related proxies and solar-related proxies. Since the solar effect of the CRF marches pretty much in lock-step with the other solar variabilities (solar irradiance, sunspot number, solar open flux etc.) any apparent correlation is just as likely to be due to the solar irradiance component of the solar variability. Obviously CRF variability cannot be relevant for contemporary warming since the CRF has trended in a slightly cooling direction as temperatures have risen markedly during the last 50 years 3. The cloud chamber experiments including the CERN CLOUD study have very little to say about the possibility for a GCR effect on Earth climate/surface temperature variability. The fact that high energy particles created in a particle accelerator can induce the condensation of potential nucleating species is not a particular surprising result, and doesn’t have very much at all to say about the possibility that CRF variations in the real world significantly affects cloud formation in a manner that is significant for long term and persistent changes in the climate/warming. 4. Dragic et al.’s data relates to apparent correlations between rare CRF spikes (Forbush Decreases or FD) and diurnal temperature range (DTR) in Europe. At least two groups have subsequently addressed Dragic’s interesting observation. Erlykin and Wolfendale cast some doubt on Dragic’s statistical analyses, but do find some evidence for a 13 day and/or 27 day lagged response of DTR to FD. These authors conclude that these weak correlations are more likely due to solar irradiance changes. There is also the problem that these lags (13 day) are really too long to be related to the putative CRF effect on cloud formation. Laken et al performed an analysis of 60 years worth of DTR and solar activity and found no evidence for the link purported by Dragic et al. Both groups show that some apparent correlation between solar activity (aka CRF but not necessarily so!) and DTR in subsets of data like that of Dragic et al. is likely to be found simply by chance. There are probably more than two dozen related analyses of the potential CRF climate/temperature link. The overall conclusion is that there is no decent evidence for supposing such a link is significant for climate/temperature variation in the real world. One needs to assess all of the scientific data and analyses (that’s what the IPCC do!) rather on relying on the occasional paper that conforms to a preferred view. And one should definitely look at the papers that cite your “preferred” paper, since if something is problematic, it will likely come to light subsequently. 5. But it can’t be significant since the warming of the last 50-odd years has occurred during a period when the CRF variation has been mildly in the cooling direction… 6. Looked at objectively, Svensmark’s “mechanism” has a pretty poor record in fact. etc ...
    0 0
  11. Pol8 "proved" and "intuitively" do not belong in the same sentence when talking about science. There is absolutely nothing new in what you presented.
    0 0
  12. Rawls has published a response to this post at WUWT (not linked). I noticed that his Cosmic Ray data only goes up to 2001. The graph appears similar to the one in the OP here because Dana used an 11 year average. A close examination of both graphs indicates in the last ten years the GCR count has gone down, the opposite of the effect Rawls claims. Several posters at WUWT have asked for a complete record of the GCR count, it will be interesting to see if Rawls posts one. WUWT does not allow posters to post graphs so I cannot post an up to date graph of GCR.
    0 0
  13. Aside from containing a few dozen ad hominem attacks and personal insults, Rawls' latest post is just an exercise in ignorance. By definition a change in temperature is caused by a change in forcing (dT = lambda*dF). Yes, there is a 'lag' and thermal inertia, but the solar forcing is too small for the temperature response to take more than 5-10 years. Rawls even admits as much, saying "The strongest temperature response to a change in solar forcing is seen with a lag of about ten years (Usoskin et al. 2005)". So how does Rawls figure we're still warming in response to the solar activity increase 60+ years ago? To be blunt, Rawls doesn't have a clue what he's talking about.
    0 0
  14. The oddest thing in Rawl's new post is his claim that:
    "When the peak level of forcing appears in the rearview mirror, the downward trend in the forcing that begins at that point does not cause cooling. It just causes warming to be a little less rapid. Only when the energy pouring into the climate system falls to the level of the energy escaping back out does the system stop warming. Empirically, that turns out to be mid-afternoon, mid-summer, and approximately the first decade of the 21st century."
    Analyzed logically, that means Rawls in predicting that warming from 1980-2010 (after the peak) will be less than warming from 1950-1980 (before the peak). You can check how that works out on figure 2 above. The simple fact is that the case for the solar origin of twentieth century warming is based on the close, non-lagged correlation between solar activity and temperatures - up till 1980. It is inconsistent to insist that the correlation is lagged post 1980, but not before. Yet if we do not lag it after 1980, the correlation fails, refuting the theory. Alternatively if we lag prior to 1980 so that the period after 1980 does not falsify the theory, the period prior to 1980 does. Rawls, very carefully keeps the two analyses separate to avoid that falsification; but such methods turn his theory into pseudo-science. Finally, there is a much simpler and more direct test of Rawl's hypothesis. If Rawl's is correct, from 1980, the Top Of Atmosphere energy balance should have declined to zero as solar forcing held steady while temperatures rose, driving up outgoing radiation. That would result in the surface heat content falling away towards a plateau. Instead, the rate at which heat has been absorbed by the Earth has increased: Once again, Rawl's only keeps his theory intact by carefully not examining the relevant data that could be used to test it.
    0 0
  15. Tom Curtis #114-That is an excellent point,and I would like to add to your comment: "Rawls, very carefully keeps the two analyses separate to avoid that falsification; but such methods turn his theory into pseudo-science." I would amend that to read "...such methods turn his theory into Pathological Science"
    0 0

Prev  1  2  3  

You need to be logged in to post a comment. Login via the left margin or if you're new, register here.


The Consensus Project Website

THE ESCALATOR

(free to republish)


© Copyright 2024 John Cook
Home | Translations | About Us | Privacy | Contact Us