


 Arguments


Ocean Temperature - Part 2
Posted on 19 July 2018 by Irek Zawadzki
Ocean Temperature – Part 2
We are coming back to the topic of sea-surface temperature measurements, which we have taken on in the article “Ocean Temperature – Part 1”. This time, we will discuss issues concerning satellite measurements.
Pictet Mirrors
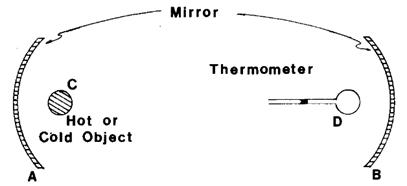
Figure 1: Pictet’s experiment with cold and warm emission. Source: Evans and Popp, 1984.
Around 1800, Marc-Auguste Pictet performed an experiment in Geneva, in which he showed that the temperature of a cold or hot object can be monitored remotely. His experiment is illustrated in Figure 1. Two mirrors, A and B, with a diameter of 40 centimetres and a focal length of 40 centimetres, were placed nearly 5 metres apart. When a cold object (a glass bulb filled with ice) was placed at the focus of mirror A, the temperature at point D immediately began to drop. This effect did not occur for a thermometer placed at any other point. This experiment still surprises a lot of people, even though few of them have trouble believing that a hot object in the focal point C would raise the temperature of the thermometer. Today we know that the experiment illustrates the propagation of infrared electromagnetic waves, rather than heat exchange produced by the mixing of air between mirrors. The experiment also shows that mirrors reflect and focus infrared radiation the same as light.
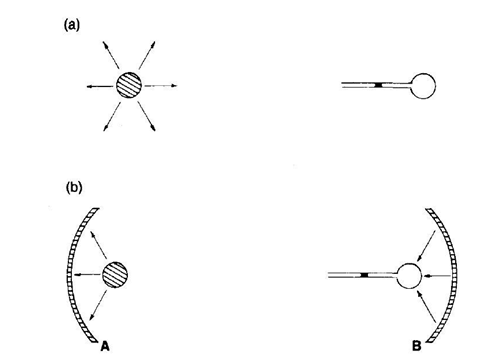
Figure 2: Explanation of Pictet’s experiment.
The experiment is further explained in Figure 2. Each body emits infrared radiation, which depends on its temperature and is usually equal in every direction. These rays are gathered and reflected by mirror A, which is made of a material that does not absorb infrared radiation. In an analogous process, mirror B then focuses the radiation.
One can imagine a number of complications in conducting this experiment. For example, the mirror can focus not only the radiation coming from the focal point C, but also other radiation emitted nearby. In this case, the measurement would not be a reflection of the change of the examined object’s temperature, but a product of the temperatures of this object and the surroundings. Furthermore, mirrors are never perfectly reflective. Also, the lower the intensity of radiation, the lower the sensitivity of such a measurement.
Satellite measurements in infrared and microwave frequency bands
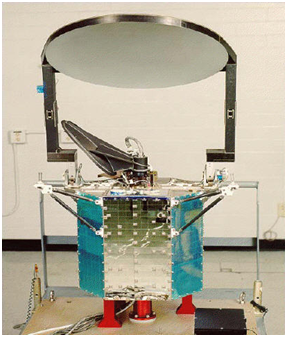
Figure 3: Special Sensor Microwave Imager/Sounder (SSMIS). Source: NSIDC.
Similar temperature estimation techniques based on the emitted radiation are currently used to make sea-surface temperature measurements using satellites orbiting the Earth. Figure 3 shows a satellite used for microwave radiation measurements. One of its components is a mirror that scans the Earth and focuses the incoming radiation onto a sensor that records the energy of the signal. We do not place another mirror on the ocean’s surface, of course, but instead of this, radiation is gathered from a large area. Sea-surface temperature measurements are made using infrared radiation with wavelengths between 3.7 and 12 micrometres, and microwave radiation with frequencies ranging from 6 to 200 GHz, which corresponds to wavelengths between 0.14 and 5 centimetres.
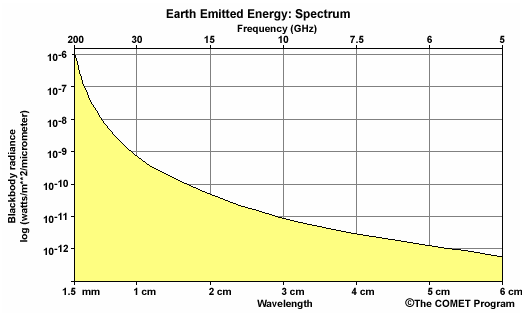
Figure 4: Relation of spectral flux density of irradiated energy to wavelength of microwave band. Source: The COMET Program.
For a given temperature, radiation emission decreases with increasing wavelength (Figure 4). Therefore, microwave sensing requires collecting information from a larger area of the ocean than infrared sensing. This makes it difficult to make high spatial resolution measurements of Earth’s surface in the microwave band (Figure 5).
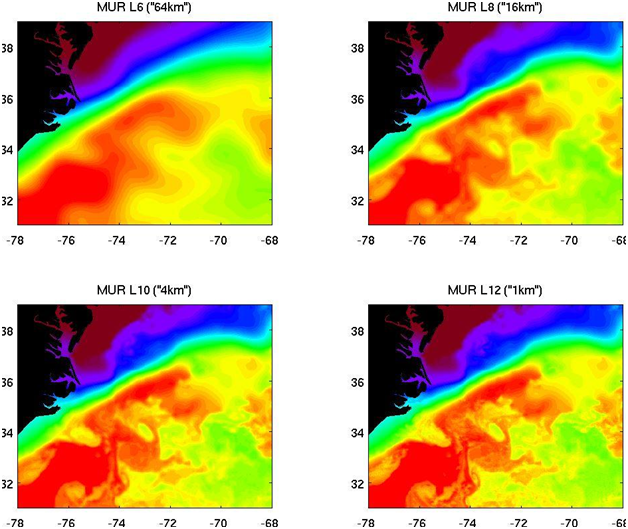
Figure 5: Images show the details of sea-surface temperature distributions depending on the resolution of satellite measurements. In infrared, the resolution is significantly higher (1 km) than for microwave measurements (around 25 km).
Atmospheric windows
Just as in Pictet’s experiment, the surroundings may influence satellite temperature measurements through emission of radiation by other sources than the ocean itself. Such effects are related to the radiation of clouds, of particles suspended in the air, and the radiation emission of gases that constitute the air. This occurs even though SST measurements are performed at wavelengths known as “atmospheric windows,” at which the atmosphere absorbs (and emits) little radiation. The problem of how to determine temperature based on measurements in different wavelengths is complex and requires the introduction of atmospheric corrections and comparisons to direct measurements; in other words, satellite algorithms based on the laws of physics (the equation of radiative transfer) are empirically corrected based on direct measurements in the same time and place. This is called parameterisation of the relation between observed temperature and satellite estimates. In essence, temperature Tb, measured in space, depends not only on ocean temperature Ts and its emissivity e, but also on an atmospheric correction and on the reflection of radiation in the ocean-atmosphere system. This is illustrated in Figure 6.
Tb=e⋅Ts+Tatmospheric contribution +Treflection from ocean and atmosphere
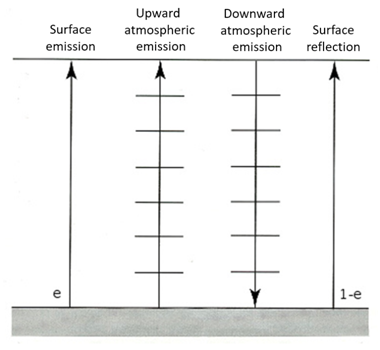
Figure 6: Contributions to temperature measured at the top of the atmosphere (upward arrows): (i) from direct emission by ocean surface; (ii) from direct emission by atmosphere; and (iii) from the reflection of incoming radiation. Source: K. N. Liou, An Introduction to Atmospheric Radiation.
Satellite measurements of sea surface temperature are also affected by cloud droplets and rain. Cloud droplets are around 10 microns in diameter, which means that they are small enough for the microwave radiation to only be slightly disturbed by the presence of clouds. However, this changes when it starts to rain, as raindrops can be as big as one millimetre in diameter, and they scatter microwave radiation. In infrared, the size of cloud droplets is comparable with the wavelengths used for measurements (around 10 micrometres), which is why infrared radiation cannot be used to measure sea surface temperature in the presence of clouds nor rain.
Physical properties of water
It is worth mentioning, at least briefly, the physical properties of seawater, because they determine the quality of satellite measurements. For infrared waves, the information about temperature comes from the depth of a dozen or so microns below the air-ocean interface – the skin depth of the ocean. Radiation with infrared wavelengths of 3.7–12 micrometres is strongly absorbed by water. The situation is similar in the microwave band – waves with a frequency of 6–200 GHz penetrate water to a depth of around 1 millimetre below the air-ocean interface. Figure 7 shows how the loss of intensity depends on the depth; you can see that visible light penetrates water much deeper than infrared or microwave radiation.
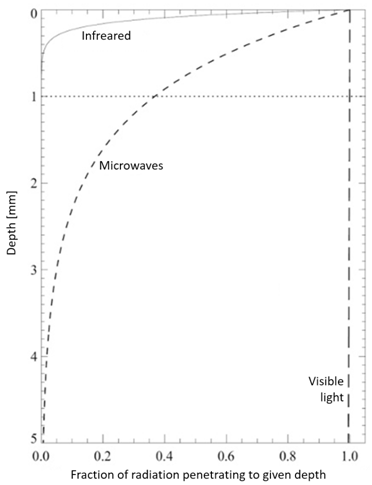
Figure 7: Intensity of absorption for electromagnetic waves of different wavelengths.
Another physical parameter of water is its emissivity. It defines how “black” water is for a given wavelength. It turns out that if we were able to see in infrared, water would be almost completely black, and in microwaves, it would look like a dirty mirror, because water has low emissivity in the microwave band.
Algorithms, calibration, systematic errors
Sea surface temperature estimation from satellite data is a so-called reversible process; it is not a direct measurement. Algorithms for calculating temperature from satellite measurements are often based on radiative transfer equations, but they also strongly rely on the calibration of data with direct measurements and techniques of approximate inversion of complex mathematical equations. Although satellite measurements have the remarkable advantage of global coverage, they also have some significant downsides. Satellite measurements are not continuous, and a typical satellite’s lifespan is a couple of years, after which it needs to be replaced. For this reason, climatological data series based on satellite measurements, which by their nature span a long time, are not accurate and demand caution in their interpretation. Sometimes a new generation satellite has a similar instrument as its predecessor on board, as is in the case of the American instrument Advanced Very High Resolution Radiometer (AVHRR), but the interpretation of data spanning many years of measurements still requires caution due to the difficulties with calibration and the gradual degradation of sensors. Some instruments of new generations have been designed with climate measurements in mind. One such instrument is the Along-Track Scanning Radiometer (ATSR), but for now, its measurements cover a relatively short period of time. On the other hand, satellite temperature measurements play the central role in weather forecasting, oceanic phenomena analysis and seasonal phenomena forecasting.
Final remarks
It could be seem that the progress from temperature measurements in water buckets to drifting buoys is so enormous that further advancements of measurement techniques are not necessary anymore. Even so, life still calls for new solutions – sometimes required by new technologies, sometimes by the mundane reality of politics and economy. For example, in recent years, it has become dangerous to deploy buoys around the Horn of Africa because of groups of armed pirates operating in these waters. In some regions, drifters are quickly caught and destroyed by fishermen. Satellite programmes are discontinued for lack of funding or because of the cuts to complex research programme funding introduced by politicians.
Despite all that, climate research obviously continues. For example, atmospheric physicists and oceanographers who conduct observations in equatorial Pacific have formed a group “Tropical Pacific Observing System,” and are actively planning future sea surface temperature measurements. One of the group’s recommendations is to create an observational network based on direct measurements with low systematic error instruments; for example, they call for the improvement of thermistors used in drifters, so that measurements do not depend on how long a drifter has been in water. They also suggest new research challenges: understanding diurnal temperature variations should be an important element of the research, because we do not know whether night-time measurements are sufficiently representative. The group argues that direct measurements should be conducted in cloudy and rainy regions, because satellite measurements are difficult or even impossible. Temperature-measurement planning also includes the development of new measurement techniques. One of them is the system called Argo, which became fully functional quite recently, in 2006. It consists of floats, which are auto-submersible buoys that spend the majority of the time at a depth of 1000 metres, where the influence of drift is relatively small. Once every 10 days, the floats ascend to the surface of the ocean, measuring temperature and salinity during their ascent. The measurements are currently stopped about a half a metre before the floats reach the ocean’s surface to prevent forming a polluting deposit on the sensors. During the short period on the surface, they transmit data to a satellite. Scientists also call for a certain percentage of Argo measurements to be made using a much shorter cycle, which would allow us to understand the changes of the ocean temperature throughout the day.
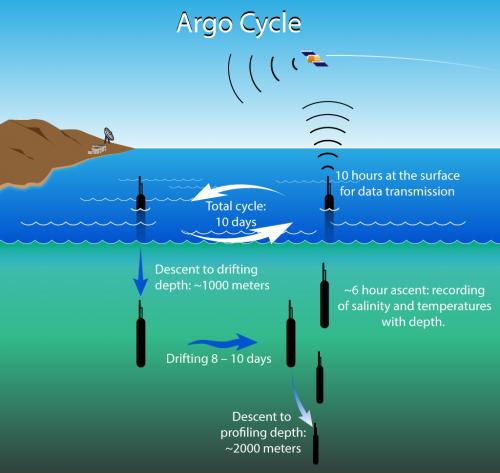 Figure 8: Argo system. Floats ascend from the depths every 10 days, collecting data on water temperature and salinity during the ascent. During the short period on the surface, they transmit data to a satellite. Source: Argo.
Another measurement system under consideration is the use of autonomous sailboats, known as sailing drones, like the prototype shown in Figure 9. They can make measurements on large areas of the ocean and are less susceptible to drift.
It is hard to predict what the future will bring, but it is worth doing the preparatory research well in advance, because complex research projects require over a decade of advanced planning for satellite-based projects, and multiple years of advanced planning for ground-based projects.
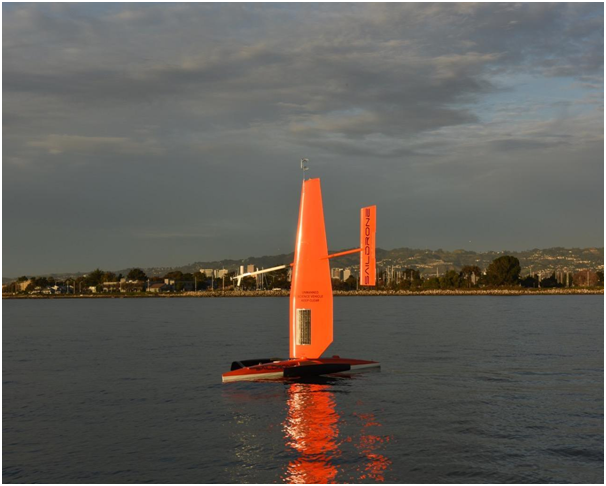
Figure 9: Photograph of a prototype sailing drone for meteorological and ocean measurements. Source: Saildrone.
Piotr J. Flatau, University of California, San Diego
Further reading
Carella et al. (2017) “Measurements and models of the temperature change of water samples in Sea Surface Temperature buckets.” Quarterly Journal of the Royal Meteorological Society.
Jones (2016). “The reliability of global and hemispheric surface temperature records.” Advances in Atmospheric Sciences 33.3 (2016): 269-282.
Kennedy (2014) “A review of uncertainty in in situ measurements and data sets of sea surface temperature.” Reviews of Geophysics 52.1 (2014): 1-32.
Kent et al. (2010) “Effects of instrumentation changes on sea surface temperature measured in situ.” Wiley Interdisciplinary Reviews: Climate Change 1.5 (2010): 718-728.
Reverdin et al. (2010) “Temperature measurements from surface drifters.” Journal of Atmospheric and Oceanic Technology 27.8 (2010): 1403-1409.
The original article was written by Pjotr J. Flatau from the University of California San Diego (UCSD) for our Polish partner site Nauka o Klimacie and Juliusz P. Braun translated it into English. You can access the original article by clicking on the logo:![]()


Comments