


 Arguments


The Beginners Guide to Representative Concentration Pathways - Part 1
Posted on 26 August 2013 by gpwayne
This post is part 1 of a three part series exploring the Representative Concentration Pathway (RCP) scenarios that have replaced the IPCC Special Report on Emission Scenarios (SRES). An on-line resource of this guide is now available here: www.skepticalscience.com/rcp.php
The complete guide can also be downloaded as a PDF by clicking here.
Introduction
Many factors have to be taken into account when trying to predict how future global warming will contribute to climate change. The amount of future greenhouse gas emissions is a key variable. Developments in technology, changes in energy generation and land use, global and regional economic circumstances and population growth must also be considered.
So that research between different groups is complementary and comparable, a standard set of scenarios are used to ensure that starting conditions, historical data and projections are employed consistently across the various branches of climate science.
The Intergovernmental Panel on Climate Change (IPCC ) Fifth Assessment Report (AR5) is due for publication in 2013-14. Its findings will be based on a new set of scenarios that replace the Special Report on Emissions Scenarios (SRES) standards employed in two previous reports. The new scenarios are called Representative Concentration Pathways (RCPs). There are four pathways: RCP8.5, RCP6, RCP4.5 and RCP2.6 - the last is also referred to as RCP3-PD. (The numbers refer to forcings for each RCP; PD stands for Peak and Decline).
"The name “representative concentration pathways” was chosen to emphasize the rationale behind their use. RCPs are referred to as pathways in order to emphasize that their primary purpose is to provide time-dependent projections of atmospheric greenhouse gas (GHG) concentrations. In addition, the term pathway is meant to emphasize that it is not only a specific long-term concentration or radiative forcing outcome, such as a stabilization level, that is of interest, but also the trajectory that is taken over time to reach that outcome. They are representative in that they are one of several different scenarios that have similar radiative forcing and emissions characteristics".
Source: IPCC Expert Meeting Report, Towards New Scenarios For Analysis Of Emissions, Climate Change, Impacts, And Response Strategies, IPCC 2007
This guide to Representative Concentration Pathways assumes no prior knowledge.
In Part 1 we explore their historical background, explain why scenarios are necessary, and who uses them. Readers already familiar with the background may wish to skip this section.
Part 2 starts with an examination of the demand for new scenarios, and why they were deemed necessary. The aims and requirements of stakeholders are described, how the development teams were selected, and the process by which the RCPs were created, checked and validated.
In Part 3 we take a look at the scenarios in detail, consider the technical aspects, the differences between the four RCPs, and how they compare to earlier SRES scenarios.
Part 1: An introduction to scenarios
Why are scenarios necessary?
“Scenarios of different rates and magnitudes of climate change provide a basis for assessing the risk of crossing identifiable thresholds in both physical change and impacts on biological and human systems”.
Source: “Towards New Scenarios for Analysis of Emissions, Climate Change, Impacts, and Response Strategies”, IPCC Technical Summary, 2007
There are many climate modelling teams around the world. If they all used different metrics, made different assumptions about baselines and starting points, then it would be very difficult to compare one study to another. In the same way, models could not be validated against other different, independent models, and communication between climate modelling groups would be made more complex and time-consuming.
Another problem is the cost of running models. The powerful computers required are in short supply and great demand. Simulation programming that had to start from scratch for each experiment would be wholly impractical. Scenarios provide a framework by which the process of building experiments can be streamlined.
In order to address these issues, in 1992 the Intergovernmental Panel on Climate Change (IPCC) published the first set of climate change scenarios, called IS92. In year 2000 the IPCC released a second generation of projections, collectively referred to as the Special Report on Emissions Scenarios (SRES). These were used in two subsequent reports; the Third Assessment Report (TAR) and Assessment Report Four (AR4) and have provided common reference points for a great deal of climate science research in the last decade.
In 2007, the IPCC responded to calls for improvements to SRES by catalysing the process that produced the Representative Concentration Pathways (RCPs). The RCPs are the latest iteration of the scenario process, and are used in the next IPCC report - Assessment Report Five (AR5) in preference to SRES. Here’s how the IPCC describes the scenarios (emphasis added):
“In climate change research, scenarios describe plausible trajectories of different aspects of the future that are constructed to investigate the potential consequences of anthropogenic climate change. Scenarios represent many of the major driving forces - including processes, impacts (physical, ecological, and socioeconomic), and potential responses that are important for informing climate change policy. They are used to hand off information from one area of research to another (e.g., from research on energy systems and greenhouse gas emissions to climate modeling). They are also used to explore the implications of climate change for decision making (e.g., exploring whether plans to develop water management infrastructure are robust to a range of uncertain future climate conditions). The goal of working with scenarios is not to predict the future but to better understand uncertainties and alternative futures, in order to consider how robust different decisions or options may be under a wide range of possible futures”.
Source: IPCC Scenario Process for AR5
Who uses climate scenarios?
There are several primary groups who study the effects of climate change. Climate Model (CM) groups study the effects of global warming on the climate itself and how our emissions affect the environment. Integrated Assessment Model (IAM) groups combine information from diverse fields of study, primarily to assess the relationship between emissions and socio-economic scenarios. A third group studies Impacts, Adaptation and Vulnerabilities (IAV), often at regional scales, drawing on disciplines and research traditions including social sciences, economics, engineering, and the natural sciences.
This graphic from the IPCC shows the relationships between the various groups, and their main areas of exploration:
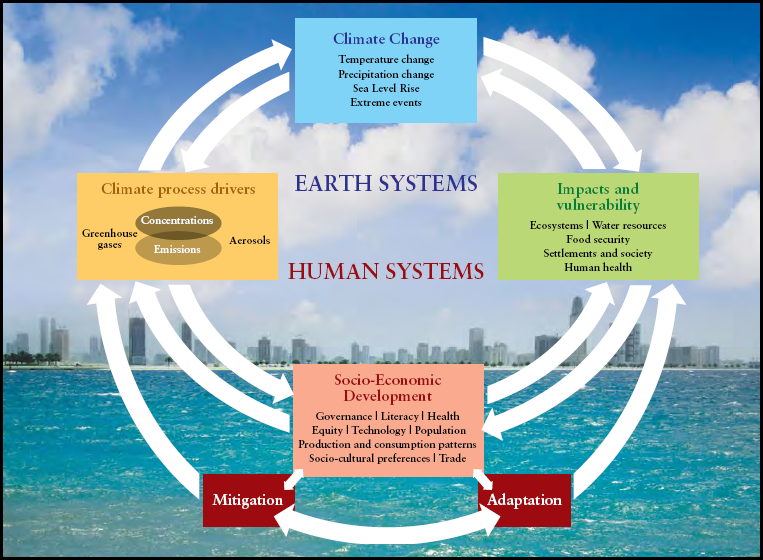
Figure 1. From the IPCC Expert Meeting Report: Towards New Scenarios - Technical Summary
As well as the groups mentioned above, scenarios are used extensively by scientists, policy makers, NGOs and commentators as a common framework through which they can discuss climate change, exchange ideas and communicate with each other effectively.
What do RCPs Consist Of?
A RCP scenario basically consists of numbers - a prodigious amount of them. RCP data is in tables - if you’re familiar with a spreadsheet, the format is somewhat similar.
For each category of emissions, an RCP contains a set of starting values and the estimated emissions up to 2100, based on assumptions about economic activity, energy sources, population growth and other socio-economic factors. (The data also contain historic, real-world information). While socio-economic projections were drawn from the literature in order to develop the emission pathways, the database does not include socio-economic data.
Modellers download the database sets to initialise their models, which jump-starts what would otherwise be a very lengthy process - one that each modelling team would have to attempt, thus duplicating effort. RCPs and previous scenarios were created exactly to avoid such duplication, and the inevitable initialisation inconsistencies that would ensue.
A quick look at the RCP database screenshot below shows how many emissions categories are addressed by the RCPs. Each RCP contains the same categories of data, but the values vary a great deal, reflecting different emission trajectories over time as determined by the underlying socio-economic assumptions (which are unique to each RCP).
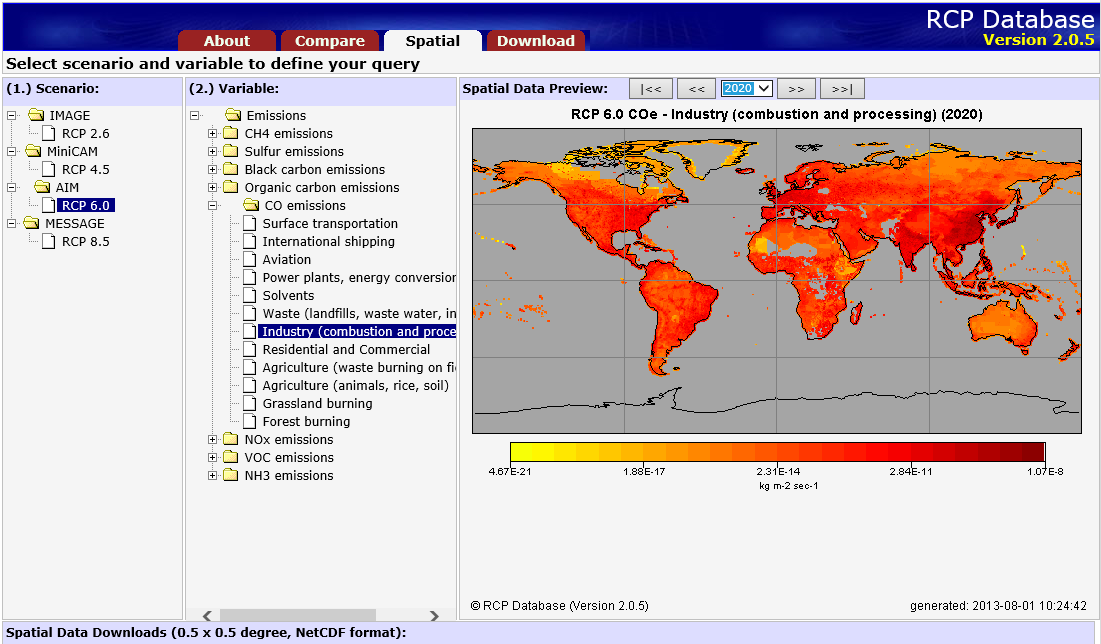
Figure 2: RCP on-line database showing RPC6 spatial data for industry CO2e emissions for the year 2020. (Click here to see full-sized image in a new window)
High-resolution data is generated for a world divided into ‘cells’ measuring half a degree of latitude and longitude - 518,400 cells in total. The RCP database web interface provides only a preview of the data, which can comprise far more detail than a graphic can show. It is, however, a starting point for researchers, who can evaluate the data graphically before downloading it. (As an alternative, the Compare option allows researchers to plot a graph of trajectories for all four RCPs - some the graphs shown later in this guide were produced using the RCP on-line facility).
For example, here are two graphic representations of RCP6 spatial CO2e emissions for the years 2010 and 2100:
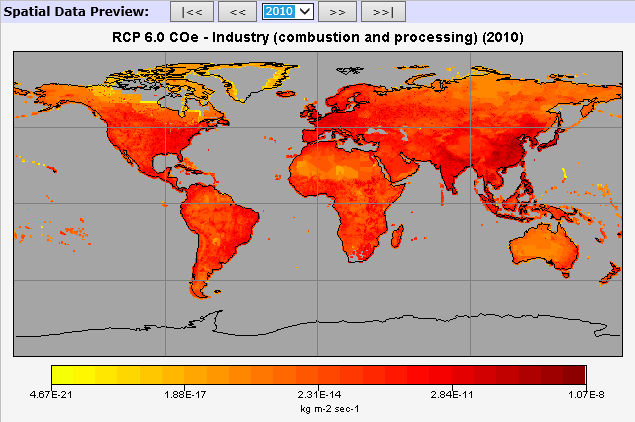
Figure 3: RCP on-line database graphic showing RPC6 spatial data for industry CO2e emissions for the year 2010…
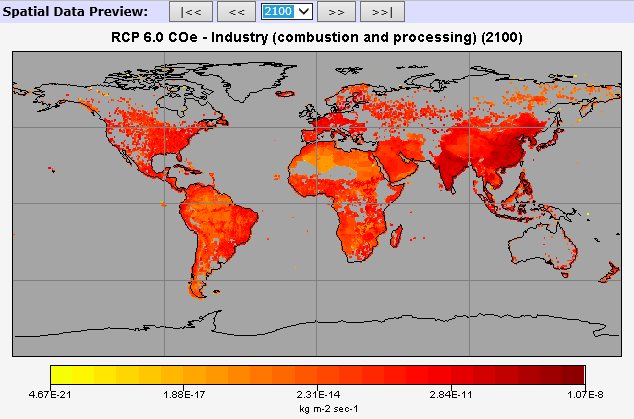
Figure 4: …and here’s the comparison graphic showing the projected RCP6 emissions in the year 2100.
By using the all the data available for the intervening years, a trajectory can be given for any specific emissions. Each RCP plots a different emissions trajectory (pathway) and cumulative emission concentration in 2100.
The deliverable is a download from a central repository. Scientists can preview and download data on emissions, concentrations, radiative forcing and land use, in regional and gridded form, following different trajectories over similar timescales. These data sets can then be incorporated into any modelling exercise, providing consistent parameters for each emissions trajectory, and a consistent foundation for all climate modelling teams anywhere in the world.
The database is also open to the public and can be accessed without charge using any browser.
An on-line resource of this guide is now available here: www.skepticalscience.com/rcp.php
The guide can also be downloaded as a PDF by clicking here.


Comments