


 Arguments


Explaining climate change science & rebutting global warming misinformation
Global warming is real and human-caused. It is leading to large-scale climate change. Under the guise of climate "skepticism", the public is bombarded with misinformation that casts doubt on the reality of human-caused global warming. This website gets skeptical about global warming "skepticism".
Our mission is simple: debunk climate misinformation by presenting peer-reviewed science and explaining the techniques of science denial, discourses of climate delay, and climate solutions denial.


How big insurance’s investment in fossil fuels came back to bite it
Posted on 12 February 2025 by Guest Author
This story was originally published by Capital & Main and is part of Covering Climate Now, a global journalism collaboration strengthening coverage of the climate story.
Within just a week, the sheer devastation of the Los Angeles wildfires has pushed to the fore fundamental questions about the impact of the climate crisis that have been largely avoided by lawmakers, influencers and the public.
Among them: What is the future of insurance when people’s homes are increasingly located in areas of climate risk — whether wildfires, hurricanes, flooding or the rising sea levels?
Those questions have bedeviled policy makers in California — where insurance giants like State Farm, Farmers, and Allstate announced last year that they were no longer writing new policies in the state due to the surge in wildfires (in 2024 alone, firefighters across the state battled 8,024 wildfires that burned more than 1 million acres and destroyed 2,148 houses and other structures).
Insurers have long been aware of the risk of climate change — rising premiums, increasing losses. In 1973, the German insurance firm Munich Re published a brochure on flooding that it claims was the first use of the term “climate change” in the industry, warning of the growing risk of rising temperatures and increased carbon dioxide in the air. Some 40 years later, the CEO of French insurance giant AXA said it would be impossible to insure a world that is 4 degrees Celsius (7.2 Fahrenheit) warmer.
Nonetheless, insurance companies have become some of the biggest financiers of fossil fuels, which are the primary cause of climate change — the extraction and burning of oil, gas, and coal are responsible for over 75% of greenhouse gas emissions and nearly 90% of carbon dioxide emissions.
Fossil fuel companies made up 4.4% of the investment portfolio of the insurance industry in 2023, up from 3.8% nine years earlier. Two insurance giants, Berkshire Hathaway and State Farm, increased their fossil fuel positions by around $200 billion in that period. Overall, however, more than half of the country’s 238 property and casualty insurers recently surveyed by the Wall Street Journal have reduced their investments in oil, gas, and coal over the past decade. But while insurers around the world have restricted their coverage of fossil fuel projects, U.S. companies continue to write policies for conventional oil and gas projects.
Spokespersons for State Farm and Berkshire Hathaway did not respond to requests for comment.
Sabin 33 #15 - Does EM radiation from wind turbines pose a threat to human health?
Posted on 11 February 2025 by BaerbelW
On November 1, 2024 we announced the publication of 33 rebuttals based on the report "Rebutting 33 False Claims About Solar, Wind, and Electric Vehicles" written by Matthew Eisenson, Jacob Elkin, Andy Fitch, Matthew Ard, Kaya Sittinger & Samuel Lavine and published by the Sabin Center for Climate Change Law at Columbia Law School in 2024. Below is the blog post version of rebuttal #15 based on Sabin's report.
Multiple studies have found that the electromagnetic fields (EMFs) generated by wind turbines are lower than those generated by most common household appliances and that they easily meet rigorous international safety standards (McCallum et al. 2014, Alexias et al. 2020, Karanakis et al. 2021). For context, the average home that is not located near power lines has a background level EMF of roughly 0.2 µT1. However, this value varies greatly depending on proximity to certain household appliances1. For example, from a distance of 4 feet, an electric can opener’s EMF is 0.2 µT, but this value increases to 60 µT from a distance of 6 inches2. A 2020 academic study found that the EMF generated by turbines are approximately 0.44 µT at a distance of 1 meter but less than 0.1 µT at a distance of 4 meters, as shown below (Alexias et al. 2020).
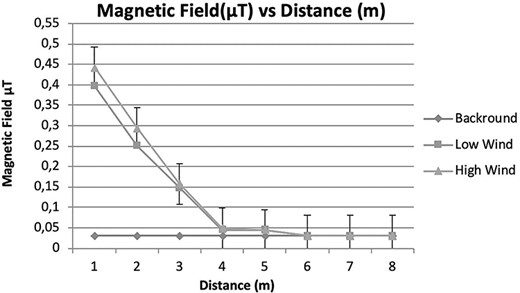
Figure 10: The EMF level, measured in microtesla (µT), is shown to drop dramatically with increase in distance from source. Source: Alexias et al. (2020)
These EMF levels are not dependent on wind speeds.
Climate Adam: Is it Game Over for the 1.5 Degree Climate Limit?
Posted on 10 February 2025 by Guest Author
This video includes personal musings and conclusions of the creator climate scientist Dr. Adam Levy. It is presented to our readers as an informed perspective. Please see video description for references (if any).
Wherever you look, you'll hear headlines claiming we've passed 1.5 degrees of global warming. And while 2024 saw record breaking climate change, this might not actually be true. So what does the 1.5 degree limit actual mean for the climate? Have we already passed this global warming threshold? And what do we do now, to combat climate change?
Support ClimateAdam on patreon: https://patreon.com/climateadam
2025 SkS Weekly Climate Change & Global Warming News Roundup #06
Posted on 9 February 2025 by BaerbelW, Doug Bostrom, John Hartz
This week's roundup is again published soleley by category. We are still interested in feedback to hone the categorization, so if you spot any clear misses and/or have suggestions for additional categories, please let us know in the comments. Thanks!
Stories we promoted this week, by category:
Climate Change Impacts
- Marshall Islands` vanishing kit for a team under threat from climate crisis The isolated Pacific nation is trying to build its first football team amid a battle for survival against rising sea levels by Niall McVeigh, The Guardian, Feb 02, 2025
- January sets an unexpected temperature record Despite long-faded El Niño conditions, 2025 saw the warmest January on record by Zeke Hausfather, The Climate Brink, Feb 02, 2025
- Climate change puts African cocoa production under pressure by Wageningen University, Phys.org, Feb 03, 2025
- Half a degree rise in global warming will triple area of Earth too hot for humans, scientists warn by King's College London, Phys.org, Feb 04, 2025
- Guest post: How climate change is causing `ecological grief` for farmers in Ghana Mental health problems induced, in part, by climate change are becoming increasingly common as the world warms, including the number of people experiencing “ecological grief”. by Carbon Brief Staff, Carbon Brief, Feb 04, 2025
- Deaths of 30,000 fish off WA coast made more likely by climate change, research finds Analysis drawing on satellite data and 13 climate models concludes that global heating makes marine heatwaves 20 times more likely by Petra Stock, The Guardian, Feb 04, 2025
- Mapped: How `natural` world heritage sites are threatened by climate extremes “Natural” world heritage sites, such as the Galápagos Islands, Serengeti national park and Great Barrier Reef, could be exposed to multiple climate extremes by the end of the century, researchers warn. by Ayesha Tandon, Carbon Brief, Feb 05, 2025
- Third of Earth's Landmass Could Soon Be Too Hot For Over 60s by Kelly McNamara, Environment, AFP/Science Alert. Feb 5, 2025, Feb 5, 2025
- New Research Led by James Hansen Documents Global Warming Acceleration The rapid meltdown of polar ice could shut down a key ocean current by 2050, triggering catastrophic surges of sea level rise along the U.S. East Coast and dangerous climate shifts in northwestern Europe. by Bob Berwyn, Science, Inside Climate News, Feb 4, 2025
Climate Change Mitigation and Adaptation
- What's the deal with enhanced rock weathering to store CO2? A conversation with scientist Zeke Hausfather. by David Roberts, Volt, Feb 7, 2025
Fact brief - Is methane the largest driver of recent global warming?
Posted on 8 February 2025 by Guest Author
![]() Skeptical Science is partnering with Gigafact to produce fact briefs — bite-sized fact checks of trending claims. This fact brief was written by Sue Bin Park from the Gigafact team in collaboration with members from our team. You can submit claims you think need checking via the tipline.
Skeptical Science is partnering with Gigafact to produce fact briefs — bite-sized fact checks of trending claims. This fact brief was written by Sue Bin Park from the Gigafact team in collaboration with members from our team. You can submit claims you think need checking via the tipline.
Is methane the largest driver of recent global warming?
 Methane only accounts for 20-30% of recent warming, while human-made CO2 remains the dominant driver of recent climate change.
Methane is a potent greenhouse gas significantly more effective at trapping heat than CO2; however, there is approximately 220 times more CO2 than methane in our atmosphere. Methane is also significantly shorter-lived, with an atmospheric lifetime of around a decade in comparison to CO2 lasting for centuries.
Human activity contributes over two-thirds of methane emissions, mainly via agriculture and livestock, fossil fuel extraction, and landfills. Methane levels have risen 2.7 times above pre-industrial levels.
Large amounts of methane are also trapped in permafrost. As permafrost thaws in rising temperatures, the released methane’s greenhouse effect creates a feedback loop that melts more permafrost and further accelerates warming.
While methane plays a role in global warming, CO2 remains the primary driver of current climate change.
Go to full rebuttal on Skeptical Science or to the fact brief on Gigafact
This fact brief is responsive to quotes such as the one highlighted here.
Sources
International Energy Agency Methane and Climate Change
NASA Methane
Copernicus Greenhouse gas concentrations
The Salata Institute at Harvard University Thawing permafrost: what does it mean? And what can be done?
Skeptical Science New Research for Week #6 2025
Posted on 6 February 2025 by Doug Bostrom, Marc Kodack
Open access notables
Doing better rather than promising more: A basic principle applicable to both climate modelling and climate policies, Douville, PLOS Climate:
A growing number of scientists are expressing concerns about the inadequacy of climate change policies. Fewer are questionning the dominant climate modelling paradigm and the IPCC’s success to prevent humanity from venturing unprepared into hitherto unknown territories. However, in view of an urgent need to provide readily available data on constraining uncertainty in local and regional climate change impacts in the next few years, there is a debate on the most suitable path to inform both mitigation and adaptation strategies. Examples are given how both common statistical methods and emerging technologies can be readily used to exploit the wealth of existing knowledge to drive adaptation policy. Parsimonious and equitable approaches on constraining uncertainty are promoted that combine various lines of evidence, including model diversity, large ensembles, storylines, and novel statistical methods applied on well-calibrated, global and regional, Earth System simulations, to deliver more reliable climate information. As examplified by the Paris agreement on desirable global warming targets, it is argued that the display of unrealistic ambitions may not be the best way for climate modellers to accomplish their long-term objectives, especially given the growing consensus on climate emergency and the allocated short time for the knowledge to be delivered and applied.
Mortality impacts of the most extreme heat events, Matthews et al., Nature Reviews Earth & Environment
In this Review, we link physical climate science with heat mortality risk, including crossings of uncompensable thresholds (beyond which human core body temperature rises uncontrollably) and unsurvivable thresholds (lethal core temperature increase within 6 h). Uncompensable thresholds (wet-bulb temperatures ~19–32 °C) depend strongly on age and the combination of air temperature and relative humidity. These thresholds have been breached rarely for younger adults (~2.2% of land area over 1994–2023) but more widely for older adults (~21%). Unsurvivable thresholds (wet-bulb temperatures ~20–34 °C) were only exceeded for older adults (~1.8% of land area). Anthropogenic warming will lead to more frequent threshold crossings, including tripling of the uncompensable land area for young adults if warming reaches 2 °C above preindustrial levels. Interdisciplinary work must improve the understanding of the deadly potential of unprecedented heat and how it can be reduced. Ensuring reliable access for all to cool refugia is an urgent priority as the atmosphere threatens to increasingly overwhelm human physiology under climate warming.
Global water gaps under future warming levels, Rosa & Sangiorgio, Nature Communications:
Understanding the impacts of climate change on water resources is crucial for developing effective adaptation strategies. We quantify “water gaps”, or unsustainable water use – the shortfall where water demand exceeds supply, resulting in scarcity. We quantify baseline and future water gaps using a multi-model analysis that incorporates two plausible future warming scenarios. The baseline global water gap stands at 457.9 km3/yr, with projections indicating an increase of 26.5 km3/yr (+5.8%) and 67.4 km3/yr (+14.7%) under 1.5 °C and 3 °C warming scenarios, respectively. These projections highlight the uneven impact of warming levels on water gaps, emphasizing the need for continued climate change mitigation to alleviate stress on water resources. Our results also underscore the unequal adaptation needs across countries and basins, influenced by varying warming scenarios, with important regional differences and model variability complicating future projections. Robust water management strategies are needed to tackle the escalating water scarcity caused by global warming.
Email outreach attracts the US policymakers’ attention to climate change but common advocacy techniques do not improve engagement, Loria et al., Communications Earth & Environment:
One of the most challenging aspects of climate change mitigation today is not identifying solutions but reaching political leaders with climate scientists’ existing solutions. Although there is substantial research on climate change communication, research rarely focuses on one of the most impactful groups: policymakers. It is essential to test theoretically sound methods to increase lawmakers’ attention to research evidence. In a series of four rapid-cycle randomized controlled email trials (N = 6642–7620 per trial), we test three common and theoretically derived advocacy tactics to increase U.S. policymaker engagement with a climate change fact sheet sent via email (i.e., a norms manipulation, a number focused manipulation, and emotional language manipulation). In all four trials, the control message increased engagement more than messages using advocacy tactics, measured by fact sheet clicks. This demonstrates the importance of testing communication methods within the appropriate populations, especially a population with considerable influence over climate policy.
Calculations of extreme sea level rise scenarios are strongly dependent on ice sheet model resolution, Williams et al., Communications Earth & Environment:
The West Antarctic Ice Sheet (WAIS) is losing ice and its annual contribution to sea level is increasing. The future behaviour of WAIS will impact societies worldwide, yet deep uncertainty remains in the expected rate of ice loss. High-impact low-likelihood scenarios of sea-level rise are needed by risk-averse stakeholders but are particularly difficult to constrain. Here, we combine traditional model simulations of the Amundsen Sea sector of WAIS with Gaussian process emulation to show that ice-sheet models capable of resolving kilometre-scale basal topography will be needed to assess the probability of extreme scenarios of sea-level rise. This resolution exceeds many state-of-the-art continent-scale simulations. Our ice-sheet model simulations show that coarser resolutions tend to project a larger range of sea-level contributions than finer resolutions, inflating the tails of the distribution. We therefore caution against relying purely upon simulations 5 km or coarser when assessing the potential for societally important high-impact sea-level rise.
Increased crevassing across accelerating Greenland Ice Sheet margins, Chudley et al., Nature Geoscience:
Here we use high-resolution digital elevation models to map the three-dimensional volume of crevasse fields across the Greenland Ice Sheet in 2016 and 2021. We show that, between the two years, large and significant increases in crevasse volume occurred at marine-terminating sectors with accelerating flow (up to +25.3 ± 10.1% in the southeast sector), while the change in total ice-sheet-wide crevasse volume was within measurement error (+4.3 ± 5.9%). The sectoral increases were offset by a reduction in crevasse volume in the central west sector (−14.2 ± 3.2%), particularly at Sermeq Kujalleq (Jakobshavn Isbræ), which exhibited slowdown and thickening over the study period. Changes in crevasse volume correlate strongly with antecedent discharge changes, indicating that the acceleration of ice flow in Greenland forces significant increases in crevassing on a timescale of less than five years. This response provides a mechanism for mass-loss-promoting feedbacks on sub-decadal timescales, including increased calving, faster flow and accelerated water transfer to the bed.
From this week's government/NGO section:
Drill, Baby, Drill? The Well of Public Opinion Is Drying Up on Trump’s Climate Policy, Eva Brungard, Data for Progress
In response to Trump’s reversal of federal climate policy, the author surveyed likely voters about their opinion of Trump’s executive orders and support for fossil fuels versus renewable energy. The findings reveal little support for the shift in energy policy, with the majority of voters hoping to preserve existing climate policies and to continue to develop renewables. Overall, an overwhelming majority (70%) of voters support taking action to address climate change. This includes a majority of both Republicans (54%) and Independents (74%). The highest support is among young voters (81%) – those under 35 – and Democrats (87%). Majorities across every demographic group tested support taking action to address climate change.
Climate Change in the American Mind: Politics & Policy, Fall 2024, Leiserowitz et al., Yale University and George Mason University
Drawing on a representative sample of the U.S. adult population (n = 1,013; including the 890 registered voters whose data are used), these findings describe how registered voters view a variety of domestic climate and energy policies. The survey was conducted from December 11 – 22, 2024, after the 2024 U.S. Presidential election. 54% of registered voters think global warming should be a high or very high priority for the president and Congress. 63% of registered voters think developing sources of clean energy should be a high or very high priority for the president and Congress. Majorities of registered voters support a range of policies to reduce carbon pollution and promote clean energy such as 88% support federal funding to help farmers improve practices to protect and restore the soil so it absorbs and stores more carbon, 67% support requiring fossil fuel companies to pay a carbon tax and using the money to reduce other taxes by an equal amount and 63% support transitioning the U.S. economy from fossil fuels to 100% clean energy by 2050.
136 articles in 56 journals by 741 contributing authors
Physical science of climate change, effects
Dynamics of salt intrusion in complex estuarine networks: an idealised model applied to the Rhine–Meuse Delta, Biemond et al., Ocean Science Open Access 10.5194/os-21-261-2025
Moist convective scaling: Insights from an idealised model, Agasthya et al., Quarterly Journal of the Royal Meteorological Society Open Access 10.1002/qj.4902
Sensitivity of the Energy Conversion Efficiency of Tropical Cyclones During Intensification to Sea Surface Temperature and Static Stability, Lai & Toumi, Quarterly Journal of the Royal Meteorological Society Open Access pdf 10.1002/qj.4895
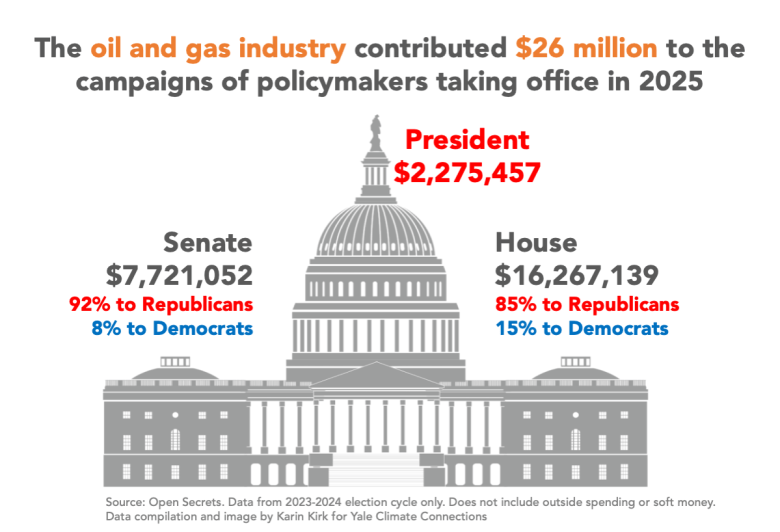
The fossil fuel industry spent $219 million to elect the new U.S. government
Posted on 5 February 2025 by Guest Author
This is a re-post from Yale Climate Connections by Karin Kirk
The 119th Congress comes with a price tag.
The oil and gas industry gave about $24 million in campaign contributions to the members of the U.S. House and Senate expected to be sworn in January 3, 2025, according to a Yale Climate Connections review of campaign donations. The industry gave an additional $2 million to President-elect Donald Trump’s campaign, bringing the total spending on the winning candidates to over $26 million, 88% of which went to Republicans.
The fossil fuel industry exerts substantial financial power within the U.S. political system, and these contributions are only the tip of the (melting) iceberg.
Sabin 33 #14 - Do we have sufficient mineral resources for solar development?
Posted on 4 February 2025 by BaerbelW
On November 1, 2024 we announced the publication of 33 rebuttals based on the report "Rebutting 33 False Claims About Solar, Wind, and Electric Vehicles" written by Matthew Eisenson, Jacob Elkin, Andy Fitch, Matthew Ard, Kaya Sittinger & Samuel Lavine and published by the Sabin Center for Climate Change Law at Columbia Law School in 2024. Below is the blog post version of rebuttal #14 based on Sabin's report.
A 2023 study that examined 75 emissions-reduction scenarios concluded that global reserves of critical materials are likely adequate to meet future demand for electricity generation infrastructure1 (also Wang et al. 2023). According to that study, production rates for many critical materials will need to grow substantially, but “[g]lobal mineral reserves should adequately meet needs posed by power sector material demand (Wang et al. 2023).” The United States Department of the Interior has likewise concluded that “[o]ther than perhaps short term interruptions resulting from market forces or geopolitical events, it is not anticipated that there will be any long term material constraints that would prevent the development of a significant amount of energy from photoelectric cells2.” Other analyses suggest that global mineral resources are likely sufficient to meet long-term demand across all energy transition sectors, including EVs and transmission.
In addition, as noted previously, innovations in recycling solar panels4 can potentially reduce future requirements for individual raw materials (Wang et al. 2023 at 320). Valuable materials in solar panels, including silver, copper, and crystalline silicon, are actively sought for the development of other products, including the next generation of solar panels5. Furthermore, the 2021 Infrastructure Investment and Jobs Act, and the 2022 Inflation Reduction Act, include provisions to identify and develop domestic sources of rare earth materials and other critical minerals required for our energy transition6. In tandem with the rollout of these incentives, a Department of the Interior interagency working group has likewise issued more than 60 concrete recommendations for responsibly overhauling an administrative framework still largely shaped by the Mining Law of 18727. These recommendations include substantial research investments, permitting reform, and proactive public and Tribal engagement. The Department of Energy, in turn, recently announced a $150 million initiative “to advance cost effective and environmentally responsible processes” for producing critical minerals and materials in the United States9.
January sets an unexpected temperature record
Posted on 3 February 2025 by Zeke Hausfather
This is a re-post from The Climate Brink
Both 2023 and 2024 were exceptionally warm years, at just below and above 1.5C relative to preindustrial in the WMO composite of surface temperature records, respectively. While we are still working to assess the full set of drivers of this warmth, it is clear that a sizable portion of 2024’s elevated temperatures were driven by a moderately strong El Niño event that peaked in November 2023.1
For this reason many of us expect that 2025 will be cooler than both 2023 and 2024, and is unlikely to be the warmest year in the instrumental record (though it will very likely be in the top three warmest years).

However, at least at the start of the year nature seems not to be following our expectations. Global temperatures were in record territory for the first three weeks of the year in the Copernicus/ECMWF ERA5 dataset, only falling out of record territory over the past few days.
2025 SkS Weekly Climate Change & Global Warming News Roundup #05
Posted on 2 February 2025 by BaerbelW, Doug Bostrom
This week's roundup is again published soleley by category. We are still interested in feedback to hone the categorization, so if you spot any clear misses and/or have suggestions for additional categories, please let us know in the comments. Thanks!
Stories we promoted this week, by category:
Climate Change Impacts
- Dangerous temperatures could kill 50% more Europeans by 2100, study finds Net increase of 80,000 deaths a year projected in hottest scenario, with milder winters failing to redress balance by Ajit Niranjan, Environment The Guardian, Jan 27, 2025
- Climate change made deadly Los Angeles wildfires 35% more likely: new attribution study The fires, likely to be the costliest in world history, were made about 35% more likely due to the 1.3°C of global warming that has occurred since preindustrial times. by Jeff Masters, Yale Climate Connections, Jan 28, 2025
- Climate triple whammy boosted risk of LA fires, study shows Hot, dry conditions, a lack of rain and a longer fire-risk season are all more likely in today’s hotter climate by Damian Carrington Environment editor, The Guardian, Jan 28, 2025
- Climate change poses 'security threat' to Irish economy and society by Irishexaminer.com, IrishExaminer.com, Jan 30, 2025
- Polar bears are struggling to get enough to eat as sea ice dwindles due to climate change, study finds by University of Toronto, Phys.org, Jan 30, 2025
Climate Policy and Politics
- Reset or Purge? Trump EPA Dismisses Agency Science Advisers Critics fear the unusual clean sweep of panels is meant to ease the planned rollback of climate and environmental policy. by Marianne Lavelle, Inside Climate News, Jan 30, 2025
- USDA ordered to scrub climate change from websites The directive could affect information across dozens of programs including climate-smart agriculture initiatives. by Zack Colman and Marcia Brown, Politico, Jan 31, 2025
Climate Science and Research
- Skeptical Science New Research for Week #4 2025 A weekly survey of freshly published peer reviewed and government/NGO reports on human-caused climate change, and what we can do to fix this problem. by Doug Bostrom & Marc Kodack, Skeptical Science, Jan 23, 2025
- The AMOC is slowing, it`s stable, it`s slowing, no, yes, … There’s been a bit of media whiplash on the issue of AMOC slowing lately – ranging from the AMOC being “on the brink of collapse” to it being “more stable than previously thought”. by Stefan Rahmstorf, RealClimate, Jan 26, 2025
- Comparison Update 2024 One more dot on the graphs for our annual model-observations comparisons updates. Given how extraordinary the last two years have been, there are a few highlights to note. by Gavin Schmidt, RealClimate, Jan 27, 2025
- Skeptical Science New Research for Week #5 2025 A weekly survey of newly published climate research, including academic peer reviewed reports as well as government and NGO publications. by Doug Bostrom & Marc Kodack, Skeptical Science, Jan 30, 2025
Fact brief - Is global warming promoting biodiversity?
Posted on 1 February 2025 by Guest Author
![]() Skeptical Science is partnering with Gigafact to produce fact briefs — bite-sized fact checks of trending claims. This fact brief was written by Sue Bin Park from the Gigafact team in collaboration with members from our team. You can submit claims you think need checking via the tipline.
Skeptical Science is partnering with Gigafact to produce fact briefs — bite-sized fact checks of trending claims. This fact brief was written by Sue Bin Park from the Gigafact team in collaboration with members from our team. You can submit claims you think need checking via the tipline.
Is global warming promoting biodiversity?
Biodiversity is declining, and global warming is a contributing factor.
Some species can adapt to environmental change, but many cannot evolve quickly enough, or at all. As habitats degrade and migration paths are blocked, many species have already disappeared, while more face extinction.
Adaptation often requires migration to better conditions, but human-made barriers like cities and dams block these paths. Climate change also disrupts migration cues, such as air or water temperature. Many species cannot migrate fast enough, like immobile coral reefs, or survive without specific habitats, like the now-extinct golden toad, confined to high-altitude Costa Rican forests made uninhabitable by human-induced climate changes.
Since 1970, mammal, bird, fish, reptile, and amphibian populations have declined by an average of 68%. Scientists estimate current extinction rates are hundreds to thousands of times higher than natural.
Climate change, habitat destruction, pollution, and overexploitation are all driving biodiversity loss, threatening ecosystems’ balance worldwide.
Go to full rebuttal on Skeptical Science or to the fact brief on Gigafact
This fact brief is responsive to quotes such as the one highlighted here.
Sources
WWF A warning sign: where biodiversity loss is happening around the world
AKSIK Fragility of Coral Reefs in Hawaii
ifaw Golden toads
Nature Food web rewiring in a changing world
CMS Major New UN Report Finds Climate Change is Severely Impacting Migratory Species of Wild Animals
WWF What is the sixth mass extinction and what can we do about it?
NOAA Climate Change: Atmospheric Carbon Dioxide
Skeptical Science New Research for Week #5 2025
Posted on 30 January 2025 by Doug Bostrom, Marc Kodack
Open access notables
Revisiting the Last Ice Area projections from a high-resolution Global Earth System Model, Fol et al., Communications Earth & Environment:
The Last Ice Area—located to the north of Greenland and the northern Canadian Arctic Archipelago—is expected to persist as the central Arctic Ocean becomes seasonally ice-free within a few decades. Projections of the Last Ice Area, however, have come from relatively low resolution Global Climate Models that do not resolve sea ice export through the waterways of the Canadian Arctic Archipelago and Nares Strait. Here we revisit Last Ice Area projections using high-resolution numerical simulations from the Community Earth System Model, which resolves these narrow waterways. Under a high-end forcing scenario, the sea ice of the Last Ice Area thins and becomes more mobile, resulting in a large export southward. Under this potentially worst-case scenario, sea ice of the Last Ice Area could disappear a little more than one decade after the central Arctic Ocean has reached seasonally ice-free conditions. This loss would have profound impacts on ice-obligate species.
Between inflated expectations and inherent distrust: How publics see the role of experts in governing climate intervention technologies, Fritz et al., Environmental Science & Policy:
Novel technologies for removing carbon dioxide from the atmosphere and proposals around solar radiation modification, known also as solar geoengineering, display key features of complex problems. These climate intervention technologies are characterized by high uncertainties, value disputes, high stakes and urgency. Such features create wicked conundrums in climate governance. Addressing questions around more effective governance of these technologies necessitates reflections on how different kinds of expertise, normative judgments and democratic decision-making (should) interact. Based on a survey (N?=?22,222) and 44 focus groups (N?=?323) in 22 countries, we show (i) who publics see as an expert in the field of climate intervention technologies, (ii) what roles they envision for experts in governing climate intervention technologies and (iii) how trust and distrust in scientists unfolds in the context of these novel, partly controversial, technologies.
A scoping review on climate change education, Muccione et al., PLOS Climate:
The growing urgency of the climate crisis necessitates innovative educational approaches to equip people with the knowledge and skills to address climate challenges and be able to influence policy effectively. Education can be a central asset to promoting climate action, yet the importance of climate change education has been underexposed in large and influential assessment reports such as those from the IPCC. This study provides a comprehensive mapping of the literature on climate change education with a particular focus on the time period 2008-2023. By combining human coding and natural language processing (NLP) techniques, we examined a diverse corpus of over 6’000 publications from the peer reviewed literature. The findings highlight the pivotal role of climate education across various disciplines and its alignment with critical climate research themes such as adaptation, mitigation, disaster risk management, and sustainability. Our analysis reveals three predominant topics within the literature which are related to effective learning methodologies, sustainable development education, and the importance of education in adaptation and resilience. Additionally, we identified emerging themes emphasizing the role of youth as change agents, the necessity of transformative educational practices and the importance of energy literacy.
Power price stability and the insurance value of renewable technologies, Navia Simon & Diaz Anadon, Nature Energy:
To understand if renewables stabilize or destabilize electricity prices, we simulate European power markets as projected by the National Energy and Climate Plans for 2030 but replicating the historical variability in electricity demand, the prices of fossil fuels and weather. We propose a β-sensitivity metric, defined as the projected increase in the average annual price of electricity when the price of natural gas increases by 1 euro. We show that annual power prices spikes would be more moderate because the β-sensitivity would fall from 1.4 euros to 1 euro. Deployment of solar photovoltaic and wind technologies exceeding 30% of the 2030 target would lower it further, below 0.5 euros. Our framework shows that this stabilization of prices would produce social welfare gains, that is, we find an insurance value of renewables. Because market mechanisms do not internalize this value, we argue that it should be explicitly considered in energy policy decisions
The polarization of energy preferences – A study on social acceptance of wind and nuclear power in Sweden, Lindvall et al., Energy Policy:
Using Sweden as a study case, this article explores the polarized opinions to wind and nuclear energy, two low carbon energy options that have been shown to be politically controversial. In a wide-scale survey (N = 5200), general attitudes to wind and nuclear energy are captured, as well as to projects in the proximity of people's homes. The study demonstrates a deep polarization of energy preferences in Sweden, finding strong associations between worldviews, political orientation, environmental concern, and support for or resistance to wind and nuclear energy. The study concludes that support for both energy options is reduced when wind or nuclear power is constructed near people's home, but also suggests that the proximity effect is particularly strong for individuals with strong TAN (traditional, authoritarian, nationalistic) values and right leaning political ideology. The article argues that politically motivated reasoning might explain the polarization of attitudes, yet this effect seems to become less relevant when people are asked to judge potential energy infrastructure located close them.
Climate change and migration dynamics in Somalia: a time series analysis of environmental displacement, Mohamed et al., Frontiers in Climate:
Climate change is a significant driver of human migration, especially in vulnerable regions like Somalia. This study investigates the relationship between climate variables—average annual precipitation, temperature, and CO? emissions—and net migration in Somalia, using time series data from 1990 to 2020. Additionally, it examines the role of population growth as a factor influencing migration. Applying the Autoregressive Distributed Lag (ARDL) model, this research captures both short- and long-term dynamics, providing insights into how environmental and demographic factors impact migration in this climate-sensitive region. The results indicate that favorable rainfall conditions positively influence net migration, as improved agricultural productivity stabilizes livelihoods, reducing pressures to migrate. In contrast, increased CO? emissions, associated with environmental degradation, negatively impact migration by limiting financial capacity, creating a “trapped population” effect. Population growth also intensifies migration pressures by increasing competition for limited resources. Interestingly, temperature variations do not significantly influence migration, possibly due to adaptive strategies or resilience to temperature fluctuations in the region. These findings underscore the need for policies focused on enhancing agricultural resilience, restoring degraded environments, and creating economic opportunities to reduce migration pressures in Somalia. Investments in sustainable land use, climate adaptation, and population management strategies are essential to address the complex challenges of climate-induced migration.
Optimal life-cycle adaptation of coastal infrastructure under climate change, Bhattacharya et al., Nature Communications:
Climate change-related risk mitigation is typically addressed using cost-benefit analysis that evaluates mitigation strategies against a wide range of simulated scenarios and identifies a static policy to be implemented, without considering future observations. Due to the substantial uncertainties inherent in climate projections, this identified policy will likely be sub-optimal with respect to the actual climate trajectory that evolves in time. In this work, we thus formulate climate risk management as a dynamic decision-making problem based on Markov Decision Processes (MDPs) and Partially Observable MDPs (POMDPs), taking real-time data into account for evaluating the evolving conditions and related model uncertainties, in order to select the best possible life-cycle actions in time, with global optimality guarantees for the formulated optimization problem.
From this week's government/NGO section:
Climate change and news audiences report 2024: Analysis of news use and attitudes in eight countries, Ejaz et al., Reuters Institute and Oxford University
The authors collected data from an online survey of people in eight countries: Brazil, France, Germany, India, Japan, Pakistan, the UK, and the USA. The data were collected in November 2024. The data collection is part of an ongoing project to explore public engagement with news and information about climate change, and how people perceive, experience, and respond to its escalating impacts. The authors found that on average across the eight countries, half (50%) see, read, or hear news or information about climate change every week – showing little change from 2022 (51%). Climate news and information consumption is highest in France (60%), with lower numbers in the USA (34%) where, against the backdrop of the presidential election, there was a 16 percentage point (pp) fall from 2023. The news media continues to be the primary way people access climate change information – ahead of documentaries, social media, and interpersonal communication – with television news (31%) and online news websites/apps (24%) as the most widely used media. Video is people’s preferred format, ahead of text.
Ho'okele Mua II, a Wargame About Climate Change and Operational Risk in INDOPACOM, Rooney et al., Rand
The authors describe the development and execution of a climate change game for the U.S. Indo-Pacific Command (USINDOPACOM). The game was intended to support planning by allowing players to explore the extent of operational risk that climate change could impose on the joint force in the Indo-Pacific region in the 2040s.
Good for your Pocket. How renewable energy helps Irish electricity consumers, Alec Granville-Willett and Mark Turner, Baringa
The development of wind and solar farms has reduced the cost burden on Irish consumers by €840 million between 2000 and 2023. This saving, equivalent to €165 per person, has been realized on the power bills of all consumers by the low cost of renewable electricity. Wind and solar farms have no fuel cost and undercut more expensive gas- and coal-fired generators, displacing them from the wholesale power market.
121 articles in 50 journals by 724 contributing authors
Physical science of climate change, effects
Characteristics and potential drivers of extreme high-temperature event frequency in Eurasia, Xie et al., Dynamics of Atmospheres and Oceans 10.1016/j.dynatmoce.2025.101536
Impact of Climate Change on the Dynamics of the Southern Senegal Upwelling Center, Ndoye et al., Geophysical Research Letters Open Access 10.1029/2024gl112582
Slowed Response of Atlantic Meridional Overturning Circulation Not a Robust Signal of Collapse, Zimmerman et al., Geophysical Research Letters Open Access 10.1029/2024gl112415
An explanation of how renewable energy saves you money
Posted on 29 January 2025 by Guest Author
This is a re-post from the Climate Brink by Andrew Dessler
Climate denial is dead. Renewable energy denial is here. As “alternative facts” become the norm, it’s worth looking at what actual facts tell us about how renewable energy sources like solar and wind are lowering the price of electricity.
As an example that’s close to home (for me), I’ll focus on the Texas electricity market, which is run by the Electric Reliability Council of Texas, known as ERCOT.
How ERCOT sets the price of electricity
At all times, ERCOT must balance electricity supply and demand, while keeping costs as low as possible. Let’s walk through a simplified example of how they do this.
First, ERCOT forecasts tomorrow’s electricity demand based on factors like forecast weather, historical usage patterns, and expected industrial activity. Let’s imagine that ERCOT predicts a need for 100 megawatts (MW)1 of power tomorrow.
ERCOT then asks generators to make bids for how much power each one can produce and what it will cost. Let’s assume there are six different generators that bid into the market:
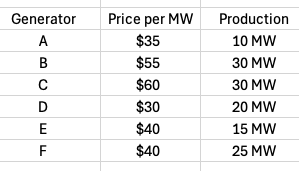
ERCOT sorts the bids by price, producing what’s known as the merit stack. ERCOT then moves down the merit stack, using generators that produce the required power (100 MW) at the lowest price.
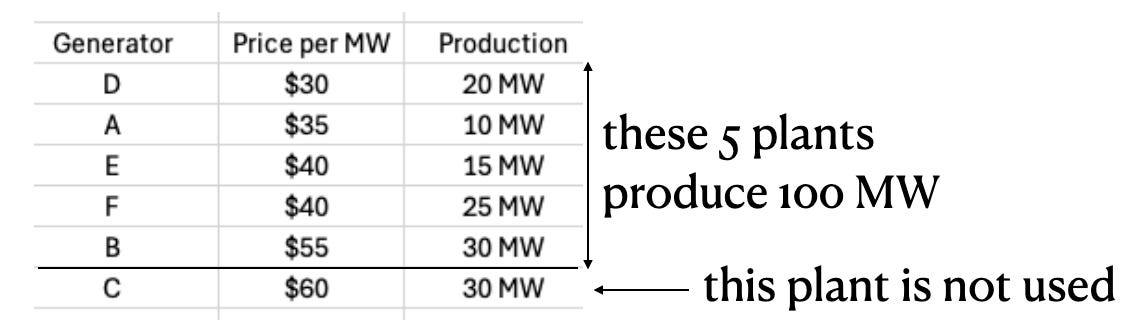
This means generator C is out of luck — ERCOT will not be buying power from that generator.
So what is the resulting price of electricity? Rather than paying each plant a different price based on their bids, ERCOT employs what’s known as marginal pricing, in which all of the generators get paid the cost of generating the last unit of energy.
Generator B is the last generator on the stack — sometimes referred to as the marginal generator — so it produces the last unit of power. The price of that last unit is $55 per MW, so that’s what the wholesale price of electricity on this day will be. All of the generators get paid that amount regardless of how much it costs for them to produce the energy.
Sabin 33 #13 - Is solar energy unreliable?
Posted on 28 January 2025 by BaerbelW
On November 1, 2024 we announced the publication of 33 rebuttals based on the report "Rebutting 33 False Claims About Solar, Wind, and Electric Vehicles" written by Matthew Eisenson, Jacob Elkin, Andy Fitch, Matthew Ard, Kaya Sittinger & Samuel Lavine and published by the Sabin Center for Climate Change Law at Columbia Law School in 2024. Below is the blog post version of rebuttal #13 based on Sabin's report.

Complete reliance on solar generation, without other sources of power generation, energy storage, long-distance transmission, or other grid flexibility resources1 (Lovins 2017), would pose intermittency challenges. However, an increasing number of planned solar projects are set to include an energy storage component2, and solar, wind, and storage together can provide the majority of the country’s electricity without compromising reliability3.
When a local service area does face diminished solar capacity, for instance during a cloudy day, wind and other renewable sources, as well as battery storage and long-distance transmission that carries power from sunnier regions can supplement energy supply, ensuring a resilient grid4 (also Jacobson 2022). As a result, increased reliance on solar energy need not require the construction of new natural gas plants for backup5. The Department of Energy’s 2021 “Solar Futures Study,” for example, outlines three distinct decarbonization scenarios, each of which assumes both a massive increase in renewable energy generation and decrease in natural gas6. Under the “business as usual” reference scenario, natural gas, oil, and steam together decrease from roughly 39% of U.S. annual electricity generation in 2020 to roughly 31% by 2035/2036 and 30% by 2049/2050; under the same scenario, solar PV increases from roughly 3.4% in 2020 to 17.6% by 2035/2036 and 27.3% by 2049/2050. Under the two non-reference decarbonization scenarios assessed in the studies, natural gas, oil, and steam shrink to roughly 4.7%-5.2% of annual electricity generation by 2035/2036 and 0% by 2049/2050; solar PV, meanwhile, increases to between 36.9% and 42.2% by 2035/2036 and to between 40.1% and 44.8% by 2049/2050. Princeton University’s Net-Zero America study, which assesses pathways to achieving net-zero GHG emissions by 2050, likewise foresees significant reductions in fossil fuel consumption and generation, even when maintaining 500-1,000 GW of firm generating capacity to ensure reliability. Across the suite of assessed net-zero scenarios, the study assumes that all thermal coal production and consumption will cease by 2030, oil production will decline between 25% to 85% by 2050, and natural gas production will decline between 20% and 90% by 2050.
California has already increased solar energy generation while decreasing natural gas utilization. In 2012, solar PV and solar thermal together accounted for only 0.9% of California’s in-state electricity generation, while natural gas accounted for roughly 70%7. By 2022, solar had increased to 19.9% of California’s in-state electricity generation, while natural gas had decreased to 47.5%8. Significantly, even with this increase in solar reliance, California’s grid reliability remains near, or above, the national average9. Elsewhere in the United States, energy experts have asserted that Texas’s widespread adoption of solar generation helped prevent outages when electricity usage spiked during a recent summer heatwave10. And although the reliability of solar and wind energy was questioned following Texas’ widespread power outages in the winter of 2021, Texas’ grid failure was primarily caused by freezing natural gas infrastructure, rather than failures at solar and wind farms, though nuclear, coal, and wind also experienced disruptions at a smaller scale11 (also Busby et al. 2021).
Energy storage also will play an important role in achieving decarbonization while improving energy reliability. The DOE’s “Solar Futures Study” forecasts that an additional 60 GW per year of storage will be needed to achieve decarbonization6. Fortunately, research on storage technologies has experienced significant breakthroughs in recent years. For example, sodium-ion batteries have emerged as a possible alternative to lithium-ion batteries, with sodium a much more abundant and less expensive material12. Researchers are likewise developing more efficient utility-scale methods for storing solar energy13.
Other researchers have highlighted energy efficiency and grid flexibility mechanisms that can complement and support solar and wind without the need for fossil fuel backup or even bulk, utility-scale energy storage (Lovins 2017). These include integrative design practices to significantly reduce the energy demands of buildings and other sectors; demand flexibility and demand response mechanisms to compensate customers for reduced energy use during peak hours; and distributed thermal and electrical storage14 (also Lovins 2018).
Finally, while solar energy is intermittent, multiple studies have shown that the panels themselves are highly reliable—with appreciably low degradation and failure rates, thus rarely requiring repair or replacement (Jordan et al. 2017, Jordan et al. 2020). A National Renewable Energy Laboratory (NREL) study found that the median failure rate for panels installed between 2000 to 2015 was five out of 10,000 annually, a rate of 0.05% (Jordan et al. 2017). Researchers have described the failure rate of residential PV inverters as “acceptable, even good,” with an inverter typically needing to be replaced only once in the lifetime of a PV system.
The planet had 58 billion-dollar weather disasters in 2024, the second-highest on record
Posted on 27 January 2025 by Guest Author
This is a re-post from Yale Climate Connections by Jeff Masters
The planet was besieged by 58 billion-dollar weather disasters in 2024, ranking second-highest behind only 2023, which had 73, said insurance broker Gallagher Re in its annual report issued 17. The total damage wrought by weather disasters in 2024 was $402 billion, 20% higher than the 10-year inflation-adjusted average. (Gallagher Re’s historical database extends back to 1990.) A separate report issued January 18 by insurance broker Aon put the total damage wrought by weather disasters in 2024 at $348 billion, with 53 billion-dollar weather disasters.
Increasing numbers of billion-dollar disasters primarily driven by increases in wealth and population
Gallagher Re said that 2024 had the highest-ever number of insured billion-dollar weather disasters: 21, beating the record of 17 set in 2023 and 2020; over 40% of the insured damage was from severe thunderstorms. There has been a steep rise in the number of billion-dollar weather disasters in recent years, and most of this has been driven by increases in severe thunderstorm losses in the United States.
About 80-90% of the increase in damage resulted from factors other than climate change. This point was echoed by insurance broker Aon in a 2023 report, which found that over 80% of severe thunderstorm loss growth could be explained by factors unrelated to climate change. (Hail damage, in particular, is getting a boost from rapid growth in Texas and other Sun Belt states.) However, Gallagher Re warned that climate change amplification of weather events was leading to “weather whiplash,” with rapid shifts from one peril to another.
U.S. sees its second-highest number of billion-dollar weather disasters: 27
As discussed in our January 10 post, the inflation-adjusted tally of U.S. billion-dollar weather disasters in 2024 was 27, falling just short of the record of 28 set in 2023. The total cost of 2024’s billion-dollar weather disasters, $182.7 billion, was the fourth-highest on record in the NOAA database. The billion-dollar disasters of 2024 included 17 severe storm events, five hurricanes, one wildfire, one drought, one flood, and two winter storms. The average number of billion-dollar disasters for a full year for the most recent five years (2020–2024) is 23. Using different accounting methods, Gallagher Re tallied 33 U.S. billion-dollar weather disasters for 2024.
 Figure 1. The 27 billion-dollar U.S. weather disasters of 2024, according to NOAA.
SkS Weekly Climate Change & Global Warming News Roundup #04
Posted on 26 January 2025 by BaerbelW, Doug Bostrom
This week's roundup is again published soleley by category. We are still interested in feedback to hone the categorization, so if you spot any clear misses and/or have suggestions for additional categories, please let us know in the comments. Thanks!
Stories we promoted this week, by category:
Climate Change Impacts
- Climate change is forcing us to rethink our sense of ‘home’ – and what it means to lose it by Talia Fell and Codie Condos Distratis , The Conversation, Jan 16, 2025
- Greenland`s lakes are getting uglier-and fast The transformation could be permanent. by Lauren Leffer, Popular Science, Jan 20, 2025
- The scariest thing about the LA fire by Simon Clark, Youtube, Jan 21, 2025
- This scientist studies climate change. Then the Los Angeles fire destroyed his home by Lauren Sommer, NPR Topics: Climate, Jan 23, 2025
- The planet had 58 billion-dollar weather disasters in 2024, the second-highest on record The world endured three of its top-20 costliest disasters on record in 2024, its fifth-deadliest wildfire, and a record three heat waves that caused more than 1,000 deaths. by Jeff Masters, Yale Climate Connections, Jan 24, 2025
Climate Policy and Politics
- Trump Targeted Scientists in His First Term. This Time, They’re Prepared. Agencies and unions have put in place new guardrails designed to limit political interference in government research. by Coral Davenport, New York Times, Jan 17, 2025
- Trump unravels US climate agenda as he promises to `drill, baby, drill` From declaring a “national energy emergency” to exiting the Paris Agreement, here is everything climate-related Trump did on Day 1. by Naveena Sadasivam, Grist, Jan 21, 2025
- Trump vows to `unleash` oil and gas drilling as he rolls back climate rules President declares energy emergency, reiterates Paris withdrawal plan and overturns emissions standards by Dharna Noor, The Guardian, Jan 21, 2025
- Sabin Center`s Online Tracking Tools Monitor Government Actions on Climate Change by Sabin Center for Climate Change Law, State of the Planet, Jan 22, 2025
- Explained: how Trump`s day one orders reveal a White House for big oil From LNG to drilling in Alaska, here’s everything you need to know about Trump’s energy and climate executive orders by Oliver Milman and Dharna Noor, The Guardian, Jan 22, 2025
- After Trump`s pullback, Bloomberg promises to fill US funding gap to UN climate body The announcement comes after Trump said the US should “immediately cease or revoke” any financial commitment made under the UNFCCC by Matteo Civillini, Climate Home News, Jan 23, 2025
- Let’s not panic by John Perona, Earthward, Jan 22, 2025
- Trump returns: Nine things to expect for the climate by Jack Marley , The Conversation, Jan 23, 2025
- Undaunted A champion for truth, science, and responsible stewardship by Jennifer Rubin, The Contrarian, Jan 24, 2025
Skeptical Science New Research for Week #4 2025
Posted on 23 January 2025 by Doug Bostrom, Marc Kodack
Open access notables
Managing and mitigating future public health risks: Planetary boundaries, global catastrophic risk, and inclusive wealth, McLaughlin & Beck, Risk Analysis [perspective]:
There are two separate conceptualizations for assessing existential risks: Planetary Boundaries (PBs) and global catastrophic risks (GCRs). While these concepts are similar in principle, their underpinning literatures tend not to engage with each other. Research related to these concepts has tended to be siloed in terms of the study of specific threats and also in terms of how these are assumed to materialize; PBs attribute global catastrophes to slow-moving and potentially irreversible global changes, while GCRs focuses on cataclysmic short-term events. We argue that there is a need for a more unified approach to managing global long-term risks, which recognizes the complex and confounded nature of the interactions between PBs and GCRs. We highlight where the PB and GCR concepts overlap and outline these complexities using an example of public health, namely, pandemics and food insecurity. We also present an existing indicator that we argue can be used for monitoring and managing risk. We argue for greater emphasis on national and global ‘‘inclusive wealth’’ as a way to measure economic activity and thus to monitor and mitigate the unintended consequences of economic activity. In sum, we call for a holistic approach to stewardship aimed at preserving the integrity of natural capital in the face of a broad range of global risks and their respective regional or global manifestations.
El Niño and Sea Surface Temperature Pattern Effects Lead to Historically High Global Mean Surface Temperatures in 2023, Jiang et al., Geophysical Research Letters:
In 2023, the world experienced its highest ever global mean surface temperature (GMST). Our study underscores the pivotal significance of El Niño and sea surface temperature (SST) warming as the fundamental causes. Interannually, the increment of GMST in 2023 comprised two phases: first, gradual ocean warming associated with El Niño and the North Atlantic from January to August; second, a continued rise in land temperatures in the mid-to-high latitude regions from September onwards, influenced by SST patterns. Notably, the maturation of El Niño prolonged warming in North America through excitation of the Pacific-North American teleconnection. During the most recent 15 years, GMST has entered an accelerated warming period, primarily driven by rapid SST warming trends in the tropical Indian Ocean, tropical Atlantic, subtropical North Pacific, and North Atlantic. These decadal warming patterns, combined with El Niño, may further increase GMST, with 2023 as a particularly striking example.
Carbon emission and energy risk management in mega sporting events: challenges, strategies, and pathways, Su et al., Frontiers in Environmental Science
The study reveals that large-scale sporting events generate substantial carbon emissions and energy consumption in transportation, venue construction, and event operation. However, carbon emissions and energy usage can be significantly reduced by optimizing venue locations, promoting green transportation, and implementing energy-saving measures at all stages. This study not only provides empirical data and theoretical support for the management of carbon emissions and energy efficiency in sporting events but also proposes practical and feasible suggestions that are highly important for the sustainable development of future sporting events. The findings have reference value for policymakers and event organizers in planning and implementing energy-saving and low-carbon events, helping promote environmental governance and sustainable development in the sports sector.
Hydroclimatic extremes threaten groundwater quality and stability, Schroeter et al., Nature Communications
Heavy precipitation, drought, and other hydroclimatic extremes occur more frequently than in the past climate reference period (1961–1990). Given their strong effect on groundwater recharge dynamics, these phenomena increase the vulnerability of groundwater quantity and quality. Over the course of the past decade, we have documented changes in the composition of dissolved organic matter in groundwater. We show that fractions of ingressing surface-derived organic molecules increased significantly as groundwater levels declined, whereas concentrations of dissolved organic carbon remained constant. Molecular composition changeover was accelerated following 2018’s extreme summer drought. These findings demonstrate that hydroclimatic extremes promote rapid transport between surface ecosystems and groundwaters, thereby enabling xenobiotic substances to evade microbial processing, accrue in greater abundance in groundwater, and potentially compromise the safe nature of these potable water sources. Groundwater quality is far more vulnerable to the impact of recent climate anomalies than is currently recognized, and the molecular composition of dissolved organic matter can be used as a comprehensive indicator for groundwater quality deterioration.
Illusory implications: incidental exposure to ideas can induce beliefs, Mikell & Powell, Royal Society Open Science
Numerous psychological findings have shown that incidental exposure to ideas makes those ideas seem more true, a finding commonly referred to as the ‘illusory truth’ effect. Under many accounts of the illusory truth effect, initial exposure to a statement provides a metacognitive feeling of ‘fluency’ or familiarity that, upon subsequent exposure, leads people to infer that the statement is more likely to be true. However, genuine beliefs do not only affect truth judgements about individual statements, they also imply other beliefs and drive decision-making. Here, we consider whether exposure to ‘premise’ statements affects people’s truth ratings for novel ‘implied’ statements, a pattern of findings we call the ‘illusory implication’ effect. We argue these effects would constitute evidence for genuine belief change from incidental exposure and identify a handful of existing findings that offer preliminary support for this claim. Building upon these, we conduct three new preregistered experiments to further test this hypothesis, finding additional evidence that exposure to ‘premise’ statements affected participants’ truth ratings for novel ‘implied’ statements, including for considerably more distant implications than those previously explored. Our findings suggest that the effects of incidental exposure reach further than previously thought, with potentially consequential implications for concerns around mis- and dis-information.
Risking delay: the storylines of (bioenergy with) carbon capture and storage in Swedish parliamentary discourse, Almqvist-Ingersoll, Frontiers in Climate
Carbon Capture and Storage (CCS), along with Bioenergy with Carbon Capture and Storage (BECCS), feature heavily in climate mitigation scenarios. Nevertheless, the technologies remain controversial within the broader mitigation discourse, in part for their potential to excuse delay in more ambitious emissions reductions in the short term. Sweden has included BECCS and CCS as proposed “supplementary measures” to enable the country to meet its ambitious target of achieving net negative emissions by 2045. Hajer’s Argumentative Approach to Discourse Analysis is applied to Swedish parliamentary speeches, motions, and written questions and answers, to uncover the storylines and attendant assumptions constituting Swedish policy deliberation regarding CCS and BECCS. This study finds that by problematizing climate change as an issue of emissions, actors position CCS and BECCS within a dominant neoliberal discourse and characterize them as tools to facilitate a green transition centering on industrial and economic competitiveness. This discourse lacks detail, and risks delay by oversimplifying the needs and requirements for CCS and BECCS deployment. Meanwhile, a CCS-critical discourse acknowledges the need for negative emissions but challenges storylines portraying the technology as inexpensive or easy to deploy rapidly. If pursued, this discourse could serve to sharpen the debate about the technologies and bring planning in line with aspirations, helping to avert risks of delay.
From this week's government/NGO section:
Planetary Solvency–finding. Global risk management for human prosperity. our balance with nature, Trust et al, Institute and Faculty of Actuaries and University of Exeter
The risk of Planetary Insolvency looms unless we act decisively. Without immediate policy action to change course, catastrophic or extreme impacts are eminently plausible, which could threaten future prosperity. The global economy could face a 50% loss in GDP between 2070 and 2090 unless immediate policy action on risks posed by the climate crisis is taken. Populations are already impacted by food system shocks, water insecurity, heat stress, and infectious diseases. If unchecked, mass mortality, mass displacement, severe economic contraction, and conflict become more likely. The authors develop a framework for global risk management to address these risks and show how this approach can support future prosperity. They also show how a lack of realistic risk messaging to guide policy decisions has led to slower action than is needed. The authors propose a dashboard to provide decision-useful risk information to support policymakers to drive human activity within the finite bounds of the planet that we live on.
State of the Clean Energy Boom, Clean Power
In less than two and a half years since the passage of the Inflation Reduction Act more than 400,000 new clean energy jobs and over $422 billion in investments across 48 states and Puerto Rico have been announced. Most of the clean energy projects and jobs are located in congressional districts represented by Republicans – 405 clean energy projects and 216,322 jobs, respectively. Of the top 10 states for new clean energy jobs, half have Republican governors welcoming the local investments. The authors analyze public announcements from the private sector since the passage of the clean energy plan to demonstrate the breadth and scale of the growing clean energy economy being built across the country. It also provides a breakdown of the data by state, sector, and congressional district, as well as analyses covering projects, jobs, and investments in rural areas and disadvantaged communities across America and in districts represented by Republican members of the House of Representatives.
126 articles in 57 journals by 898 contributing authors
Physical science of climate change, effects
Atlantic overturning inferred from air-sea heat fluxes indicates no decline since the 1960s, Terhaar et al., Nature Communications Open Access 10.1038/s41467-024-55297-5
Climate Change Drives Evolution of Thermohaline Staircases in the Arctic Ocean, Lundberg & Polyakov, Journal of Geophysical Research: Oceans 10.1029/2024jc021538
Delayed onset of ocean acidification in the Gulf of Maine, Stewart et al., Scientific Reports Open Access 10.1038/s41598-024-84537-3
Dominant inflation of the Arctic Ocean’s Beaufort Gyre in a warming climate, Wang et al., Communications Earth & Environment Open Access 10.1038/s43247-025-02028-3
Climate Adam: Will 2025 be the Hottest Year Ever Recorded?
Posted on 22 January 2025 by Guest Author
This video includes personal musings and conclusions of the creator climate scientist Dr. Adam Levy. It is presented to our readers as an informed perspective. Please see video description for references (if any).
2025 has only just begun, but already climate scientists are working hard to unpick what could be in store for us. As greenhouse gas emissions continue to drive more and more climate change, the overall trend is for more global warming. But other factors - like the El Niño oscillation moving towards La Niña - will also have a major impact. So how hot will 2025 be? And how will climate change affect us in the form of extreme weather disasters? Whether that's heatwaves, floods, droughts and wildfires - like the ones ravaging Los Angeles right now?
Support ClimateAdam on patreon: https://patreon.com/climateadam
Sabin 33 #12 - Do solar panels work in cold or cloudy climates?
Posted on 21 January 2025 by BaerbelW
On November 1, 2024 we announced the publication of 33 rebuttals based on the report "Rebutting 33 False Claims About Solar, Wind, and Electric Vehicles" written by Matthew Eisenson, Jacob Elkin, Andy Fitch, Matthew Ard, Kaya Sittinger & Samuel Lavine and published by the Sabin Center for Climate Change Law at Columbia Law School in 2024. Below is the blog post version of rebuttal #12 based on Sabin's report.
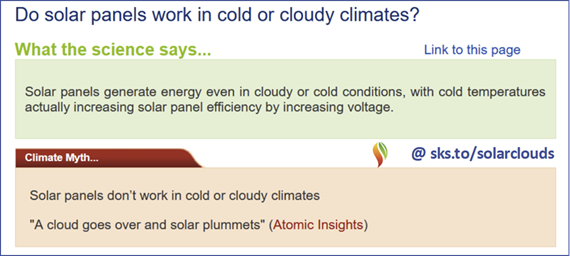
Solar panels generate energy even in cloudy or cold conditions1 (also Ramli et al. 2016). Although cloudy weather may reduce power generation by as much as 45%, substantial energy can still be generated during those conditions (Ramli et al. 2016 and Makrides et al. 2012).
Furthermore, in most instances, cold temperatures do not reduce electricity output at all—and actually increase solar panel efficiency by increasing voltage2 (also Sarmah et al. 2023). Crystalline silicon cells, which comprise approximately 84% of the U.S. market, and cadmium telluride cells, which comprise approximately 16% of the U.S. market, actually perform better in colder weather2. Only amorphous silicon cells, which represent a negligible percentage of the U.S market, experience decreased performance in colder temperatures.
Moving away from high-end emissions scenarios
Posted on 20 January 2025 by Zeke Hausfather
This is a re-post from the Climate Brink
I have a new paper out today in the journal Dialogues on Climate Change exploring both the range of end-of-century climate outcomes in the literature under current policies and the broader move away from high-end emissions scenarios. Current policies are defined broadly as policies in place today and a continuation of trends in technology costs, but no additional climate policy enacted for the remainder of the century.
The figure below shows the literature summary I put together (as of fall 2024), which includes estimates of current policy outcomes (in red), outcomes where countries meet their 2030 Paris Agreement nationally determined contributions (in orange), constrained estimates using socioeconomic factors (or other factors) to try and estimate most likely end-of-century trajectories including future policy (in grey), and net-zero commitments made by countries (in blue).
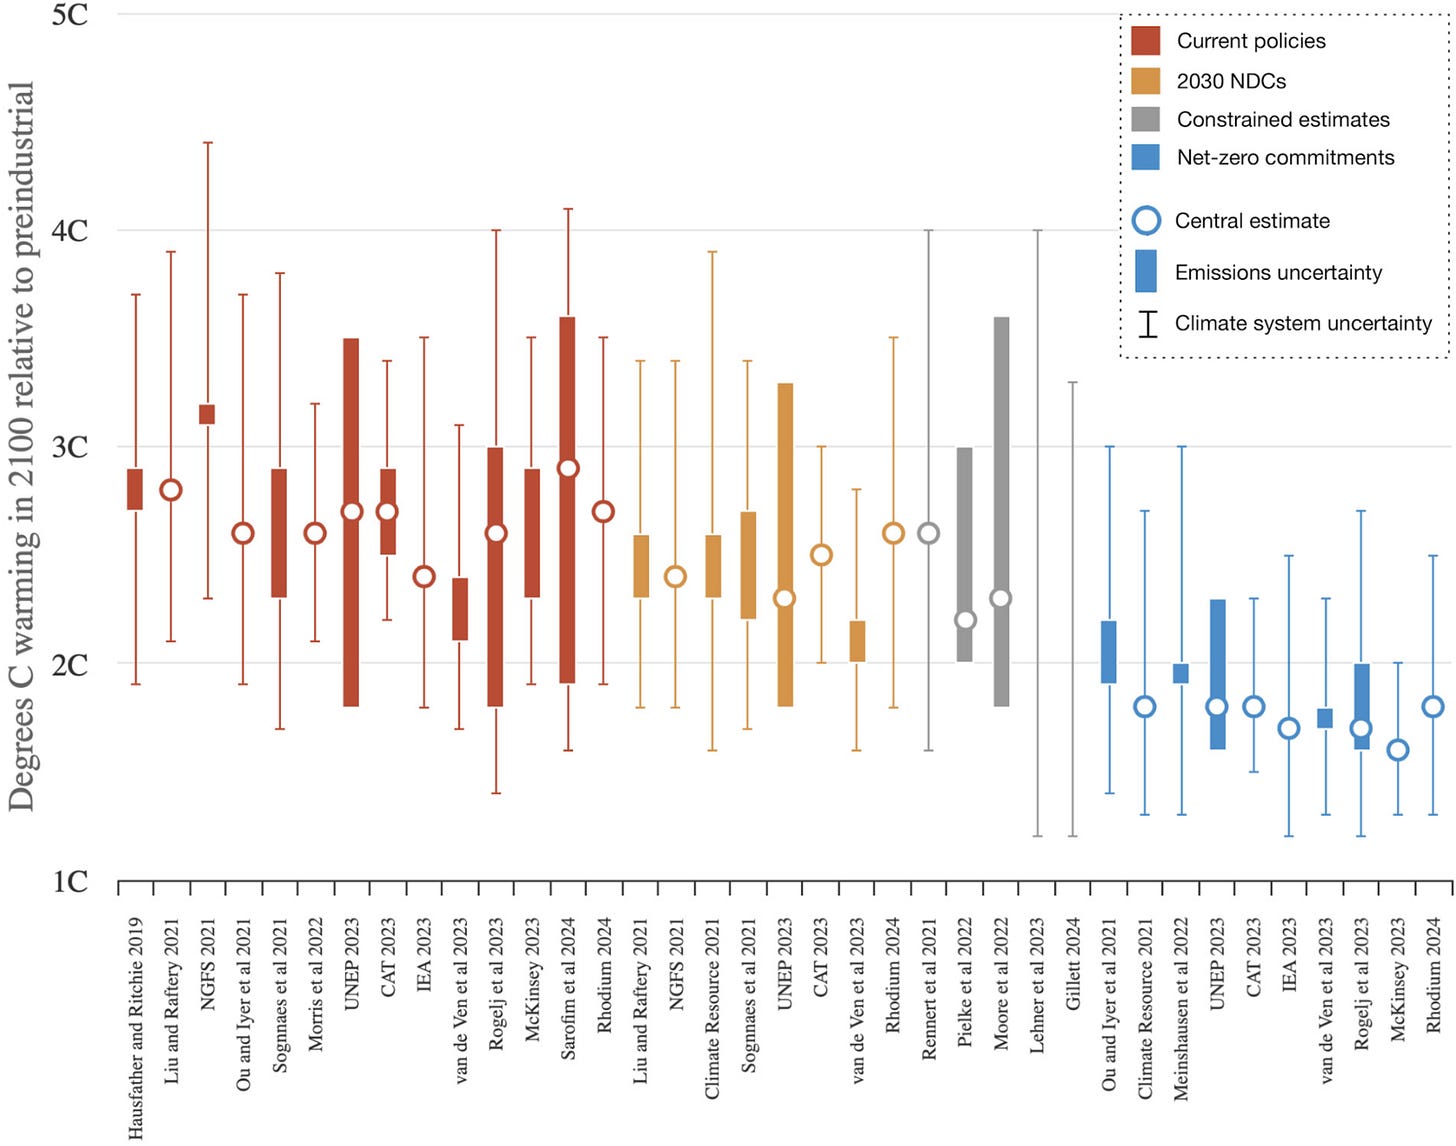
These suggest a median estimate of future warming under current policies of 2.7C in 2100 (with a 5th-95th percentile range of central estimates spanning 2.3C to 3C). Adding in emissions uncertainties and climate system uncertainties gives a much wider range of 1.9C at the low end to 3.7C at the high end. Current policies represent something of a moving target, which complicates the interpretation of a review of recent literature; those studies from 2021 may lag behind the policy and technology environment of 2024, for example.
The push to examine the range of outcomes consistent with current policy (and a rapidly growing literature on the topic) allows us to better constrain the upper bound of plausible scenarios today. In particular, the range of current policy scenarios in the literature largely preclude emissions pathways in high-end scenarios like RCP8.5 (Riahi et al., 2011), SSP3–7.0, or SSP5–8.5 (Riahi et al., 2017) in the absence of an active reversal of current policy and current technology trends.
I’ve included a more detailed excerpt of the article below, but I’d encourage folks to read the whole (open access) piece here, as its written to be accessible to a more general audience.


