


 Arguments
Software
Resources
Comments
The Consensus Project
Translations
About
Support
Arguments
Software
Resources
Comments
The Consensus Project
Translations
About
Support
![]()
![]()
![]()
![]()
![]()
![]()
![]()
![]()
![]()
![]()


![]()


Latest Posts
- 2024 SkS Weekly Climate Change & Global Warming News Roundup #17
- Fact Brief - Is Antarctica gaining land ice?
- Simon Clark: The climate lies you'll hear this year
- Skeptical Science New Research for Week #17 2024
- Water is at the heart of farmers’ struggle to survive in Benin
- At a glance - The difference between weather and climate
- India makes a big bet on electric buses
- 2024 SkS Weekly Climate Change & Global Warming News Roundup #16
- EGU2024 - An intense week of joining sessions virtually
- Skeptical Science New Research for Week #16 2024
- How extreme was the Earth's temperature in 2023
- At a glance - Is the science settled?
- What is Mexico doing about climate change?
- 2024 SkS Weekly Climate Change & Global Warming News Roundup #15
- Fact Brief - Did global warming stop in 1998?
- Skeptical Science New Research for Week #15 2024
- EGU2024 - Picking and chosing sessions to attend virtually
- At a glance - The Pacific Decadal Oscillation (PDO) is not causing global warming
- Climate Adam: Is Global Warming Speeding Up?
- 2024 SkS Weekly Climate Change & Global Warming News Roundup #14
- Gigafact and Skeptical Science collaborate to create fact briefs
- Skeptical Science New Research for Week #14 2024
- How can I make my retirement plan climate-friendly?
- At a glance - Global warming and the El Niño Southern Oscillation
- A data scientist’s case for ‘cautious optimism’ about climate change
- 2024 SkS Weekly Climate Change & Global Warming News Roundup #13
- Skeptical Science New Research for Week #13 2024
- You can start applying for the American Climate Corps next month
- At a glance - Human fingerprints on climate change rule out natural cycles
- Want clean electricity? These are the overlooked elected officials who get to decide.
Comment Search Results
Search for Clouds
Comments matching the search Clouds:
- Climate - the Movie: a hot mess of (c)old myths!
jimsteele at 08:01 AM on 3 April, 2024LOL you say "I havent heard that myth for a decade or so" Exactly what myth are you insinuating???
You seem unable to distinguish solar irradiance vs solar insolation!?Clouds provide a huge determination of solar insolation but not irradiance . Please explain your viewpoint. Otherwise it appears you dont know what you are talking about!
- Skeptical Science New Research for Week #12 2024
nigelj at 06:05 AM on 22 March, 2024Regarding "Climate models can’t explain 2023’s huge heat anomaly — we could be in uncharted territory, Schmidt, Nature [perspective]:"
This is very concerning and perceptive.
This following article by Copernicus has a great review of the effects of aerosols, and some interesting ideas of what may have contributed to last years unusually high temperatures in the nothern atlantic in partcular:
"Aerosols: are SO2 emissions reductions contributing to global warming?"
https://atmosphere.copernicus.eu/aerosols-are-so2-emissions-reductions-contributing-global-warming
Excerpts:
In 2020, the International Maritime Organization adopted its ‘IMO 2020’ regulation to drastically reduce shipping-related sulphur dioxide (SO2) emissions. Studies have concluded that the drop in emissions significantly reduced the formation of clouds over shipping lanes. An analysis by Carbon Brief estimated that that “the likely side-effect of the 2020 regulations to cut air pollution from shipping is to increase global temperatures by around 0.05C by 2050 (My note: Clearly this doesnt do much to explain the last 9 months unusual warming, and why would a change in 2020 shipping fuels that was implimented in that year, not slowly phased in, suddenly manifest 3 years later anyway? ). This is equivalent to approximately two additional years of emissions.” However, linking SO2 reductions directly to the recent extreme marine heatwaves omits part of the complexity of using models to calculate sulphate aerosol interactions in the atmosphere or estimating the effective application of the IMO 2020 regulation, and, more generally, the complexity of climate and atmospheric chemistry.
Reviewing the record North Atlantic Sea surface temperatures in June 2023, a preliminary analysis from CAMS scientists found a significant negative anomaly in Saharan dust aerosol transport over the tropical Atlantic Ocean, and an increased anomaly in biomass burning aerosol over the North Atlantic, coming from the massive Canadian wildfires. These aerosol anomalies are much bigger than the sulphate change from shipping emission reductions. This makes the estimation of the impact of reduced sulphate aerosol emissions on the sea surface temperatures very challenging.
June 2023 monthly mean aerosol optical depth (AOD) anomaly relative to June average AOD for the period 2003-2022 from the CAMS global reanalysis of atmospheric composition shows a negative anomaly related to reduced dust transport across the tropical North Atlantic (blue) and a positive anomaly related to smoke transport from Canadian wildfires over the extra-tropical North Atlantic (red). Base on non-validated data Credit: CAMS
The Copernicus Climate Change Service (C3S) also suggested that, among other factors, the reduced winds of a weakened Azores anticyclone - an extensive wind system that spirals out from a centre of high atmospheric pressure - could have reduced the ocean-atmosphere exchange and the vertical mixing of the ocean between colder and warmer waters, as well as reducing Saharan dust transport over the Atlantic, all of which has the potential to increase the ocean surface temperature.
“There will be, no doubt, long-term impacts from the reduced SO2 emissions, but it will demand dedicated research to understand the impact of sulphur changes. The changes in dust or black carbon have a more tangible effect in the short term”, says Richard Engelen CAMS Deputy Director.
My comments: Of course this doesn't easily explain the unusually high levels of warming in the pacific. Next year will be revealing. It should be relatively cooler year on past patterns but if it isnt IMO it would suggest a step change in anthropogenic global warming. We know the climate is non linear and abrupt changes are possible. Will be interesting to see what BS the denialists will come up with to counter another unusually warm year.
- Greenhouse effect has been falsified
Eclectic at 17:46 PM on 14 December, 2023CTS @176 :
an iceball Earth (at 255K or 271K) has how many clouds?
Have you really thought this through . . . and published?
- Greenhouse effect has been falsified
ClimateTruthSeeker at 16:43 PM on 14 December, 2023The often-quoted 255K black body temperature of the earth is wrong and the 33K GHE is overstated. This is due to the albedo being too high in the calculation which is meant to show what the temperature would be if the earth had no atmosphere at all.
However, the calculation falsely uses the albedo when an atmosphere exists, completely ignoring the fact that if there is no atmosphere, there are no clouds. Using a conservative estimate that 50% of albedo is attributed to clouds, this decreases the albedo from 0.3 to 0.15 resulting in a black body temperature of approximately 268K, reducing the GHE to 20K.
However, there would be further impacts on ice and water, and a more realistic albedo when there is no atmosphere at all is 10%, as others have postulated. This leads to a black body temperature of approximately 271K (-2.15C) and a theorized GHE effect of 17K, just over half of what was previously estimated.
- CO2 effect is saturated
MA Rodger at 18:47 PM on 27 October, 2023chuck22 @709,
I would suggest it is more that Venus shows what a thick atmosphere does to climate while Mars shows it for a thin atmosphere. Both have an atmosphere comprising about 95% CO2. Yet the surface of Mars has zero GH-warming while on Venus it is an impressive +407ºC.
Venus has about 80% of the solar warning relative to Earth, this due to its higher albedo (left hand graphic below) which more than compensates for being closer to the Sun. Thus the "naked planet" temperature for Venus (230K) is lower that Earth's (254K). Venus has a 92 bar atmosphere and the clouds in such a thick atmosphere are a major insulation mechanism preventing IR across the entire spectrum from escaping to space from anywhere near the surface.

Zhong & Haig (2013) show (their Fig6b) that the climate forcing on Earth from CO2 (which at 389ppm provides with feedbacks GH-warming of +34ºC) would be perhaps trebled by CO2 levels up near the 90% mark, (Fig6b shows the direct forcing up to ~30% CO2) an unrealistically high level, but it does show that additional CO2 does not "saturate".
- John F. Clauser: the latest climate science-denying physicist
Rob Honeycutt at 12:24 PM on 27 October, 2023TWFA... "...because the effects of cloud cover and weather is my primary area of interest I would appreciate links to that data."
Aside from your childish passage prior to this ask, there is a full body of research on cloud effects on climate. Perhaps you should endeavor to read the research instead of just assuming a preferred position.
One key clue that cloud effects aren't going to save us is merely the fact that, over the past million years we can see (through all kinds of paleo records) that the earth has gone through numerous glacial-interglacial cycles. We know the pacing and forcings that drive those cycles.
So, think about it. If cloud/weather effects were capable of offsetting changes in modern climate forcings, why would it not have done so over the past million years?
If what you're assuming were true, then we'd see no climate cycles because clouds/weather would always keep global temperature in equilibrium.
- John F. Clauser: the latest climate science-denying physicist
Eclectic at 09:19 AM on 27 October, 2023TWFA, you are skirting around the issue ~ of whether John Clauser is "yer average emeritus fruitcake" or whether he has achieved a brilliant Galileo-like stroke of genius . . . showing that all the prior scientific experts have been grossly wrong. While I do enjoy reading your discursive philosophical/lawyerly rhetoric, nevertheless you are failing to discuss the matter logically.
Please concentrate on whether Clauser is right or wrong about climate matters. (And note that the planetary history indicates that he is essentially wrong in his suppositions about clouds.) Do not dwell on whether Gore and/or Gates and/or China are offending your political identity issues or your personal economic-theory sensibiities.
Waffling discursions are quite easy ~ for instance , you will be aware of Kuebler-Ross's famous Five Stages of Grief. TWFA, you seem, climatically, to be showing the first two grief stages : Denial and Anger.
Have you reached the Bargaining stage (in hoping that that Clauser is right, despite a mountain of evidence that he is wrong) . . . or even the Depression stage? (Depression can indeed co-exist with the other stages of Anger etcetera.)
Are you fearful that the Acceptance stage threatens to change your inner character of personal identity? Personal change can be difficult for the ego to face up to ~ in the shorter run it's easier to keep in Denial.
See ~ rhetorical waffle is easy-peasy. And entertaining when it has an admixture of truth !
- John F. Clauser: the latest climate science-denying physicist
TWFA at 02:47 AM on 27 October, 2023I seem to recall that Bill Gates and Steve Jobs did not have any peer reviewed papers on computer science when as teenagers they charted the future of computing and communications and folks invested millions into their unproved, non peer reviewed theories.
I think it is healthy to get outside observation and critique from folks with good minds that may not be "set". One does not have to be a specialist or have studied the field all his life to ask why if none of the current models can accurately reproduce what has happened over the last century why should we have faith in their predictions for the next?
And "faith" is what it is all about, because nobody can "prove" the future while in the present, but we can hopefully understand the present with results from the past... if we choose to pay attention to them, and that applies to far more than climate science.
When folks accuse others of being "deniers" it means they themselves must be "believers", neither can prove their case with facts, neither can prove something will or will not happen in the future until the future arrives, meaning until then we are talking about religion and not science. "Show me a video of God and I will believe" vs "How could all of this come to be without Him?" If 99% of alleged scientists agree on something either it is no longer science or they are not scientists, it is either religion or they are evangelists.
As a non-peer reviewed entrepreneur, renaissance man and pilot flying ABOVE clouds I have always marveled at the weather, the incredible energy conversion and transmission capacity of phase change and latent heat, for decades before Clauser came along I have been screaming about cloud reflectivity because I have seen it first hand... all that light beneath me is going back to space. 70% of the Earth's surface is water, from which clouds will form, temperature goes up, more clouds form, more reflection, less insolation.
It's not rocket science, or even computer science, put a pot of water on the stove, no matter how high the heat the water temperature never gets above boiling. If what Al Gore said at Davos this year were true, that the oceans are boiling, presumably not just where magma is erupting, it would have defied the laws of physics and thermodynamics, it would be impossible to capture and retain such heat with the 100% cloud cover we certainly would have.
- ClimateAdam: The Vlog Brothers on geoengineering
rkcannon at 03:27 AM on 25 August, 2023Low sulfur diesel fuel has been out for how long? 25 yr? If this is reducing cloud formation, then diesel engine particulates may have been helping too by shielding the sun, and possibly creating clouds. Now particulates are so low you can't see any smoke. They even have particulate traps. China and India better keep burning coal since the smoke probably reflects the sun. Seems it is more complex than CO2 and could explain some anomalies.
- ClimateAdam: The Vlog Brothers on geoengineering
Markp at 22:49 PM on 24 August, 2023This is a reasonably well-done video by Adam, but there are some points that need to be made.
As many people have learned, the IPCC has done a pretty lousy job of informing the public, and the scientific views it presents have been warped both by the scientists themselves (the dreaded "scientific reticence" effect) as well as the politicians from 195 member countries that have veto power on much of the content released to the public which can be generally characterized as very, very conservative. In other words, it's way worse than they tell us, and their "solutions" not nearly as effective as they tell us. Adam and his friend Miriam are both, from what I can tell, very much cheerleaders for the IPCC. Not surprising: they are fresh out of university and so in that sense have not spent much (any?) time in the real world of working scientists, so their current YouTube careers aside, they may not want to annoy the IPCC-dominated narrative on all things climate.
Two big issues: 1) we need geoengineering more than they tell us, and 2) there is more to geoengineering than SAI.
1) Like so many climate scientists under the spell of the IPCC, (for many reasons which take too long to unpack here) Adam and Miriam accept the logic that the only necessary thing to do in order to reverse GW is to reverse GHGs, in other words, get rid of them. That's a little bit like having your doctor tell you that in order to cure your tobacco-caused cancer, you just need to stop smoking. Fighting the cause isn't always guaranteed to bring about a result in a timely manner. Reducing GHGs, yes, but who is doing that? Miriam said something like international agreements like Paris have "already reduced warming by 1C" and I say huh? All the talk of international agreements sounds good but isn't our reality, as anyone looking at our world's biggest problems today knows in an instant. Our "efforts" to reduce emissions are nowhere. It's not happening. Targets and discussions aren't enough. The point that people behind geoengineering make is: emissions reduction is not and WILL NOT happen fast enough to stop our ecosystem from collapsing. Additionally, carbon removal methods, whether nature-based or mechanical, have huge scaling problems. Yes, nature has dealt with CO2 in the past, but not like what we have now. They are very slow, are not always even feasible (tree-planting a perfect example, look at the studies) and have other issues such as water constraints making them impossible at scale. And mechanical CO2 removal is even worse. When it works, it's fast, but unscalable, with DAC being the most obvious case. So after the IPCC cheerleading stops, we have to face the music. We don't have time to rely only on the method of "turn off the tap and clean up the mess."
2) Geoengineering (you heard Adam slip in "SRM" as well, Solar Radiation Management, a type of geoengineering) is almost always equated with just ONE currently discussed method, which is Stratospheric Aerosol Injection, or SAI. That's because it's got a lot of billionaire-potential!
SAI is NOT more than a theory at this point, however. But you won't find that mentioned by many of its proponents. It is not the only way to go, is not loved by many (unbiased) climate scientists, has oodles of scientific problems to overcome if it would even work, and so is NOT the end of the geoengineering or SRM story. So Nigelj's characterization above, which makes it seem that SAI is ready-for-take-off, is wrong.
I will admit that, like the VAST majority of actual movement on climate we have seen, geoengineering efforts have a lot in common with disaster capitalism, and so should be checked out very thoroughly. Making money off of GW is the most effective thing we humans have done to date, which is a crime against humanity. Period. Governments now throwing large sums of money out for grants only on very narrowly-defined work chokes real progress. What we forget is that scientists have to get paid. Who pays them? Why? Most scientific research is arguably being funded by those who are expecting a product to patent and sell if things go well. Scientists are NOT always out there trying to find the fastest most practical fix here. The more tech that goes into it, the better. The more career-building we can get out of it, the better. That's why we see people talking about, of all things, space mirrors, as if simply putting them on the ground here to do what clouds and snow do is out of the question. There are people promoting that very idea and it has vastly more promise than any other geoengineering solution but is largely ignored (but that's changing) because it doesn't create billionaires and cannot be weaponized.
Like many things, this discussion has so much more to it than meets the eye. We need to think, REALLY think, and be realistic, and stop listening so much to government institutions (or their cheerleaders) that have almost never served anyone other than the powerful very well.
- Skeptical Science New Research for Week #31 2023
prove we are smart at 20:15 PM on 5 August, 2023Just a few questions for the scientists here:
Is all of this video true?
Do ocean vessils create "sea tracks" making clouds that shade out the ocean more than the dust blowing off-shore from the Sahara Desert often does?
Can it be simply done to seed the ocean air with air-blast sea-water droplets when atmospheric conditions are suitable and make clouds bigger to create shade and should it be done? Just wondering..
- Increasing CO2 has little to no effect
MA Rodger at 04:10 AM on 6 July, 2023manuel2001nyc @444,
You are very dedicated. It is a super-human task attempting to learn from the comments in a long comments-thread such as this.
I would guess the term "saturation" you used concerns more the saturation as in laser intensity** rather than any climatological/atmospheric consideration. (**That is, an excited CO2 molecule cannot absorb IR until it has returned to its unexcited state. Such consideration doesn't really apply here.)
As other commenters have explained, 15μm IR can be absorbed by CO2 and the resulting excited CO2 molecules would almost always then be in collision with other atmospheric molecules and lose its excitation in that manner. Thus the absorbed IR energy is converted into thermal energy in the atmosphere. This process is because these collisions with molecules in the atmosphere will occur within microseconds while the relaxation period allowing the CO2 to emit IR is on average in the tenths of seconds.
But that does not mean there is little 15μm IR emitted by CO2 or that such emissions are rare. As well as taking-away the excitation from a CO2 molecule, these numerous collisions can also impart excitation into CO2 molecules. Thus the vast majority of the excited CO2 is because of these impacts. And if the Earth's surface is at the same temperature as the local atmosphere, the CO2 will be shooting off the same amount of 15μm IR back down at the surface as the surface is shooting upwards. (Note the surface only shoots upwards while the CO2 will shoot both up and down)
So, to answer yor first question.
It is a rough rule in physics that the absorption and emission of photons balance, usually. If they don't there will be a net flow of energy, with more/less emissions cooling/heating the substance and thus reducing/increasing emissions. Thus the absorption-emission balance would be achieved.
The 8μm-14μm waveband is often called the Infrared Window because in a dry atmosphere the IR from Earth's surface has a clear path out into space. Clouds would block that clear path and water vapour acts as a weak absorber.
There is other IR absorbtion in the 8μm-14μm waveband. There is a strong ozone absorption band at 9.6μm. Also, if we do let CO2 concentrations rise far enough, CO2 absorption bands will appear close to 10μm, these starting to become significant for CO2 concentrations above 1,000ppm.
- Cranky Uncle: a game building resilience against climate misinformation
peppers at 21:19 PM on 16 June, 2023I have an ex wife who a year or so later, was 'fond' of me. I have an adversion to the word now!
How do we reconcile these 2 premises:
1. Characterizing another who does not conclude at this juncture, as; someone who is fond of misunderstanding climate science matters.
2. Oxford Dictionary; The systematic study of the structure and behavior of the physical and natural world through observation, experimentation, and the testing of theories against the evidence obtained (the definition of Science bearing no mention of conclusion, and also applies the inference that a conclusion would be an impediment to the process of science).
I dont think you mean to have a conflict with others still observing and testing theories.
Milgram's Six Degrees of Separation famously said that a butterfly can flap its wings in Peking, and in Central Park, you get rain instead of sunshine. As opposed to being settled, you cannot operate a scientific understanding without first not knowing. If you are steering to a conclusion, thats not science nor even close.
To add a bit more meat to the above poetic insertion, I'd like to add 2 observations. On November 22nd 2022 the world hit 8 billion, having increased exactly at the pace and curve of the famous hockey stick graph from 1 billion in the same time span. For a discussion about the planets ability to handle such a change, the clouds and atmosphere contain all the energy and ability to moderate that. However it is impossible to model any of it.
I say we need to observe, experiment and add theories to our incomplete knowledge of our world and of the solar system. More warmth, more moisture, more clouds, more albedo, etc.
Theories do not require immediate citations or proofing, however that would be the next thing sought. For the sake of theory ( not a belief nor desiring antagonizing), if we stay to any natural progression of things, the increase of our species having caused changes, if the natural offset were more warmth, moisture, cloud cover and albedo to offset this, are we interferring with natures response just because we would not want a warmer world, more weather, higher coastlines, etc.?
- At a glance - The greenhouse effect and the 2nd law of thermodynamics
Charlie_Brown at 03:30 AM on 9 May, 2023My next attempt. I hope this is getting better. I changed the first part quite a bit to emphasize that the key problem with G&T, often overlooked, is their assumption that the input solar and output IR radiation are balanced (see Fig 32). I think these are worthwhile revisions. The structure seems fact-myth-fallacy-fact because I wanted to begin by separating the 1st & 2nd laws, but bring back the 1st law facts to seal the deal. Please feel free to edit and use the input as you deem suitable.
The 1st law of thermodynamics is conservation of energy. The 2nd law describes limitations on how energy can be used in forms of heat and work. It is difficult to express without introducing the concept of entropy - a state of disorder that is hard to understand. Instead, the 2nd law can be expressed practically in the form of statements and corollaries. One translation of the Clausius statement is: “It is impossible to operate a cyclic device in such a manner that the sole effect external to the device is the transfer of heat from one heat reservoir to another at a higher temperature” (Wark, Thermodynamics, 4th ed., 1983). A key phrase is “sole effect external to the device.” A cyclic device can be a heat engine and the classic example is a refrigerator that requires adding external energy, electricity, to make it work. Gerlich & Tscheuschner’s paper describes modern global warming theory as a perpetual heat engine that transfers heat from the cold stratosphere and the warm surface. That would violate the 2nd law, but that is an incorrect description of global warming. They assume that the radiant energy input from the sun is equal to the radiant heat loss to space and the system is “radiatively balanced”. That would be true for the greenhouse effect before the industrial revolution but increasing greenhouse gases (GHG) upsets the balance and causes global warming.
Some take the myth even further to claim that thermal radiation cannot transfer energy from a cold body to a warmer one. Gerlich & Tscheuschner steer the discussion into distraction by emphasizing the technical distinction between heat and energy. Consider two walls facing each other. All objects above absolute zero radiate energy. The warm wall radiates more energy toward the cold wall, but the cold wall still radiates some energy toward the warm wall. The debate amounts to whether it is energy or heat that moves towards the warm wall.
Conservation of energy for any defined system is:
Input = Output + Accumulation
The global system can be defined as from the Earth’s surface to the top of the atmosphere. The input to the global system is the sun. The surface temperature is regulated by balancing heat input from the sun with heat loss from the top of the atmosphere toward space. When balanced, accumulation is zero. There are three output energy pathways: 1) Infrared (IR) radiation from the surface at wavelengths that are transmitted directly to outer space (the transparent range). 2) IR radiation from GHG in the colder atmosphere at wavelengths that are emitted by GHG, and 3) solar energy reflected by clouds and the surface. As the concentration of CO2 increases, energy output to space (path 2) is reduced. This upsets the global energy balance. Energy accumulates and the surface temperature rises. As the surface temperature rises, energy output from the surface through the transparent range (path 1) increases until the balance is restored. This is how global warming works. - At a glance - The greenhouse effect and the 2nd law of thermodynamics
Charlie_Brown at 08:09 AM on 7 May, 2023Here is my next attempt for the At-A-Glance section. It is 356 words. I will start by copying the "Myth" from the top of the main page. That saves trying to paraphrase it in the discussion.
"The atmospheric greenhouse effect, an idea that many authors trace back to the traditional works of Fourier 1824, Tyndall 1861, and Arrhenius 1896, and which is still supported in global climatology, essentially describes a fictitious mechanism, in which a planetary atmosphere acts as a heat pump driven by an environment that is radiatively interacting with but radiatively equilibrated to the atmospheric system. According to the second law of thermodynamics such a planetary machine can never exist." (Gerhard Gerlich)
The Clausius statement of the 2nd law of thermodynamics is: “It is impossible to operate a cyclic device in such a manner that the sole effect external to the device is the transfer of heat from one heat reservoir to another at a higher temperature” (Wark, Thermodynamics, 4th ed., 1983). The myth claims that back radiation or downward infrared (IR) radiation emitted by greenhouse gases (GHG) is the mechanism that increases the temperature of the Earth’s surface. Since that would not be possible according to the 2nd law, the myth concludes that global warming is false. However, the myth overlooks the fact that the sun is the external energy source that drives global warming and outer space is the external cold reservoir. The sole external effect is transferring heat from the hot sun to cold outer space. If heat loss to space is reduced, the planet will get warmer. Some take the myth even further to claim that thermal radiation cannot transfer energy from a cold body to a warmer one. Consider two walls facing each other and that all objects above absolute zero radiate energy. The warm wall radiates more energy toward the cold wall, but the cold wall will still radiate some energy toward the warm wall.
The 1st law of thermodynamics is conservation of energy – input = output + accumulation. The global system can be defined as from the Earth’s surface to the top of the atmosphere. The input to the global system is the sun. The surface temperature is regulated by balancing heat input from the sun with heat loss from the top of the atmosphere toward space. There are three output energy pathways: 1) infrared (IR) radiation at wavelengths that are transmitted from the surface directly to outer space (the transparent range). 2) IR radiation at wavelengths that are emitted by GHG in the cold atmosphere, and 3) solar energy reflected by clouds and the surface. As the concentration of GHG increases, energy output to space (path 2) is reduced. This upsets the global energy balance. Energy accumulates and the surface temperature rises. As the surface temperature rises, energy output from the surface through the transparent range (path 1) increases until the balance is restored. This is how global warming works.
- There is no consensus
Albert at 09:46 AM on 20 April, 2023"Such low ECS figures would mean the earth's climate should be almost perfectly stable over geologic time (no glacial-interglacial cycles) and we know that's not true."
Rob, believe it or not there are other factors that effect global temperature like, the sun, solar winds, magnetic fields, cosmic rays, transportation and retention and expulsion of ocean heat, volcanic activity above and below water, aerosols, clouds, gravitational pull of other planets, milankovitcg cycles, earth rotation wobble, shifting of poles, etc.
Our current warming cycle started around 1700 as The little ice age peaked negatively and we have been warming sporadically ever since.
its all perfectly normal with many historical precedents in the Holocene and previous interglacials.
1000 years ago Vikings colonised and farmed parts of Greenland that are still permafrost today. How can this be unless Greenland was far hotter than today. etc Etc etc.
But Michael Mann showed us in his model that the medieval warm period and little ice age never existed so all those thousands of scientists that proved they did exist must be wrong.
- There is no consensus
Albert at 20:54 PM on 19 April, 2023"The direct effect from CO2 is, as you say, ~1.2°C but you can't just reject physics and say there wouldn't be feedbacks. The feedbacks are very well known"
Not true. Even a basic knowledge of the complexity of modelling feedback would tll that it is impossible to model or prove.
it cannot be replicated in the lab or models, and any so called proof can easily be shown to be nit true.
if you know the basics of feedback theory you would know that the output to any given input has to be known precisely otherwise you cannot determine anything.
To give just one example, increased evaporation causes clouds and precipitation and there Are many scientists who believe that the feedback can only be negative or else there would be an exerthermic runaway.
but if you believe that feedbacks are "well known" pleas provide an exampl that is not ambiguous.
- The Big Picture
Bart Vreeken at 21:31 PM on 22 March, 2023N R N P @168
Shall I have a try in answering your questions? I live in The Netherlands and here we have the same kind of discussions. Excuse me in advance for my English, it seems to be horrible.
A. Changing for the worse?
I hope we do agree that the earth is warming. It's an on going process and we (science) expect that it will go on for a much longer time. So it gives a lot of changes in the climate almost everywhere.
A key point is that the continents and the oceans are warming in a different speed. The oceans are warming much slower. This has consequences. When the atmosphere warms up it can contain more water vapor. But the less warming ocean can't deliver enough water vapour to keep the more warming continents humid enough. As a result there is more risk for drought at many places.
An other thing is that the air whole circulation will change. It means that local climates can change more than the global average. Wet climates can turn to dry climates, but also the other way round. Our agriculture, infrastructure and houses are not (always) prepared for that.
As you know, a warmer climate makes the sea level rise. The warmer water in the ocean expands, the ice sheets and mountain glaciers are melting to a certain extent. This sea level rise will give a lot of problems in many coastal areas. Here in the Netherlands the protection against the sea is very well organized, we can manage the first one or one-and-a-halve meter in this century. When it gets more we have a problem, but we are already try to prepare for that. Other countries, including deltas in Asia and parts of the US are less protected and will have large problems before 2100. By the way, it's not only the sea level rise there. Many of these places have also subsidence of the land, but these two come together and the problems are coming much faster then without sea level rise.
And then there is the unpredictable part. We don't know exactly how the ice sheets will react. Maybe there are mechanisms for a quick decline of parts of the ice sheets. In that case we have less time to prepare for it.
Of course, there can also be places where the climate gets better, or at least in a part of the year. And at least, we will need less fuel for warming the houses. (but more electricity for cooling in the summer.)
An interesting point is the direct effect of the increasing CO2 level to the vegetation and the agriculture. Plants can grow faster with that. Remote sensing shows something like 'global greening'. But it's a mixture of natural response and increasing agriculture. The last thing is tricky when water recourses are limited. And as we have seen, the increasing risk for drought is a cause for concern by itself. Maybe you know the story of the Aral See?
Then your question B) changing because of human activities?
Yes, we can be sure about this. We could calculate the effect of increasing CO2 hundred years ago and it's just what happening. Other possible factors, like changing sun power don't have much effect, these changes are too small. The less known part is how the atmosphere reacts (water vapor, clouds), how the ocean circulation reacts, how ice sheets react in detail.
"C) why this time it is different than the changes that have taken place?"
The changes are going very fast now, and as I said, the houses, the infrastructure, the agriculture and the water supply are not prepared for these changes. And there is the risk for sudden, even faster changes (tipping points). - Climate Science Denial Explained
MA Rodger at 18:20 PM on 20 March, 2023eclectic @18,
I don't see Lindzen's opposition to the science as being motivated by religion. I see it as a scientist of some repute who lost the conclusive scientific debate over AGW in the 1980s but refused to admit defeat. While such stubbornness is not to be condemed (skepticism being a big part of the scientific process), Lindzen 'crosses the line' and sets out unscientific messages. I still remember his rather ludicrous contribution to the 1990 film 'The Greenhouse Conspiracy' (YouTube) which actually convinced me of the opposite view that AGW was real and likely a big problem being politically kicked into the long grass. (The 'crossing of the line' into non-science is not a wholly climate denier thing but they do seem to spend much more time doing it.)
Through the years, Lindzen did (indeed still does - see Lindzen & Choi 2022) continue work attempting to show that climate sensitivity is low and AGW not a problem for humanity, most famously his 'Iris Effect' which turns out to be a real effect but one having the opposite impact and one threatening significant increased warming.
- The Big Picture
Gootmud at 01:05 AM on 20 March, 2023Eclectic and John Mason @104
We do need models to predict whether it will keep on warming. As CO2's absorption spectrum saturates, it can't trap more heat. Negative feedback effects like clouds might nullify any warming. Temperatures might drop due to independent effects like magnetic field changes much more influential than the greenhouse effect. We might be at 600ppm, freezing, and looking for ways to warm the Earth and slow the advancing ice.
Without models that account for all these effects, we.know nothing about future temperatures. We don't know ranges of likely changes. We don't even know the sign. A model need not be perfect--no model is ever perfect--but it must be representative of all the relevant physics if we are to trust its output.
- Global warming: a battle for evangelical Christian hearts and minds
Eclectic at 23:24 PM on 13 February, 2023EddieEvans @55,
there's a large number of Dr Curry's own articles (among others) to be seen on her blog "Climate Etc" (at judithcurry.com) . But you may find it rather tiresome to wade through a good sample of them. Her modus operandi is to be vague & misleading to the naive/layman reader, by throwing up clouds of maybe & could-be & might-be.
At first glance you might feel that she is being a cautious scientist, in keeping her mind open to possible alternative explanations for modern global warming. But as you look at her track record and persistent line of do-nothingism "until we are really truly exactly sure of the precise amount of warming which is anthropogenic if any" . . . then you see that her AGW policy is in lock-step with the Oil Lobby. Basically she is a propagandist who seriously distorts mainstream climate science, in her own unique way. Plus a smattering of grievance about her persecution by those dreadful mainstream scientists (i.e. the 99%) .
# Thank you for the 2019 article you link to. A short but interesting article, authored by an economist Guy Sorman [age 78]. Sorman seems to have genuine virtues personally . . . though being an Old School free-marketeer (the Market is the solution to all problems).
However, Sorman has re-hashed much of Dr Curry's usual blend of half-truths and misleading information ~ great grist for his "conservative" readers of that City Journal for which he is a contributing editor ( I gather ). But very bad science.
- It's Urban Heat Island effect
HamletsGhost at 00:51 AM on 25 January, 2023In my view, the most important — and understudied — effect of UHI as it relates to global warming is the fact that large expanses of macadam act as heat sinks. This resuts in the phenomenon where by cities create their own weather: on the coast, UHI-expanses like that of Houston increase the effect of the landbreeze; stack moisture in clouds at a higher rate, and, eventually, drop more water onto the heat sinks. The rain cools these heat sinks off and, in the process, transfers warmer water into aquifers that feed the Gulf Stream.
Our senses, higher summer temperature readings at airports, and the chart above showing no significant difference over time between the temperature increase in rural and urban areas tells us this heat transfer is significant.
The UHI heat-transfer model explains both the effect on the polar ice cap and the warming of tropical waters. The Gulf Stream, now warmer than otherwise, leads up to the arctic polar ice cap and melts it. In the summer months, the Gulf Stream slows its transfer of warmer water into cooler water so that warmer water remains in Caribbean to develop into storm.
The Greenhouse Gas model does not account for any heat transfer arising from rain-cooled macadam. In omitting the fact of transfer, the Greenhouse Gas model must be inaccurate.
Within a model that takes into account UHI-created weather patterns and rain-cooled macadam, atmospheric increase in carbon dioxide is less as the cause of global warming than an index of burning.
- IPCC overestimate temperature rise
Eclectic at 00:02 AM on 10 January, 2023Pbarcelog @67 ;
Probably best to look to whatever underlying point your engineer friend is trying to make. Just as hurricane statistics vary considerably over decades, so too does snow cover vary ~ but neither of these measurements do "disprove" the major global warming observed.
It seems he is trying to cherry-pick one or other of whatever observations he can find, which . . . what? . . . show there is no warming and therefore no human-caused effect on climate? If that is his game (to convince himself at some emotional level of "no AGW") . . . then he is simply failing to look at the big picture. He is deceiving himself. And he is also failing to look at the paleo evidence of major climate changes produced by alteration in greenhouse gasses.
Does he have Conspiracy-type doubts that the past 170 years of thermometer measurements are all false, and all the climate scientists are wrong? If the planet is not warming, then why is the sea level continuing to rise?
He may feel that 0.2 Watts or 1.0 Watts is a tiny number . . . but the evidence keeps showing that the world is warming ~ whatever his (rather ill-informed) opinion might be about clouds.
The warming effect of increased CO2 level is only denied by the nuttiest of non-scientists ~ and they have zero evidence to back up their ideas of "no greenhouse effect". The effect of CO2 has been known for roughly a century. Basic physics explains it, and decades of observations confirm it.
(Please note that laboratory experiments cannot re-create the necessary full-depth atmosphere that produces "greenhouse" . . . so I have not bothered to review the "Backscatter Radiation" experiment you touched on ~ but if you feel there is something of great note & importance demonstrated in the experiment, then please discuss it in more detail, and preferably with a direct link to the paper.)
- IPCC overestimate temperature rise
pbarcelog at 20:24 PM on 9 January, 2023Hello everyone, I am trying to confront scepticals but there is people giving me a hard time. One retired engineer is arguing with Rutger's data set of snow coverage for the northern hemisphere, also the article:
The Influence of IR Absorption and Backscatter Radiation from CO2 on Air Temperature during Heating in a Simulated Earth/Atmosphere Experiment Thorstein O. Seim1, Borgar T. Olsen
and "Observational determination of surface radiative forcing by CO2 from 2000 to 2010" from Nature, because he states that 0.2w/m2 is almost negligible and clouds are order of mangitude more relevant.
Anyone familiar with that data and articles? What is the explantion to a stable snow cover for the last decades? The explanation to Seim's experiment and the relevance of the 0.2w/m2?
Thanks a lot, if you share your arguments with me I will guarantee they are well used in LinkedIn
- From the eMail Bag: the Beer-Lambert Law and CO2 Concentrations
Charlie_Brown at 07:45 AM on 27 December, 2022Scruffy @29
Bob’s example illustrates the concept of a diminishing effect of increasing CO2, but as I challenged in @1 and Bob agreed in @2, it is insufficient to fully explain the complexity of the saturation effect. I prefer using the figure that Bob @7 reproduced from SpectralCalc.com for me to explain the saturation effect not as cylinders or cells in series, but as absorption lines (absorptance = 1 – transmittance) in parallel where strong lines reach an absorptance of 1.0 at low CO2 concentrations while weak absorption lines contribute to increasing absorptance with increasing concentration.
It is much better to interpret the Beer-Lambert Law by looking down at the atmosphere from space than it is to look up from the surface. The common view of Beer’s Law considers attenuation of the energy emitted from a surface. For example, measure the energy emitted from a source, travels through gas such as CO2, and reaches the end of a cell. The NIST spectrum provides the results for the specified set of conditions using this approach. However, the energy that reaches the end of the cell from the original source does not include re-radiated energy. That is because IR absorbed by CO2 in the cell is re-radiated in all directions, mostly to the cell walls where it is absorbed by the cell walls. The geometry of the measurement cell, unlike the open atmosphere, precludes re-radiated energy.
You say “NO energy will be radiated into space in the CO2 absorption spectra - that atmosphere is completely opaque at those frequencies.” This should be clarified to say that none of the original source energy (photons) from the surface will be radiated into space because it will be absorbed and re-radiated along the path length toward space. However, all molecules above absolute zero vibrate and radiate energy. CO2 at all levels of the atmosphere will radiate energy. At the uppermost atmospheric layer containing sufficient CO2 molecules, energy radiated by CO2 will radiate to space in the CO2 absorption band, precisely because absorption lines have a value great than 0. Kirchhoff’s Law provides that absorptance = emittance (with the caveat of being at thermal equilibrium, which allows for energy transfer between molecules by collision or conduction in addition to radiation.)
Bob’s experiment in the original post demonstrates why it is better to view the effect of Beer’s Law on radiant energy escape to space by looking down from space. The atmosphere in the tropopause at an altitude of about 10-20 km is thin and cold. There is a lot of distance between CO2 molecules. The key is that there is a very long path length available, sufficient to bring many of the absorptance lines in the CO2 band to 1.0. With increasing CO2 concentration, even the absorptance of very weak lines becomes significant.
Your description of the overall global heat balance is incorrect. Increasing CO2 will cause more heat to be absorbed closer to the surface, and this will lower the temperature of the tropopause. This is part of a special and complicated signature of global warming by CO2. It actually reduces emittance to space, aggravating the greenhouse effect rather than offsetting it. The greenhouse effect is driven by the temperature profile of the upper atmosphere. What happens in the troposphere below the tropopause, including convection, conduction evaporation, and condensation, just moves heat around within the troposphere. You mention the effect of water vapor, which also exacerbates global warming as a positive feedback effect. The role of clouds is complicated. High, cold cirrus clouds can increase warming while low, warm, thick clouds can reflect solar energy. All of this is discussed in detail elsewhere, and is beyond the scope of a single rebuttal. But if you have any more specific questions that are stumbling blocks for your understanding, I will try to address them as succinctly as possible.
- Skeptical Science New Research for Week #50 2022
nigelj at 11:11 AM on 17 December, 2022Peppers
"Humidity and clouds cannot be modeled, tracked or controlled, which will be vexing to all the white knights out there."
We do have an understanding of clouds. Latest research:
www.washingtonpost.com/climate-environment/2022/12/12/climate-change-clouds-equilibrium-sensitivity/
- Skeptical Science New Research for Week #50 2022
Bob Loblaw at 01:15 AM on 17 December, 2022Peppers @ 4:
Your first sentence covers two standard myths, found on the SkS list of "Most used climate myths" (upper left of every page - here is a direct link to the list).
Your second sentence in nonsense. Humidity and clouds are indeed modelled and tracked. After all, we know that humidity exists (and changes with location and time), and I can see clouds out my window right now. We have long-standing data sets recording both for well over a century. Weather forecasts and climate models routinely include both in their calculations.
Controlling clouds and humidity? Maybe there you have a bit of a point. On a global scale, our "control" is limited to the changes we are causing due to warming caused by our emissions of CO2. (Read the above lings on trace gas and water vapor.)
In the rest of your paragraph, you seem to be confusing hydrogen and nitrogen. Nitrogen is 78% of the atmospheric gases. Hydrogen is less than 1%. And the information in the original post is how hydrogen will affect methane concentrations.
Whatever is guiding your understanding, you really badly need to find some better sources of information (or find a way of getting a better understanding of what you are reading).
- Skeptical Science New Research for Week #50 2022
peppers at 00:06 AM on 17 December, 2022I am still struggling with our involvement with Co2 at .04 of 1% and water vapor is the main ghg factor at a hundred times more the effect at up to 4% of the total volume. Humidity and clouds cannot be modeled, tracked or controlled, which will be vexing to all the white knights out there. And now we are considering dangerously affecting hoydrogen which is 78.02% of our atmosphere? I am not getting the data here that we have the power or culpability to be significant in these regards. But I seriously question whether we can affect anything involving 78% of our entire atmosphere. Is this serious?
- SkS Analogy 9 - The greenhouse effect is a stack of blankets
Charlie_Brown at 07:27 AM on 20 November, 2022The blanket analogy is fine for those who are not familiar with radiant energy transfer. For those who do know a little about it (think night vision goggles), there are other analogies that could be used that are not based on thermal conduction heat transfer. 1) Smudge pots used in fruit orchards on cold, clear nights. Increasing CO2 would be akin to thickening the smoke layer. 2) The effect of cloud cover on cold, but otherwise clear, nights. Similarly, increasing CO2 would be akin to thin clouds vs. thicker clouds. 3) Mylar space blankets instead of fabric blankets. Increasing CO2 would be akin to filling in holes changing the material to reduce the emissivity. There are weaknesses in the analogies, but they can help to convey the message about global warming. Resolving the weaknesses can be educational. A technical description necessarily involves emissivity as a function of wavelength. The Advanced description in “Is The CO2 Effect Saturated” is excellent. The Basic description also is very good because it includes the critical effect of cold temperature at high altitude with a very nice graphic image. The 27 pages of 668 comments are tedious to work through because they contain a lot of misinformation mixed in with some very good information, and it takes quite a bit of critical thinking to sort through what is accurate and important. I will post my additional comment there, at risk of making repetitive points and being lost in the mix.
- 2022 SkS Weekly Climate Change & Global Warming News Roundup #42
scvblwxq1 at 10:11 AM on 30 October, 2022The Earth has feedback systems like clouds and rain and storage system like the deep ocean that can maintain the temperature of the Earth when Solar input increases for a time but Solar irradiance increases it will eventually increase the temperature. The Sun is by far the major source of heat to the Earth, radioactivity contributes a small amount but CO2 at best is only moving the heat around.
Here in Cleveland we have had 161 days colder than average and 136 days warmer than average, using the Weather Underground average daily temperatures, which suggests cooling supporting Dr. Zharkova Grand Solar Minimum.
https://www.wunderground.com/history/daily/us/oh/cleveland/KCLE
Solar irradiance has increased greatly since 2020, warming the Earth even more than the 50 years of high irradiance reported by Dr. Penza. https://lasp.colorado.edu/lisird/data/tsis_tsi_24hr/
We have 4.5 million people dying each year from moderately cold weather-related causes, mainly from strokes and heart attacks caused by the cold, while only about 500,000 are dying from heat-related causes and most of them were also from moderate heat.
https://www.thelancet.com/journals/lanplh/article/PIIS2542-5196(21)00081-4/fulltext
Half the energy we produce goes to heating. We live in heated houses, work in heated buildings, drive around in heated cars, wear lots of warm clothes and shoes much of the time so we probably don't appreciate how cold it is. https://www.weforum.org/agenda/2019/08/we-need-to-rethink-the-way-we-heat-ourselves-heres-why/
- CO2 effect is saturated
Eclectic at 21:28 PM on 11 September, 2022Hi GreenEarth (@661) ,
Offhand, I am not sure which would be the best page here to point you to ~ IIRC this information can be found on a number of threads (and perhaps a kindly Moderator can indicate some suitable ones).
What we are talking about is very basic stuff known by all physicists having any connection with radiation & atmosphere (in other words, climate science).
In short, the atmospheric molecules are all knocking about against each other. Likewise for the various molecules of the Earth's surface ~ energy passes from surface to atmosphere, and vice versa, by these impacts. There is also bi-directional energy exchange between the planetary surface and adjacent air, via radiated photons. (Of course, there is also short-wave photonic energy coming from the sun ~ including from clouds, dispersion by dust etcetera in the air.)
The surface loses "heat" upwards by convection, by evaporation/condensation, and by radiation (mostly by radiation into the atmosphere, but a small amount by direct radiation out to space via the "window" band around 10 microns). The so-called "sensible heat" loss (producing warm air and thus convection) derives from molecular impacts as well as the limited-range radiation you have mentioned earlier.
Once the energy has risen to the so-called Top Of Atmosphere [TOA] it can then be radiated out into space (the TOA altitude level is different for CO2, H2O, CH4 , and other greenhouse gasses).
I hope I have not been repeating too much stuff that you already know.
The essential point is that because the greenhouse gas molecules are so thinly distributed among the bulk of N2/O2 air molecules, they are speeding/ slowing/ vibrating owing to impacts with the N2/O2 molecules which are moving at the (average) speed determined by the local air temperature. In effect, CO2 [for example] is able to broadcast 15 micron photons by gaining energy from local air (and by radiating, effectively cools the adjacent air). Almost all the energy for radiation comes from impact energy ~ and only a minuscule amount is contributed from a received/absorbed 15 micron photon from a "distant" CO2 molecule.
This is the reason why the concentration of CO2 at near-surface altitude is irrelevant to the greenhouse warming effect ~ because the concentration at TOA is the important determiner of the planetary effect. Then we get to the importance of the temperature at TOA and the actual altitude at TOA combined with the Lapse Rate temperature gradient.
GreenEarth, my apologies if my condensed explanation is not as clear as you would like, but I hope it sets you off in a useful direction of exploration of the basic concepts. And I would be interested to know where the incorrect ideas you got were coming from.
- How not to solve the climate change problem
scvblwxq1 at 02:03 AM on 29 August, 2022The 20% figure for deforestation is from the Environmental Defense Fund.
It looks to me like defostation is a major cause of CO2 increase. Deforestation has certainly increase over the years.
CO2 growth has been around 2 ppm per year. The level is abot 400 ppm. The 20% figure is about 80 ppm. That is about 40 years of CO2 increase from deforestation alone. Deforestation in the Amazon dramatically increased around 1991 and has countinued to increase since then.
It would take many decades and trillions of dollars to get rid of fossil fuels and it certainly hasn't warmed enough for most people to want to pay much extra for it. Buying up the rain forests would probably be much cheaper. Florida and Texas are still getting large immigration from people in the north seeking a warmer environment.
The Sun is also emitting less energy and we don't know how much less it will drop and when it will return to normal. The feedback effects will mean more clouds and rain as well as a cooler environment for an unknown amount of time. We may be needing fossil fuels more than ever.
- There's no tropospheric hot spot
Cedders at 07:42 AM on 21 August, 2022Thanks to you both for trawling through this. I was wary that linking to the document might boost its search engine ranking, but here it is via archive.org (16 of the 24 pages in the printed version). It doesn't have the professional gloss of a Heartland publication, but any documentation with one or two specious arguments helps some members of the public justify their preferred position.
Both papers look useful in understanding important features of atmospheric physics before thinking about how greenhouse forcings affect them. I'm not sure why search engines didn't find them for me; or maybe I was looking specifically for greenhouse effects. I find Seidel et al the easier of the two to read and providing the simplest rebuttal: there really isn't much diurnal temperature variation to influence OLR in any case. Gristey et al confirms 'diurnal temperature range becomes negligible at around 100 m altitude' (above surface), suggesting it's surface temperature that is most important in their Sahara example, followed by clouds and convection.
Gristey et al also suggests to me that the effect of increases in LLGHGs and specific humidity will reduce transmittance, so also reducing OLR coupling to surface 'hotspots' and further reducing what small diurnal range there is at, say, the tropopause. I am a bit confused why the OLR varies proportionately more over the day than the temperature at 500 hPa (Seidel fig 3), but suppose the atmospheric window (IR emitted from the surface that never interacts with atmosphere) is important.
On the logic of rising emission layers: 'Being thinner (less O2 & N2 but same CO2), it would presumably have a lower specific heat capacity, so for the same IR flux it would cool quicker,' - well put, that is where I thought there might be some merit in the new argument - 'but being at a higher/colder altitude it would be shooting off less cooling IR.' I wasn't convinced by that caveat, because shouldn't the OLR/cooling IR at the TOA remain what you expect at 255 K? So 'upper atmosphere adjusting quicker' might have a grain of truth in it, but adjusting to what (space mostly?), and doesn't it imply regressing to diurnal mean more quickly? In any case, there's no empirical support for increased diurnal range.
'And in the literature I haven't heard of any consideration of the diurnal range up in the upper troposphere beyond cloud formation which suggests if there is some effect, it is all rather obscure.'
Very obscure, but that doesn't mean it doesn't serve the contrarian's purpose. I probably would never have thought about the 'hotspot' itself, not being prone to expeditions in high-altitude balloons or worried about that part of the atmosphere, were it not for various contrarians using the very lack of empirical data to argue for a flaw in established theory. These arguments are about fine details, emphasising them as if they were important, to distract from a central point that someone wants to avoid.
- What on Earth is up with Heatwaves?
Jan at 01:42 AM on 12 August, 2022The video is a nice example of why even the experts loose the oversight and do not anymore understand what's going on or what's causing this heat to become so much more likely as you have to understand Earth for the complex answer!
(1) higher mean temperatures - so much is clear!
(2) non-linear increase in marine heat waves - neighboring landmasses get cut off from moisture and neighboring warm waters lead to higher temperatures over coastal areas.
(3) the drying out of the atmosphere - relative moisture values decline over the land masses leading to higher temperature increases as evaporation is not buffering temperature increases what is supercharging the drying out of the vegetation what is again reinforcing the drying out of the atmosphere - vicious cycle!
(4) early snow melt leads to dryer springs and summers which become warmer. And receding snow cover now in all seasons.
(5) drying our of rivers which is increasing the drying out of the vegetation and atmosphere. Here the smaller glaciers that are vanishing are important, as many small streams are now vanishing.
(6) higher water vapor content in the tropics leads via extreme convection in the tropics over the expanding warm water surfaces to an increased release of latent heat - condensation - and when the dry but extreme energetic air descends it gets extremely warm again on its way down (gets compressed again) where it causes extreme heat waves - across the subtropics where the air of the tropics normally descends. Further, the dry air descends into drier air thus no clouds forming.
(7) the meridional heat transfer in the Earth system in speeding up thus warmer waters and warmer air masses move farther away from the poles which are then contributing to extreme heat waves.
(8) As the tropical oceans are warming fast - e.g. indo-pacific warm water pool is expanding fast - extreme convection is intensified thus the brian dobson circulation in the stratosphere is enhanced - the air raises from the surface oceans ou into the stratosphere from where i risies further up on its way to the poles only to come down again in the mid to high latitudes. And where the air from the stratosphere descends it can reinforce heat waves (high pressure systems) across the mid and high latitudes. Further, the descending air from the stratosphere brings high Ozone loads to the surface what is also contributing to the heat at the surface.
(9) then we have a changing planetary circulation - the meridional direction (north/south) is increasing and the zonal direction (east/west) is weakening. The main cause is here that the zonal air flows are increasingly disturbed and redirected into a meridional direction by blocking systems.
(10) the increasing transport of cold air equatorward and warm air poleward leads to increasing zonal temperature differences which reinforce north/south air movements. And tropical/subtropical air moving poleward causes more heat waves.
(11) vanishing sea ice disturbs the jet around the Arctic and Antarctic now which is meandering more thus also contributing to an increasing meridional air transport leading to more heat waves.
(12) next dryer air leads to lesser clouds - and as we observe now large areas of the continents drying out the cloud feedback in heatwave-affected areas is getting stronger. Further, we observe now over heatwave regions and marine heat wave regions a decline of cloud cover thus we have here also a vicious cycle.
As a concluding remark: the emergence of large-scale exceptional heat waves is in many aspects a vicious cycle that will have an extreme impact on the carbon cycle and its subcycle the methane cycle now becoming an important driver for global warming - in short: we have now entered self-amplifying warming!
And sorry for the mistakes i have made, but this was only a short improvised oversight of the factors driving the recent emergence of extreme heat waves long before we anticipated them!
- Infrared Iris will reduce global warming
scaddenp at 06:45 AM on 10 August, 2022More from the Ito and Masanaga paper:
"The longwave CRE at midnight infers a negative feedback just as predicted by the stability iris hypothesis, while the noontime CRE suggests a weak positive feedback in which the shortwave heating owing to a shrinkage of anvil clouds slightly outruns the longwave effect. These competing effects are estimated to largely cancel each other out when aver-aged over a diurnal cycle. The stability iris effect is suggested to be nearly radiatively neutral in a climatological context, although away from neutrality on subdaily time scales."
- Infrared Iris will reduce global warming
MA Rodger at 22:22 PM on 9 August, 2022I don't have a problem accessing Lindzen & Choi (2022) 'The Iris Effect: A Review'. The problems with any post-2011 up-date start when you do access Lindzen & Choi (2022). The vast majority of the 5,000-plus word account is re-fighting lost battles of the past, battles that actually pre-date the SkS OP above. In essence, all Lindzen & Choi are saying is that climatology has yet to nail down cloud feedbacks so don't forget the Iris Effect, although they give little enough reason for such remembering. And while Lindzen attempts to relive the past, the work on clouds continues along as it always did, including tropical ocean cloud with recently for instance Ito & Masunaga (2022) 'Process level assessment of the iris effect over tropical oceans' stating their "results show that a theory focusing on the air temperature structure around anvil clouds is likely at work in the tropical atmosphere, although the anvil's warming and cooling effects would offset each other during the whole day and night."
- CO2 effect is saturated
Eclectic at 12:55 PM on 6 August, 2022My apologies, OldHickory @646 and prior ~ but I am having difficulty understanding exactly where you think the climate scientists are wrong about the physics of climate. And it's likely that other readers are sharing my difficulty.
Please explain yourself more clearly. You seem to be ignoring the effect of the atmospheric Lapse Rate, which is so crucial to the mechanism of "greenhouse".
And infra-red photons from the planetary surface can only go a short distance before being absorbed by a CO2 or H2O molecule. Most of those photons would not even reach the rooftop of your house. So in that sense you can say that the lower atmosphere is "saturated" for CO2 , H2O etcetera ~ and it would be "saturated" whether the CO2 level were 200ppm or 400ppm or 800ppm or 1600ppm.
But the concentration level of greenhouse gasses at the bottom of our atmosphere will directly affect the concentration level near the TOA, and the TOA (for each specific gas) is the level where the infra-red is radiated out into space. The lower levels of air have a colossal re-cycling of IR photon energy . . . but what ultimately matters is the temperature of the TOA level. Because that is the level from which our planet loses (to space) the heat energy being gained from the sun. (Here I am disregarding the directly reflected sunlight from Earth's surface; and also the small portion being the IR "window" where IR of that wavelength that can pass directly through the air & clouds).
And the TOA temperature is dependent on the Lapse Rate. Conversely, the Lapse Rate determines the surface temperature, if you care to think about it in that way.
- 2nd law of thermodynamics contradicts greenhouse theory
MA Rodger at 21:11 PM on 18 July, 2022grindupBaker @1509,
You ask about a particular statement within this talk by Jennifer Kay 2021 'How do clouds affect global warming?'. @6:30 the video addresses the question "How do clouds affect the mean climate?" pointing to a net global mean effect of -21.1Wm^-2 (thus cooling), this comprising -47.3 Wm^-2 (cooling effect) due to albedo and +26.2 Wm^-2 (warming effect) due to a "longwave effect." Thus the statement:-
[From 8:04] "Clouds also have a longwave effect on the system. Just like greenhouse gases in the atmosphere, clouds absorb and re-emit long wave radiation and that actually causes the surface and the atmosphere to be warm."
My own objection to this statement would go no further than pick up on the use of the term "re-emit."
Your objection that "only a tiny portion" of the LW radiation arriving at the surface were 're-emitted' from clouds apparently expresses a similar concern.
But I'm not sure why you would then go beyond simply suggesting the replacement of "re-emit" with "emit". You appear to want to distance these cloud IR emissions from surface warming with description of them setting off "absorb-and-re-emit cycles before succeeding in achieving surface absorption," a description that deploys the very same objectionable "re-emit" term.
The point the video makes is that the climate system ("the surface and the atmosphere") is warm to the level it is significantly because of this long wave cloud effect. And I think we agree it is this warmth that sets the level of IR whizzing about in the atmosphere as well as the level being absorbed and emitted by the surface.
(And as a point of note: I recall that perhaps some 10% of the LWR from clouds will be due to reflection and presumably some will be directly returning surface-emitted IR back to the surface.) - 2nd law of thermodynamics contradicts greenhouse theory
grindupBaker at 16:03 PM on 18 July, 2022MA Rodger @1508 Your "grindupBaker @1507, You ask ... that atmosphere." Thanks. I'll put some thought this winter into wording gooder that bit because "sourced from surface re-emit" is precisely what I object to as being stated as the source of all downwelling LWR at surface and yet the Bob Loblaw glossed right past "re-emit" and focussed a challenge on 50% when I could have readily typed "most" or "some" or "a bunch" instead of "50%" without changing the meaning of my objection at all, and then you stated outright that I was silent ("unchallenged") on "re-emit" so my phrasing there is somehow poor. It isn't just a junk-science cartoon, it's one of the scam types that have served the "Skeptic" community very well the last couple of decades (Henrik Svensmark did a nice one). That junk-science cartoon is the nasty, cunning Scam of Omission (aka The Dog That Barked in The Night). A photon leaves surface, absorbed by CO2 molecule, re-emitted upward, no change, another photon leaves surface, absorbed by CO2 molecule, re-emitted downward, warming surface, got trapped (maybe a couple of repeats in cartoon). It's obvious even to an uneducated mind that this will cause warming so the "greenhouse effect" makes perfect sense. However, an uneducated mind doesn't think to wonder "so is this all that CO2 molecule does regarding photons then ?". The cartoon states outright that the CO2 molecule never gets vibration due to a collision and then sometimes emits a photon in a random direction even though it didn't absorb a photon to re-emit. I could modify that cartoon to show that CO2 molecule emitting 2 photons without absorbing a photon for every photon it absorbs and then adding a CO2 molecule increases upward radiation, so using that junk-science cartoon I could show the public how increased CO2 is actually cooling Earth and how "they" have been deliberately leaving this out to fool people as a hoax. Of course, we both know that radiation to space must decrease with increased tropospheric GHGs because the average emission level becomes higher, becomes cooler and emits less. The bods presenting that cunning Scam of Omission cartoon need to be brought to task by presenting the "greenhouse effect" correctly (like Andrew Dessler does) or the public is going to think it's all a scam when what I've pointed out here is pointed out to them in a form without explanation that's not designed at all to educate them.
Do you concur with physicist climate scientist Jennifer Kay statement at 8:09 at https://www.youtube.com/watch?v=kE1VBCt8GLc that "clouds absorb and re-emit long-wave radiation and that actually causes the surface and the atmosphere to be warm", or do you concur with me that Jennifer provides incorrect physics regarding what "actually causes the surface ... to be warm" because only a tiny portion of the photons that arrive at the surface are "clouds absorb and re-emit" photons, with the vast majority being "manufactured by H2O collisions in clouds" photons (with any number 0 to n of interim absorb-and-re-emit cycles before succeeding in achieving surface absorption) ?
- 2nd law of thermodynamics contradicts greenhouse theory
grindupBaker at 03:06 AM on 15 July, 2022The underlying heat-adjustment effect works like this:
---------
"GREENHOUSE EFFECT", TRYING TO WARM IF THE QUANTITY INCREASES
- The "greenhouse effect" in Earth's troposphere operates like this: Some of the "LWR" aka "infrared" radiation heading up gets absorbed into cloud above instead of going to space so that's the "heat trapping" effect of a cloud. The top portion of the cloud radiates up some of the LWR radiation that's manufactured inside the cloud but it's less amount than the LWR that was absorbed into the bottom of the cloud because the cloud top is colder than below the cloud and colder things radiate less than warmer things. That is PRECISELY the "greenhouse effect" in Earth's troposphere. It's the "greenhouse effect" of liquid "water" and solid "ice" in that example. You can see that "greenhouse effect" of liquid "water" and solid "ice" for all the various places on Earth from CERES satellite instrument at https://www.youtube.com/watch?v=kE1VBCt8GLc at 7:50. It's the pink one labelled "Longwave....26.2 w / m**2" so cloud globally has a "greenhouse effect" of 26.2 w / m**2.
- Solids in the troposphere have the exact same effect as the "cloud greenhouse effect" above for the exact same reason.
- Infrared-active gases in the troposphere (H2O gas, CO2, CH4, N2O, O3, CFCs) have the exact same effect as the "cloud greenhouse effect" above for the exact same reason. Non infrared-active gases in the troposphere (N2, O2, Ar) have no "greenhouse effect" because their molecule is too simple to get the vibrational kinetic energy by absorbing a photon of LWR radiation or by collision. The "greenhouse effect" really is that simple, and it's utterly 100% certain.
---------
SUNSHINE REFLECTION EFFECT, TRYING TO COOL IF THE QUANTITY INCREASES
- Clouds (liquid "water" and solid "ice") absorb & reflect some sunlight and the "reflect" part has an attempt-to-cool effect, which has nothing whatsoever to do with the "greenhouse effect". You can see that "sunlight reflection attempt-to-cool effect" of liquid "water" and solid "ice" for all the various places on Earth from CERES satellite instrument at https://www.youtube.com/watch?v=kE1VBCt8GLc at 7:50. It's the blue one labelled "Shortwave....-47.3 w / m**2" so cloud globally has a sunshine reflection effect of 47.3 w / m**2.
- Solids in the troposphere absorb & reflect some sunlight and the "reflect" part has an attempt-to-cool effect, which has nothing whatsoever to do with the "greenhouse effect".
- Infrared-active gases in the troposphere (H2O gas, CO2, CH4, N2O, O3, CFCs) do not absorb or reflect any sunlight (minor note: except a tiny portion in the high-frequency ultraviolet where O2 & O3 has absorbed most of it already in the stratosphere above the troposphere).
---------
NET EFFECT OF THE 2 ENTIRELY-DIFFERENT EFFECTS DESCRIBED ABOVE
- The net result of the 2 entirely-different "cloud" effects is that clouds have a net cooling effect of 21.1 w / m**2 as seen in the blue-hues pictorial at left on screen at either of my 2 GooglesTubes links above.
- The net result for solids in the troposphere is a net cooling effect because the change in this effect by humans is the "global dimming" atmospheric aerosols air pollution effect and that's a cooling effect (separate from its cloud change effect).
- The net result for infrared-active gases in the troposphere (H2O gas, CO2, CH4, N2O, O3, CFCs) is a warming effect because their 2nd effect above is negligible, essentially zero.
---------
Cartoons or text that describe a "greenhouse effect" in which photons from the surface are absorbed by infrared-active gas molecules and then are re-emitted with 50% of it going down and warming the surface are incorrect because they do not include a tropospheric temperature lapse rate which is an absolute requirement. Explanations of the "greenhouse effect" which include phrases like "the radiation from the surface does not directly heat the atmosphere" are incorrect because there are simple laboratory experiments which prove that infrared radiation does indeed heat the CO2 infrared-active gas and its surroundings (which means, of course, that molecular vibrational kinetic energy is converted on collision to molecular translational kinetic energy before it happened to "thermally relax" and emit a photon and thus no photon was "re-emitted" in that case).
++++++++++
Cloudy winter nights don't cool as much as clear-sky winter nights. It is PRECISELY the "greenhouse effect" in Earth's troposphere which causes that. - Clouds provide negative feedback
Bob Loblaw at 06:00 AM on 13 July, 2022Likeitwarm:
The paper by Mulmenstadt et al that you mention was covered in this blog post at Skeptical Science, around the time it first appeared. (SkS reposted the Carbon Brief article.)
In that post, a key summary is:
However, the lead author of the study tells Carbon Brief that fixing the “problem” in rainfall simulations “reduces the amount of warming predicted by the model, by about the same amount as the warming increase between CMIP5 and CMIP6”.
So, the results are not as earth-shattering as you seem to want to imply. Uncertainties in cloud feedback are a well-known part of climate modelling and understanding, and this paper represents one more small step in helping understand the consequences.
As for your description of the water cycle:
- A wet surface evaporates more than a dry one. This transfers energy as latent heat into the atmosphere, and reduces the energy transfer as sensible heat (thermal energy). Thus, it priimarily changes the balance in how the energy reaches the atmosphere, not the total.
- What evaporates evenutally condenses and falls out as precipitation, but it rarely condenses or precipitates over the location it evaporates. Most extra water vapour is transported to other regions, where it falls as precipitation.
- Oceans receive far less water via precipitation than they lose as evaporation.
- Land areas (mostly) are the opposite - much more precipitation than evaporation.
- Increased evapoation does not necessarily lead to increased cloud cover at the evaporation location. Any changes in cloud type, amount, etc., are strongly depndent on when and where and how that cloud eventually forms.
- This complexiity is why cloud feedbacks are still an area of active study.
- The current understanding remains that clouds provide neither strong negative or positive feedback.
As for your discussion of "runaway warming" - nobody is predicting such a result due to CO2, so you are arguing a strawman.
And as to "self regulation of the temperature of the atmosphere" - the simple fact that climate has changed in many ways, for many reasons, over centuries and millenia is strong evidence that this is not true. Perhaps try reading the "Climate's changed before" post that reponds to our number 1 myth listed in our "Most Used Climate Myths" in the top left sidebar of all our pages.
I have worked through some darn cold sunny days in winter - much colder than overcast days in summer - to illustrate how incomplete your cloudy/sunny day closing statement is.
- Clouds provide negative feedback
Likeitwarm at 02:02 AM on 13 July, 2022Being a layman, it seems to me that the normal water cycle cools the surface through conduction and evaporation. That energy is eventually released to the upper atmosphere through convection and condensation of cloud formation. Low warm clouds in turn will block more radiation from the sun keeping the ground cooler, negative feedback: Johannes Mulmenstadt et al 6/3/2021 paper.
"As the atmosphere warms, part of the cloud population shifts from ice and mixed-phase (‘cold’) to liquid (‘warm’) clouds. Because warm clouds are more reflective and longer-lived, this phase change reduces the solar flux absorbed by the Earth and constitutes a negative radiative feedback."
See an article about this paper "Cooling effect of clouds ‘underestimated’ by climate models, says new study"
This process seems that it would cause self regulation of the temperature of the atmosphere preventing the possibility of the atmosphere from ever overheating and becoming uninhabitable, i.e. runaway warming. Maybe in a repeating cycle such as more co2=>more warming=>More h2o=>more warm cloud cover=>more cooling=>less co2=>less heating=>less h2o=>less warm cloud cover=>more heating=>more co2 and so on. This seems that it could cause long periods of heating and cooling, maybe decades. Let me know where I'm wrong.
I always thought it was cooler on cloudy days than sunny days. - Skeptical Science New Research for Week #26 2022
Doug Bostrom at 08:10 AM on 4 July, 2022"It is physically impossible that the balance is not there."
Yes, and here in the context of CO2 added to the atmosphere that balance is to do with radiative equilibrium. Equilibrium will happen— accompanied by many changes, mostly of an awkward nature as can be seen if one bothers to check research findings. One can easily calculate a ratio of good/bad by following NR, here. The ratio isn't good.
"That meteor 66 millions years ago ( killed dinosaurs and 3- of every 4 living things on earth) lowered the world 5 degrees overnight and darkened the earth completely sunless for 6 years. 30 degree F drop in 6 years, then swinging higher than previous normal and climbing to 2000-2500ppm once the sun returned. It all came back."
After enough death and dying (aka "evolutionary pressure"), everything was fine— right, got it. And the human species is collectively behaving like a brainless rock, yes. How is this good news, consolation, or reassurance? Meanwhile, thinking in geologic time isn't our nature and as well isn't really helpful in terms of dealing with changes happening right now.
The irony kicker:
"More co2 increases foliage (detected by Nasa's MOTIS), more transpiration, more moisture in the air, more low clouds with higher albedo."
If one bothered to follow NR and rather than instantly singing a comforting cantata of vague hopes instead read only titles and abstracts of papers listed here, one wouldn't make such a glib, facilely optimistic remark. One would know that neither of those claims pencil out as salvation.
- Skeptical Science New Research for Week #26 2022
peppers at 00:53 AM on 4 July, 2022I see this as a sort of misplaced approach to this issue, as all this data does little to folks passing by your stand at the swap meet. You are addressing people who may be saying there is no changing happening, and I dont think that remains logical. But some may be saying that to be obstinant or antagonistic. For myself, I dont think that change is happening is hard to see. The crisis stated by all this refers to the hockey puc being a precident in history, and the world will now be ending shortly by a runaway cycle. The train barreling down on a next generations child was the fearsome icon. But the world has experienced this before. That meteor 66 millions years ago ( killed dinosaurs and 3- of every 4 living things on earth) lowered the world 5 degrees overnight and darkened the earth completely sunless for 6 years. 30 degree F drop in 6 years, then swinging higher than previous normal and climbing to 2000-2500ppm once the sun returned. It all came back. My point is that, no matter it happening or the source, the world ( the universe ) balances. More co2 increases foliage (detected by Nasa's MOTIS), more transpiration, more moisture in the air, more low clouds with higher albedo. You will find even more paths of balance if you turn your capable eye to the cycling of nature, meaning the inescapable balance of all cycles. It is physically impossible that the balance is not there, I assure you. I am happy to elaborate more if there is interest. Thanks and best, David
- Climate Confusion
peppers at 21:44 PM on 28 June, 2022Love the balance acknowledgements. I dont hear this much yet it covers all of nature. By nature I extend to include the universe. Balance to me is like gravity. It is everywhere and will drop the apple on your head for lunch or speed you to demise when you step off the ledge. Orbits, plantlife, rivers and mineral cycles; even the milky way is in a 350M year orbit around our galaxy group. Balance. Co2 is a close brother of oxygen, and even though we draw up old reserves of that goo, Ox too is captured in the limestone and will require storms and erosion to bring it back up. Ox is in a steady decline for a M years in another cycle. I am watching for Co2 to balance with the 20% increase in foliage (Nasa) since 2000, 5% each last couple years, and the evaporation and cooling and added clouds and albedo this brings. Until once again there is balance, as this author references. There are millions of cycles interacting and the only constant is change and a desire to balance, without regard to one species or intent (see apple and falling above). Earth balanced after the big one (which sequestered the co2 and ox in the calcium and carbon slew), back from 4k ppm co2. If we consider balance, then warmer and erosion and trusting gravity and balance could mean the bigger picture just has us hubristically interjecting ourselves in to something, well, that might be needed later. Involving ourselves in something, not past our understanding, but past our paygrade. Interjections we are too important to get understanding just from an apple or acknowledging we know truly little, and that we can and will fall when we go past the edge.
- Flying is worse for the climate than you think
Philippe Chantreau at 04:10 AM on 13 May, 2022The video takes a rather drastic shortcut when it comes NOx emissions. The overall long term effect of NOx at altitude is likely to be a net negative radiative forcing because of the shortening of the methane residence time. The effect of contrail clouds is more difficult to ascertain and is likely a small net positive. Of course, the CO2 emissions remain the main concern, but presenting NOx emissions as making flying even worse is misleading. The whole picture is more complex.
There is very large uncertainty as to the total net forcing and how it compares to the CO2 forcing alone. It is pretty much admitted, however, that the total net forcing is higher than the CO2 forcing alone.
NOx is much more of a concern for low altitude operations and air quality around airports. Unfortunately, a similar trade-off exists to that of diesel engines for cars and reducing NOx involves higher CO2 emissions.
The truth remains that aviation is the most bang for the buck that burning hydrocarbons can deliver. That is where energy density really hits the spot. Unlike many other applications, there is currently no viable, or even prospective, alternative technology that comes close to the performance obtained with ICEs for propelling aircrafts. This holds true for both turbines and reciprocating, the latter being surprisingly more efficient in that role than is ususally believed. If we are to give attention to low hanging fruits, aviation certainly is not one of them (no pun intended).
The only electric aircraft I know of that is currently well engaged in the certification process is ALICE. When ready, it will carry 8-10 passengers over 5 to 600 miles at speeds around 220 to 240 knots. That is the level of performance of a King-Air 200, without the ability to refuel and be ready for flight again in less than 30 min.
Biofuels produced with clean energy are the best bet for a future carbon neutral aviation. However, if all electricity production and terrestrial transportation could be carbon free, aviation would not be a much of a factor, as only these 2 dwarf aviation emissions.
- SkS Analogy 3 - The Greenhouse Effect is Like a Cloudy Night
Charlie_Brown at 09:16 AM on 30 March, 2022This is a very good discussion of radiant energy transfer. I have only a couple picky technical distinction quibbles with it. I do appreciate your providing a commonly observed example of radiant energy. Very similar to your example is the function of smudge pots in fruit orchards on cold, clear nights. It is not the heat of the smudge pots that keeps the fruit from freezing.
You say that since “the upper atmosphere is also much colder than the ground, so infrared energy absorbed high in the atmosphere is only weakly re-radiated back to the ground.” All energy that is absorbed high in the atmosphere will be re-radiated, half upwards and half downward. More importantly, as CO2 increases, a smaller amount of IR energy is radiated toward space. This is because more energy that would otherwise escape directly is absorbed and half of it gets re-radiated downward. Without greenhouse gases (GHG), the energy doesn’t get absorbed and all of it goes toward space. Thus the “trapping” occurs by not letting as much energy that exits toward space out the top of the energy system.
Clouds don’t store (accumulate) energy unless the cloud is getting warmer. Cloud droplets either reflect radiant energy or absorb and re-radiate it back toward the Earth. Also, greenhouse gases don’t absorb more radiation than they receive, other than any slight imbalance which is manifested as a temperature change. This brings the temperature of GHGs in equilibrium with the surrounding atmosphere. GHGs re-radiate energy of specific wavelengths back to the ground. As greenhouse gas concentrations increase, more energy is returned to the ground, warming it. To bring the system back into balance with a warmer ground, more IR is emitted by the ground and all wavelengths. Some of it will be at wavelengths that are transparent to IR and will escape to space. All of this is observable using an atmospheric radiation model. The key is the energy balance. Be mindful of the understanding of stored or accumulated energy.
Forgive me for dwelling on esoteric distinctions. I appreciate the opportunity to practice writing about them. I hope that trying to understand them could prompt others to think about them also. - SkS Analogy 3 - The Greenhouse Effect is Like a Cloudy Night
Haiburton42 at 19:34 PM on 27 March, 2022I wrote this in my climate change dream journal at 12:24 am Ogden Utah Time. Light pollution makes it hard to see the stars and I thought the less stars the easier is to make a connect the dots picture — the clouds are the peaceful alternative — and I thought what about a sky polluted no stars shown through and I couldn't make a connect the dot picture that would be a very sad time for me. And a very sad world.
So, I think that when an entire town decides not to drive a car for a week in a row and the stars get brighter and we all go for a walk it can be a very good thing.
And now I'm promoting Take Back the Night brought to us by the Women's Center at WSU because ever since they helped me when I needed it I made a vow to take back the night whenever I can until we no longer have to.
But have I just been off-topic, political or ad hominem in my rhetoric?
- SkS Analogy 3 - The Greenhouse Effect is Like a Cloudy Night
nigelj at 12:09 PM on 27 March, 2022Its intriguing reading a thread of comments like this. Because reading them in their entirety its obvious dudo39 is just highjacking the thread to push an agenda. The article was obviously using clouds at night an an analogy only, and said quite clearly "Although the greenhouse effect is active 24/7, it is most apparent at night, " but dudo39 still rambles on @1 about the article not addressing clouds during the day and then the rest of the comments posted drift on from that, and the main issue gets forgotten.
- The Climate Shell Game
jan at 01:24 AM on 25 March, 2022@Evan #31
Many power utilities will certify that they use "green energy credits" to ensure the power used for cars comes from renewables.
People are often subject to tempting keywords. 100% certainty that your electrical outlet is currently supplying electricity from "green sources" is only if your house is off-grid + connected to your PVe/Wind/Hydro power production system. Otherwise, your distribution company supplies a mix of energy from sources that are currently providing this energy. Just to be sure.
Also, getting a lot of EV's on the road sends the right signal to the company's making them and to the company's powering them. Hard to know where to start, but I think we need to just jump in and get things going whereever we can.
Shouldn't this discussion be scientific? This is just a chaotic shooting into a dark approach. No hypothesis verification.
I think they call this the chicken or the egg problem. :-)
For common people - yes.
If you want to run a stable distribution grid you need:
- the stable source of energy production for 24/7/365 operation (any time, any weather conditions). Today they are - Nuclear, Coal, Natural gas, Hydro (dams). You can't control the sun (irradiation, clouds) or wind (atmospheric pressure).
- for unstable energy sources you need storage with sufficient capacity. More unstable weather, more capacity for the storage.
- all the sources must be able to deliver power quality conditions (Variation in voltage magnitude, frequency, transient voltages and currents, harmonic content for AC)
- solve challenging demands for the transmission losses. More warm conditions = more losses = need more energy production. Note: I have done a study in Slovakia power grid how weather conditions have a heavy impact on the transmission losses (in period 1964-2019). And I can responsibly say that this is a very modern power grid vs UK or US.
So, we have heavy challenges:
- transform existing energy production from the fossil fuels, including YoY increment of energy production
- upgrade the obsolete power grids to keep existing power demand
- in parallel create new energy production capacities for new electric charging points (EVs, trucks, busses, ...). You can't build up these points anywhere.
- create new power grids for the new energy sources, including new transition stations, ...
- and keep it all orchestrated to achieve a sustained power supply. This is really tricky now (see below)
- and in Europe, we have an additional heavy variable - to cut off from Russia natural gas - one of the important resources for Europe power production and power grid sustainability.
Finally yes - it is about chicken or the egg:
- you can't decrease emissions with EVs charged from Coal, Oil or Natural gas power plant energy sources.
- stabilize the obsolete power grid or new demand in the existing obsolete grid.
It's similar to enjoying a healthy diet that you're preparing on a coal fire stove.
Power production needs an order. No chaotic solutions.
Some useful information:
- Jan/2021 - Europe was near heavy Blackout due to power supply failure that is suspected to have originated in Romania disrupted the Continental Europe Synchronous Area. Its frequency dropped to 48.75 Hz (target frequency 50Hz), which caused the South-East area to be separated from the rest of the grid. This disruption and a lack of operating reserves in France nearly caused a Europe-wide blackout. Luckily, the automatic activation of power stations throughout Europe and the automatic initiation of contracted load shedding in Italy (1000 MW) and France (1300 MW) kept the grid stable and prevented a blackout. This incident shows the fragility of the grid and the real possibility of a Europe-wide blackout, which we need to prevent.link
- IPCC AR6 - The latest IPCC report suggests that average wind speeds over Europe will reduce by 8%-10% as a result of climate change.
- UK’s renewables share drops to 35.9% in Q3 2021 on slow winds
- Spain's solar energy crisis: Thousands os Spaniards bankrupt after investing in solar panels
- 2022 SkS Weekly Climate Change & Global Warming News Roundup #7
MA Rodger at 22:43 PM on 27 February, 2022Santalives @28,
You now present a third pile of nonsense here at SkS. At least you show a level of consistency. Coe et al (2021) 'The Impact of CO2, H2O and Other “Greenhouse Gases” on Equilibrium Earth Temperatures' is as ridiculous as the other two you presented.
Coe et al (2012) claims that it addresses the issue of Equilibrium Climate Sensitivity (ECS) which, as is well known, has not been well-nailed-down by science for four decades now. So it would be quite a feat if there was even a smidgeon of promise in this paper to some contribution to the asssessment of ECS.
I could set out why this is an entirely non-scientific paper that well deserves its place in the trash can but in your ignorance you would likely see this as "one side" being disrespectful to "the other side".
So instead let me address what these numpties Coe, Fabinski & Wiegleb are doing that is so badly wrong.
The crux of the ignorance presented within Coe et al (2012) begins to congeal in their Section 1.4. Here they derive entirely on their own** a value called “n” the “energy retention factor” given "a" the "atmospheric absorptivity" (or the proportion of surface radiation gets to space through a clear atmosphere. By using HITRAN to derive "a" (the calculated percentage of surface radiation that reaches space through that clear atmosphere), they derive "n" by balancing "a" against the radiation that has to reach space to balance the incoming solar warming.
(**Note the one citation presented by the numpties for this grand work, Wilson & Gea-Banacloche [2012], is a total misrepresentation.)
The process they use runs as follows.
If a black body of 288K (representing the surface temperature) was in equilibrium with today's absorbed solar energy which equates to a 255K black body, they calculate that the energy out into space would be just 61.5% of the 288K black body radiation.
Thus, they derive for today's atmosphere (with a=a0) n.a0 = 38.5% of the surface radiation will be absorbed by the atmosphere. However, they also calculate using the grown-up HITRAN database, that the transmission through today's clear atmosphere of such 288K black body radiation would be a0 = 73.0% allowing them to derive in their Section 2.7 a value for "n"; n = 52.7%.
And this incredibly simplistic method allows all the sceintific effort over the last four decades attempting to derive accurate ECS values to be sidestepped. Even the complex impact of clouds on this finding is sweetly side-stepped because, as they tell us in their Section 5.1, clouds are already accounted for in the derivation of "n".
And all this is their own work. No supporting evidence. What clever numpties are these Coe, Fabinski & Wiegleb.
Of course, there are feedback mechanisms to be negotiated and the numpties calculate (using simplistic assumptins) feedback values for water vapour (+18%) and the wavelength change in the radiation from a warmer world (-5%) with a net result feedback of (1.18 x 0.95 =) +12%.
They then calculate the impact of differing levels of CO2 GHGs on the absorption of surface radiation through a clear atmosphere to calculate direct warming from a doubling of CO2 (400ppm to 800ppm) of +0.45ºC (when the science is irrefutably sure the value is +1.0ºC) and thus with a feedback of +12%, they can derive ECS = +0.5ºC (when the science says +1.5ºC to +4.5ºC).
Of course, the GH-effect doesn't work in anything like the manner assumed by Coe et al (2012) so all these numpties Coe, Fabinski & Wiegleb are doing is advertising their own stupidity.
- It's albedo
blaisct at 09:33 AM on 25 February, 2022I don't know what went wrong but I tested these; Online psychrometric chart and Tutorial
Please except my assumption and online calculator results in the summary of the three conditions, they are only examples.
Doing some further research on the clouds I found this site Cloud Ceiling Calc that had a correlation used by airplane pilots to predict cloud celling.
Cloud ceiling (m) = (ground temp. – ground dew point)/2.6 *1000*0.3084
The base case is virgin land with lots of trees and vegetation, and is simulated by adding water to the online psychrometric chart calculator. The water added (22% of total water) is typical of data for rain forest type land.
I have added the cloud ceiling calculation to the summary to show that the LHAC cases increase the cloud ceiling no matter what the albedo is. The high albedo case is 20% higher albedo than the base case and much greater than your chart on W/m^2 vs time. The emphasis of the LHAC theory is that cities and cropland do not put as much water into the atmosphere as the orginal virgin land and this lack of water can reduce the cloud cover.
Summary of these cases:
Base case: 29.2’C and 70% RH with 23.3 dew point calculating 701 m ceiling
Low albedo: 33.4’C and 47% RH with 21.4 dew point calculating 1543 m ceiling
High albedo: 31.5’C and 55.5% RH with 21.4 dew point calculating 1171 m ceiling
Cloud ceiling and cloud cover should have a correlation.
- It's albedo
blaisct at 03:36 AM on 22 February, 2022Rodger @122
Yes, your translation of the LHAC theory is correct. Sorry for the whole apple, it was the only way to answer your question. One point of clarification. The production (flux over time) of hot low humidity air (through the day when the sun is shining) will occur no matter what the albedo of the UHI or cultivated land is, so the change in albedo is not that significant but the change in moisture availability is. The albedo affects how hot, water availability affects how low the RH, and area affects how much is produced over time. The Amazonia study showed this. The psychometric chart in @106 shows the math. In the LHAC theory, hot low RH air has always been a part of weather. Over time, man has changed how hot, how low the RH and how much is produced with UHI’s and new cultivated land. The generation of hot low RH air deals with W-hr/m^3 not W/m^2 and destruction of clouds should be on the same W-hr/m^3 basis.
Correction in @121
At bottom of @121 should read: we get -1.6W/m^2 change in incoming SW [ 342W/m^2*0.8% cloud cover change*(85% *(1-0.05)+(1-85%)*(1-0.15) – (1- 0.31 earth’s albedo)*(1-50% cloud albedo))] - It's albedo
blaisct at 07:28 AM on 20 February, 2022MA Rodger @112
Before I answer your question on whether there is something other than AGW causing global warming. Let me clarify that I am not a skeptic on Anthropical Global Warming, AGW, I firmly believe that man’s activities are causing AGW. The paper Dubal & Vahrenholt expressed doubt that the 20 years of CERES data showed significant evidence of GHG caused AGW and that clouds were the significant factor. How is cloud cover related to AGW? The Skeptical web site seems to be committed to evaluating theories. Here is the answer to your question:
The data I have looked at (below) suggest that AGW is not cause by one thing but a series of interactive events starting with land albedo and ending with ocean/land albedo and relative humidity (not specific humidity) in the middle. You will see (below) that this cycle of events is a known cycle in weather and that man’s activities have interfered with the cycle to cause AGW. For lack of a better name, I will call the cycle of events the “Low Humidity Albedo Cycle”, LHAC. The LHAC cycle back in the 1700-1800 (with low man-made albedo change) was:
Event 1: Over land on sunny days the temperature rises and the relative humidity, RH, drops through the day no matter what the albedo of the land is. How much the RH drops depends on availability of water from liquid water evaporation or plant transpiration. If no water is added to this daily event the specific humidity, SH, will remain constant while the RH drops. With water available the RH does not drop as much and the SH increase. The energy fueling this event (sunny days) depends on the albedo and latitude of the land, the lower the albedo and the closer to the equator the stronger this event. Clouds greatly dampen this event.
Event 2: The air above this land is hot and dryer and it rises all day long, creating a plume of rising hot low humidity air. That plume of air moves with the prevailing winds usually to the east in a circling pattern due to the Corellas effect.
Event 3: This hot low RH air is hungry for water. If this air finds clouds it eats away at them until the air is saturated with water, this process cools the air and raises the SH and RH. If this hot low RH air does not find a cloud it can cool as the pressure drops at the higher altitudes or it can serve as a deterrent to cloud formation. In all cases it reaches saturation.
Event 4: With fewer clouds more sun can reach the earth and warm the land and oceans, this is the final albedo decrease event. This last albedo event is the strongest because the change in albedo in the greatest with no clouds in the way of direct sun light. The warmer oceans store some of this energy and evaporate more water - find cold air and make more clouds.
This natural LHAC cycle of event will remain stable if the albedo and moisture availability remain constant. Let’s take each event and look at its contribution to the total AGW since 1880:
Event 1: Since 1700-1880 man has made some small changes in land use albedo but a large change in the land area. Most of these albedo changes came along with a decrease in moisture availability. UHI’s are most noted, with albedo changes between 0 and 0.2 depending on what the city replaced. I don’t have a source for the average, I will assume 0.05 average albedo change. The urban area has increased to about 3% of the earth’s land mass for all cities. I have no trouble doubling that to 6% for all man-made structures, rural + urban, they all have lower albedos and generate heat. Go to any city at Climate data and you can find the daytime data for temperature vs RH, in the morning the RH is high and as the day progress the temperature rises and the RH drops sometimes to 40% RH or lower, this is a normal psychometric thermodynamic process. Figure 1 is an example of daily RH from Beijing and is typical of most cities (just focus on the day time).

Figure 1
The change in albedo flux of all the earth’s cities is estimated at 0.08W/m^2 (assuming 177W/m^2 sun to the city, 50% cloud cover, 0.05 albedo change, 3% of land mass cities). Even if we make larger assumptions, we still can’t get to the 2.2W/m^2 we are looking for to account for all the AGW since 1880 or the 1.3 W/m^2 in Dubal & Vahrenholt . These cities can have daily temperature rise of up to 8’C. A large part of this temperature rise is due to the psychometric rise, PR, in temperature while the RH drops at a constant energy input (albedo). Looking at temperature anomalies, SH, and RH all plotted together vs time, Figure 2, we see they are all correlated (Temp and SH positively, and Temp and RH negatively).

Figure 2
If PR were not occurring on a global basis the RH and SH would both have a positive slope. Using the psychometric chart in @106 we can get the average temperature rise per % RH of -0.15 ‘C/%RH. The slope of the RH data in (2) is 0.16%RH/decade, for the 40 years of the chart this is 0.6% change in RH, giving a PR temp rise of 0.1’C for the 40 years vs the 0.7’C observed, small but not insignificant. This hot low RH air has no W/m^2 flux as it leaves the UHI; but, the hot low RH air has potential energy gain in getting saturated with water. Let’s add the crop/pasture land albedo changes to the UHI's. Globally the change since 1880 from virgin land to crop/pasture was about 6% with little change in albedo (Global albedo change); but, with low moisture change. The most notable of these changes was the deforestation of the Amazonian rain forest to make crop and pasture land Amazonia report (and @106). Amazonia report showed that in despite of an increase in albedo from rain forest to crop/pasture the temperature increased, the RH deceased, the cloud cover decreased, and the rain decreased. Classic example of psychometric temperature and RH behavior. Most likely all of this global 6% increase in crop/pasture land is producing hot low RH air just like the UHI’s. Combining the UHI and crop/pasture land changes we get 9% of the earth’s land mass producing more hot low RH air than 1880.
Event 2: This hot low relative humidity air rises and goes downwind from the UHI or changed crop/pasture land. The picture from (6) shows the extent of the UHI plume from Chicago, Il.

Figure 3
This is a computer model tuned with real data and calculates the extent of the plume to be 2 to 4 time the area of the UHI. The model also predicts the shape of the plume, rising to where some clouds could be. Using 3 times as the average extent of the plume we now get 27% of the land mass (7.8% of the earth) being affected by plumes like the one in Figure 3.
Event 3: Cloud destruction/prevention is the closest target for the hot low RH plume; but, if clouds are not available the lower pressure will saturate it or it will mix with cooler air. When this plume of hot low RH air increases its RH to 80% it is no longer is a threat to clouds or cloud prevention. Clouds and RH observations are that almost no clouds can form below 60% RH and significant reductions will occur below 80% RH.

Figure 4
Data shown in the figure 4 shows a 41%/decade decrease in clouds over 40 years. Dubal & Vahrenholt Figure 9 show about 0.57%/decade decrease, this data can be correlated to Figure 2 RH data and get 2.7% change in cloudiness/change in RH (R^2 =0.63). Not the best correlation but shows there is a relationship.
Event 4: The reduce cloud cover exposes more land and ocean to the sun. This land and ocean are located in the middle 75% of the earth where the cloud cover is about 50% vs about 60% for the whole earth, also assuming albedo of clouds is 50%. The sun’s flux to this exposed area is the cloud free flux of 342 W/m^2 (1367/4). Dubal & Vahrenholt suggest this energy is split 85% over ocean (0.05 albedo) and remainder over land (0.15 albedo). Using 40%/decade cloud cover for 2 decades of CERES data we get -1.6W/m^2 change in incoming SW [ 342W/m^2*0.8% cloud cover change*(85% *(1-0.05)+(1-80%)*(1-0.15))]. A little greater than the -1.3 W/m^2 observed; but close enough to show that the LHAC theory is plausible. - It's albedo
nobodysknowledge at 21:28 PM on 12 February, 2022Thank you for your presentation of the Dübal and Vahrenholt 2021-paper blaisct. I think there is a good overall agreement to the CERES data presented by Loeb et al 2021. I have commented this at Science of Doom.
The Dübal and Vahrenholt paper, Radiative Energy Flux Variation from 2001–2020, have got some attention. And for good reason. It is an important discussion. But there are some problems with some of the claims that are made.
«Radiative energy flux data, downloaded from CERES, are evaluated with respect to their variations from 2001 to 2020. We found the declining outgoing shortwave radiation to be the most important contributor for a positive TOA (top of the atmosphere) net flux of 0.8 W/m2 in this time frame.»
According to the CERES data they present (TOA all sky), the trend is LW out 0,28 W/m2/decade (cooling), SW out -0,70 (warming), and solar reduction 0,03 (cooling), wich gives a TOA warming trend of 0,39 W/m2/dec. So far so good. And in good agreement with Loeb et al 2021. EBAF Trends (03/2000-02/2021) 0.37 + 0.15 Wm-2 per decade.
«The declining TOA SW (out) is the major heating cause (+1.42 W/m2 from 2001 to 2020).»
Trend SW out all sky -0,70 W/m2/dec withsolar reduction included (0,70 W/m2/dec TOA warming). Gives 1,40 W/m2 over 20 years. This major heating is composed of SW clear sky heating trend of -0,37 W/m2/dec and a SW cloudy sky heating trend of -0,78 W/m2/dec. In the TOA radiation energy bridge-chart (figure 14) this is shown as SW clear sky increase of 0,15 W/m2 and SW cloudy areas increase of 1,27 W/m2. And the solar change impact is -0,17 W/m2 for 20 years. A great difference between trend and energy bridge-chart.
Loeb et al has a SW TOA heating of 0,63W/m2/dec through albedo change, with clouds increasing absorbed SW Flux 0,44W/m2/dec and surface increased absorption 0,19W/m2/dec. In good agreement with Dübal and Vahrenholt. EBAF Trends (03/2000-02/2021) 0.68 + 0.12 Wm-2 per decade.
«It is almost compensated by the growing chilling TOA LW (out) (−1.1 W/m2).»
But as we have seen, the trend is only 0,28 W/m2/dec. This is composed of LW TOA flux clear sky 0,04W/m2/dec and LW cloudy sky 0,35 W/m2/dec. How can they claim so big «chilling» longwave cooling? It looks like they use the startpoint and endpoint of a graph, and that the «chilling» cooling at TOA was for the year 2020 relative to 2001. In the TOA radiation energy bridge-chart (figure 14) this is shown as LW clear sky increase of 0,46 W/m2 and LW cloudy areas increase of 0,64 W/m2. I think what is presented in the bridge-charts is close to cherrypicking.
Loeb et al EBAF Trends (03/2000-02/2021) -0.31 + 0.12 Wm-2 per decade
The Dübal and Vahrenholt calculations for cloudy areas are clearly showing how thinning of clouds is the greatest component of global warming for the last 20 years, and probably for 40 years when we read the papers of M Wild and other cloud scientists. So when some say that the AGW is the cause of all global brightening or of all increase in water vapor, they are not taking the attribution problem serious. Increasing surface and atmospheric temperatures is contributing a lot, but there is a great complexity behind all this.
- It's albedo
MA Rodger at 23:36 PM on 10 February, 2022blaisct @115,
And concerning your second question - "If all the global warming, GW, came from CO2 radiative forcing alone would not a graph like @111 be flatter...?"
The 'graph @111' is Fig 3 of Dübal & Vahrenholt (2021) and specifically shows a quite-dramatic reduction in albedo 2001-20 with a trend of -0.70Wm^-2/decade. Fig 1 shows a reduction in solar of -0.03Wm^-2/d. Thus Figs 1 & 3 matches Loeb et al (2021) Fig 2d with Absorbed Solar 2002-20 given as +0.67Wm^-2/d. Loeb et al Fig 2d also presents an attribution of this increased absorbed solar warming 2002-20, ☻ 60% cloud albedo, ☻ 7% water vapour, ☻ 4% GHGs, ☻ 26% surface albedo, ☻ 3% aerosol. And note also that Loeb et al Fig 2a shows this 'quite-dramatic' effect occurs almost totally 2013-20.
To explain this attribution; if 4%+7% of this increase-in-Absorbed Solar (decrease-in-albedo) is attributed to GHGs, this means additional GHGs+water-vapour is directly preventing solar being otherwise reflected away and instead directly absorbed by the increased GHG+water-vapour. The underlying cause for the water vapour increase is of course AGW.
Your question implies that you consider there is something other than AGW and increased CO2 driving a significant part of this increase-in-Absorbed Solar (decrease-in-albedo) 2002-20. I don't think I could agree.
Loeb et al does identify the geography of the various components of the net EEI, mapping them out in Fig 3 and pointing to the Surface effect being "greatest in areas of snow and sea-ice, where significant declines in coverage have been observed in recent decades." It is, of course, easy to see that the ice-loss is due to AGW.
And for the biggest component, Cloud, Loeb et al says "Regional trends in net radiation attributable to changes in clouds are strongly positive along the east Pacific Ocean, while more modest positive trends occur off of the U.S. east coast and over the Indian, Southern, and central equatorial Pacific Oceans." Is this the finger print of AGW? If it isn't, it would require an alternative causation.
If AGW is the cause, note that the increase-in-Absorbed Solar (decrease-in-albedo) 2002-20 is mainly occuring 2013-20 which matches the global temperature record showing 70% of the 2002-20 warming occurred in the period 2013-20.
So without further explanation, I see no reason to expect a "flatter" slope from CO2-forcing alone, the slope being presumably all down to AGW.
- From the eMail Bag: the Beer-Lambert Law and CO2 Concentrations
Bob Loblaw at 01:57 AM on 28 December, 2021Charlie Brown:
Yes, your discussion touches on some of “the complexity of radiation transfer in the atmosphere” that I dismissed in a single paragraph at the end of the blog post. The blog post was only intended as a counter to the “CO2 exists in small concentrations” misinterpretation of the Beer-Lambert law, and leaves a whole host of other fundamental principles in atmospheric radiation transfer to the imagination of the reader.
You refer to several issues that deserve more discussion – issues that take entire university courses or textbooks to cover. You mention at least four specifics I’d like to elaborate on:
- re-emission of IR radiation
- the three-dimensional aspect of the atmosphere
- the vertical structure of the atmosphere
- the concept of “saturation”
With regard to re-emission, the amount of IR radiation leaving the cylinder is the sum of what was transmitted through the cylinder plus the amount that was emitted within the cylinder (and manages to leave before being re-absorbed within the cylinder). With regard to the emitted IR:
- Any CO2 that absorbs energy will lose it by collision with other molecules, so chances are that it will be a different gas that is emitting, which means it might be at a different wavelength. Thus, to look at the whole situation we need to consider all the greenhouse gases in combination.
- The emissions of IR radiation will depend on the temperature of the gases within the cylinder, which will depend on the balance of all energy fluxes, not just radiation.
- Just as adding CO2 increases the absorbance within the cylinder, adding CO2 increases the overall emissivity within the cylinder, so more IR can be emitted at the same temperature.
- The emission of IR happens in all directions, as you state, which means that only half of the emitted radiation can be said to be continuing in the same direction as any IR radiation that entered the cylinder (figure 4).
You mention IR lost through the side walls of the cylinder. There is also IR gained through the side walls, coming from adjacent cylinders that are behaving the same way as the one in figure 4. If the adjacent cylinders are identical, then each cylinder will be gaining and losing identical IR radiation amounts through the sides, so the net effect is zero.
Can we say the same things about the IR transfers between cylinders in the vertical stack of cylinders (figure 4b)? No, and there is a very important reason why. The net effect between adjacent cylinders (side by side, or top over bottom) depends on the temperature within each. If the temperatures are equal, the net IR transfer effect will be zero – but if they are not equal, there will be a net transfer from the warmer one to the cooler one. In the horizontal direction, temperature gradients are very small, so it is reasonable to ignore that direction. Vertically ,however, we see strong temperature gradients – the environmental lapse rate averages 6.5 C°/km. So, the top cylinder tends to be colder than the bottom cylinder, and the net IR transfer is upward.
So, we get to think in terms of up/down fluxes of IR radiation, and need to consider the thermal stratification of the atmosphere, as you mention. The up/down aspect has a formal label: the two-stream approximation. The extension of the use of the Beer-Lambert Law to include the emissions of IR radiation and the net IR flux along a temperature gradient also has formal solutions, one of which is called Schwarzschild’s equation.
Of course, the vertical temperature structure of the atmosphere is not purely due to radiation, so we can’t model it purely using radiation theory. Weather and climate models need to include convection, etc. - anything that transfers energy.
We also can’t leave the 3-d atmosphere discussion without mentioning clouds. Although gases in the atmosphere have absorption/emission characteristics that are highly dependent on wavelength, clouds (either as liquid or solid/ice) are essentially black bodies. In the same way that the two-stream approximation treats radiation transfer as either up or down, we can begin to cover cloud effects by dividing the atmosphere into a clear sky portion and a cloudy portion. Clouds have layers, too, and three-dimensional characteristics of clouds become quite complex, but the clear/cloudy categorization is place to start.
Lastly, you discuss saturation. I tend to dislike the use of that term, because it seems to mean so many different things to different people. One of the issues not mentioned in the blog post is pressure broadening, where overall increases in atmospheric pressure reduce the absorbance coefficient of the greenhouse gases such as CO2. This leads to a “law of diminishing returns” as CO2 concentrations increase, but we are far from running out of space on that one.
You use “saturation” in the context of IR radiation leaving the surface and escaping to space – and point out that nearly all the IR escaping to space is lost from the upper atmosphere. This is correct, and one way of looking at this is to ask “how many times will IR emitted from the surface be absorbed and re-emitted before the energy reaches the upper atmosphere and can finally be lost to space?” Even now, the probability that surface-emitted IR escapes directly to space is very small – but if adding CO2 increases the number of absorb/re-emit cycles from two to four, to eight to sixteen, etc., there is a reduction in the efficiency of transfer of energy from the surface to space.
For each absorb/emit cycle, only half gets emitted upwards. The half that emits downwards must go through at least one more absorb/emit cycle to get moving upwards again – and it only has a 50% chance that the next absorb/emit cycle will get it going in that direction. If it emits downward again, then it needs another absorb/emit cycle – with only a 50% chance again that it will emit in the upward direction. Adding more and more CO2 will always increase the number of absorb/emit cycles involved, but there is a law of diminishing returns here, too, which leads to the closing paragraph of yours where doubling CO2 from 200 to 400, or 400 to 800 ppm will have the same warming effect. Remember that convection is involved in that warming response, too – as radiation transfer becomes less efficient, convection takes a more dominant role (and it is already important).
- It's albedo
blaisct at 05:08 AM on 15 December, 2021Once again thanks for your comment (MA Rodger and the editor) and the additional papers on the subject. I will try to do better with the links.
The earlier data I was referring to was earthshine 10 years and CERES 10 years which showed that the data for the earths albedo was very noisy and flat. The flat part was what was expected for anthropogenic greenhouse gas , AGH, global warming. My initial understanding of AGH radiative forcing was that AGHs absorbed radiation (got hot) and that the higher the AGH concentration (at constant radiation) the more heat it could hold back thus the temperature would increase but the energy in vs out of the zone where this occurred would be the same (albedo would be flat). My understanding has been expanded to include: AGHs hotter temperature will reduce humidity and thus reduce cloud cover, expose more earth surface to the sun thus reduce earths albedo; therefor, albedo vs time for AGHs may not be flat.
The new (new to me) data I sited Earthshine 20 years showed a decrease albedo from both earthshine and CERES data – my only interest is this report was the agreement with earthshine an CERES data. The editor’s link CERES 20 years 1 and another link CERES 20 years 2 provided a lot more CERES data with different analyses. These three papers are the first time I have seen data showing a decrease in albedo (increase in TOA radiation) vs time. If all climate change was due to AGHs this graph would be flat. Using the CERES 20 years 2 graph for TOA radiation out. (of the three links I chose this one because it has the In Situ data (earth surface temperature)) one can see the good correlation between In Situ data and CERES data

Figure 1
“Comparison of overlapping one-year estimates at 6-month intervals of net top-of-the-atmosphere annual energy flux from the Clouds and the Earth's Radiant Energy System Energy Balanced and Filled Ed4.1 product (solid red line) and an in situ observational estimate of uptake of energy by Earth climate system (solid blue line). Dashed lines correspond to least squares linear regression fits to the data.”
. If there was any AGH global warming mixed In with the TOA (red) data it would have a slope lower than the In Situ data. The report CERES 20 years 1 did look for the AGH flat line signal and found it in the “Clear Sky” LW (long wave) data but nowhere else (1 of four graphs).
Two of these reports put a lot of emphasis on clouds decrease (new to me). (Decrease in cloud cover increased surface exposure to suns radiation and heats the earth more.) The report CERES 20 years 2 also found correlation to Water vapor, trace gases, surface albedo, as well as clouds. Both of these reports express doubts on the current understanding of climate change and make recommendation to further understand what is causing cloud cover to change.
While this new data is interesting and worth following up on it is still very noisy (low R^2) and another 20 years would be better.
I recognize that AGH global warming would promote other forcing including reduce clouds, reduced ice, reduced snow cover all exposing more surface to direct rays of the sun. Other man-made albedo changes can do the same thing. Here are two examples that may relate to the new papers.
Let’s start with the “heat island effect”, UHI. While the global warming from UHI’s lower albedo is small it does have observable effect on cloud formation, CERES 20 years 2.

“Figure 3
Attribution of Clouds and the Earth's Radiant Energy System net top-of-atmosphere flux trends for 2002/09–2020/03. Shown are trends due to changes in (a) clouds, (b) surface, (c) temperature, (d) combined contributions from trace gases and solar irradiance (labeled as “Other”), (e) water vapor, and (f) aerosols. Positive trends correspond to heat gain and negative to loss. Stippled areas fall outside the 5%–95% confidence interval. Numbers in parentheses correspond to global trends and 5%–95% confidence intervals in W m−2 decade−1.”
When air rises from a UHI it is hotter than the incoming air without a source of moisture to saturate it; so, it leaves as dryer air. This air generally rises and moves to the east. Look at figure 3 (a) and see the lower cloud formation change off the coast of east USA, Tokyo, and downwind Europe. With time (1880-2021) the UHI does not get hotter but it gets bigger thus the volume of low moisture air gets bigger. I am not going to argue the significances of the albedo part of UHI other than to recognize it is lower than 1 W/m^2 but not zero. What UHI is not given credit for is what happens downwind to this hotter low humidity air. Does it cool the ocean, reduce the snow line, melt ice, or reduce the cloud cover down wind, since this hot dry air should rise the clouds should be the first target. I can also see a chain of events: Hot low moisture air (from AGHs, UHIs, or other land changes) rises and go downwind, reduces cloud cover, over water the sun heats the ocean, the hotter ocean currents circulate to the poles, and melt some ice.
I’ll leave the quantification of this observable (figure 3 (a)) new (to me) correlation to others. A new UHI contribution to GW will be the albedo effect + the lower cloud effect + any other.
Second, is land use changes such as forest to crop or pasture land or grass land to crop land. Albedo decrease in grass land to crop land change is documented in Grass to Crops. Forest to crop land change increase in albedo is documented in Forest to Crops. Over 205 years the paper Global albedo study calculates that all the pluses and minuses add up to little change in albedo from land use changes. It is assumed (by me) that decreased albedo of a parcel of land means an increase in temperature and vs/vs. The study Amazonia Forest to Crops shows that increasing albedo does not always mean cooler temps. This report shows that when rain forest was replaced with crop land that the temperature increased, the rain decreased, and the cloud cover decreased. The Figure 3 (e) above shows bright red spot for “water vapor” (I assume that is change to lower humidity) in Amazonia. This is not an uncommon effect from replacing forest with crop or pasture land. The report Forest study observes that forests vs crop/pasture conversion gets warmer as the conversion gets south of 35’N latitude.
This unintuitive (to me) observation that an increase in albedo does not always result in a decrease in temperature can be explained by moisture. The resulting temperature depends on a constant enthalpy (total heat in the air= gases + moisture). Enthalpy is usually determined by the albedo (higher albedo lower enthalpy vs/vs); therefore, land exposed to the same albedo (enthalpy) can have a wide range of temperatures depending on the moisture (relative humidity) of the albedo (enthalpy). This relationship has been captured in a psychrometric chart,
(Sorry for the poor quality of this chart)
Example of a rain forest conversion to crop land: Start out with a rain forest at 25’C (bottom scale) go straight up to 90% humidity curve; this is our hot humid rain forest. If we convert this rain forest to crop land with a higher albedo, we move to a lower enthalpy line (anyone will do). The constant enthalpy line run diagonal (upper left to lower right). If the moisture is maintained at 90% the temperature will drop as expected for the higher albedo. Following the same enthalpy line (same albedo) go to a lower humidity curve that may result (and does in Amazonia) and one will see the temperature will increase (even to above the starting rainforest temperature at very low humidity).
A concern is how NASA and the IPCC pair surface temperature data with relative humidity and albedo. The three all connected in enthalpy. A misunderstanding of climate change could occur if Amazonian (rain forest to crop land) high albedo, high temperature, lower humidity type data was included in correlations with Canadian (forest to crop land) lower albedo, cooler temperatures, high humidity, type data. Does anyone know if this has been looked at? The report CERES 20 years 1 has looked at ocean enthalpy correlations. I have not seen any land enthalpy data. - It's albedo
MA Rodger at 08:48 AM on 10 December, 2021blaisct @104,
The paper you obtain the Figure 3 from is Goode et al (2021), the latest in a series of papers (spawned by Flatte et al 1992) which have been trying to establish Earthshine measurements as a useful data source. There is a distinct lack of rigour within the work as well as a worrying denialistic flavour to it. The paper linked in the moderator Response @104, Dübal & Vahrenholt (2014) suffers from similar problems but does use the latest CERES data which Goode et al fails to use.
As for the cause of the reduced cloud cover identified within the CERES data, it is a known feedback from AGW. This Yale E360 article from 2020 explains. - It's the sun
cph at 21:57 PM on 11 November, 2021
Diagram showing the monthly fluctuations in total global cloud cover since July 1983. During the observation period, the total amount of clouds fluctuated from about 69 percent in 1987 to about 64 percent in 2000. The annual variation in cloud cover follows the annual variation in atmospheric water vapor content, which presumably reflects the asymmetrical distribution of land and ocean on planet Earth.
Within the still short period of satellite cloud cover observations, global cloud cover reached a maximum of about 69 percent in 1987 and a minimum of about 64 percent in 2000 (see diagram above), a decrease of about 5 percent. This decrease corresponds roughly to a net change in radiation of around 0.9 W / m2 within a period of only 13 years, which can be compared with the total net change estimated by the IPCC 2007 report from 1750 to 2006 of 1.6 W / m2 for all climate drivers including greenhouse gas emissions from fossil fuel burning(cooresponds to your mentioned 2,5-3W/m² in 2021). These observations leave little doubt that cloud cover variations can have a profound impact on global climate and meteorology on almost every time scale considered.
The total reflectance (albedo) of the planet earth is about 30 percent, which means that about 30 percent of the incident short-wave solar radiation is reflected back into space. If all the clouds were removed, the global albedo would drop to around 15 percent and the short-wave energy available to warm the planet's surface would increase from 239 W / m2 to 288 W / m2 (Hartmann 1994). However, long-wave radiation would also be affected, which emits 266 W / m2 into space compared to the current 234 W / m2 (Hartmann 1994). The net effect of removing all clouds would therefore still be an increase in net radiation of around 17 W / m2. So the global cloud cover has a significant overall cooling effect on the planet, although the net effect of high and low clouds is opposite.
HK: - "but also through its warming effect through its strong greenhouse effect, which is the most important of all positive (reinforcing) feedbacks on a global level."

According to the current status, the net radiation effect of clouds is -19W / m² (Wild 2019) and corresponds very well with + 0.9W / m² per 5% less cloud cover.
High levels of global cloud cover are associated with low global temperatures, demonstrating the cooling effect of clouds. A simple linear fit model suggests that a 1 percent increase in global cloud cover corresponds to a global temperature decrease of about 0.07 ° C.
- It's the sun
HK at 06:44 AM on 10 November, 2021My point in #1292 was that the 0.5 W/m2 of forcing from clouds and snow/ice is small compared to the overall net forcing over the last 150 years or so and that the albedo change brought up by you is at least partly a direct consequence of the warming, i.e., one of the positive feedbacks.
However, I will admit that clouds and humidity are complex and can be influenced by other factors in addition to the direct result of man-made greenhouse gases. Desertification and deforestation in general and especially cutting down tropical rainforests can have a profound impact on the local hydrological cycle, changing humidity, cloud cover, rainfall and run-off and thus have an impact on the local temperature as well. So yes, man-made climate change isn't only about the greenhouse effect and the warming caused by it, but it's definitely the most important part of it on a global scale.
It's also worth noting that even if the relative humidity seems to have decreased somewhat for the reasons explained here, the absolute or specific humidity has in fact increased, just as expected in a warming world.

Water has an impact on the temperature not only via its removal of latent heat through evaporation – which has a local cooling impact – but also through its warming impact via its strong greenhouse effect, which is the most important of all the positive (amplifying) feedbacks on a global scale. - It's the sun
cph at 22:01 PM on 9 November, 2021HK@1292 - "BTW, if clouds and snow/ice changed by themselves and not as a feedback to warming caused by GHGs, we wouldn't get a cooling stratosphere..."
--- I did not understand your last sentence. I am of the opinion that, for example, a changed cloud albedo cannot be explained by a rise in temperature alone. Changes and anomalies in global mean cloud cover can also be caused by fewer (sulfate) aerosols or expanding deserts (dry regions become drier).
https://www.carbonbrief.org/satellite-data-reveals-impact-of-warming-on-global-water-cycle

Evaporation increases by + 2.3 mm / year, which is not fully compensated for by increased precipitation of + 1 mm / year. A decreasing runoff through the rivers of -1.01 mm / year and a falling groundwater level of -0.75 mm / year quantify the drainage of the continents. This drainage (through drained bogs, wetlands, groundwater, aquifers, canalization of rivers and a constantly growing sealing of urban areas) is just as man-made as the CO² emissions, rising temperatures and the resulting higher evaporation. Too little H²O in desert regions and the earth's atmosphere, which in summer extend through droughts up to the Arctic Circle, are a temperature driver. Too much CO² is just as warming as too little H²O. Less evapotranspiration -> less cloud albedo -> higher incoming radiation energy and record temperatures on the earth's surface -> even faster drying out with even higher temperatures - imho, similar to the ice-snow albedo, form a vicious circle.
The authors estimate a "statistically significant" increase in evapotranspiration of around 10% above the long-term mean (corresponds to a temperature increase over land areas of ~ + 1.44 ° C). During the same period, precipitation only increased by 3% and global river runoff decreased by 6%.
---
What is noticeable here is a simultaneous decrease in relative humidity and cloudiness, which certainly correlates with a general increase in the number of hours of sunshine.

")
- SkS Analogy 25 - Emissions vs Accumulation
cph at 08:33 AM on 9 November, 2021michael sweet@19 - "It appears that large scale irrigation lowers the temperature a little. This has been known for a long time..."
-— What you call a wild plan - I call it water cooling. It is much more efficient than air cooling and is generally described in climate science as the Bowen ratio. While it is ~ 0.1 over tropical oceans and rainforests, it reaches ~ 10 in deserts.
Decreasing surface BR plays a major role in the surface energy budget. It is estimated that the cloud feedback may increase albedo by 0.13 and reduce Rnet by 25 W m−2 in summer over agricultural land.
ms: - " The suggestion of piping enourmous volumes of water to the desert is absurd. / ...all available water is already used for irrigation and no additional water remains. "
-— I suggested a water transfer without pipeline ! Absurd - is to think that you only have to turn on the tap to get water. / Perhaps in the Central Valley people should start thinking about using the water retention measures I described above. - In principle a simple, worldwide request to politics, agriculture, industry but also to private persons to build up extensive water reserves wherever & whenever possible in order to use them generously in plant growth, evaporation, clouds and "water cooling" during periods of drought in spring and summer.
- It's the sun
HK at 01:05 AM on 7 November, 2021"Explained by the cloud and snow / ice albedo that has decreased in the last few decades (0,5W/m² which is a lot)."
The net forcing from the preindustrial period when counting both the positive forcing from the greenhouse gases and the negative forcing from man-made aerosols is now roughly 2.5–3 W/m².
Changes in clouds and the snow/ice albedo are positive feedbacks amplifying that warming. The most important and fastest of those is the water vapour feedback which roughly doubles the initial warming.
BTW, if clouds and snow/ice changed by themselves and not as a feedback to warming caused by GHGs, we wouldn't get a cooling stratosphere or more warming in winter than summer at high northern latitudes.
- SkS Analogy 25 - Emissions vs Accumulation
cph at 03:43 AM on 3 November, 2021MA Rodger@10 - "H2O is a vey lazy gas and requires the presence of long-lived GHGs to get it doing"
- I would have described H²O rather as a very lively & busy GHG, which absorbs almost all IR bands (by the way, even without the presence of other greenhouse gases), - has a very short residence time in the atmosphere and as a rapidly changing & travelling medium between water - water vapor - ice or snow, - distributes powerful energy and radiation potentials inside the atmosphere. More clouds and ice with certainty could help us - in our self-made hell.
Jim Eager@11 - " it can only act as a feedback, not as a driver or forcing."
- Yet the global warming potential (GWP) and radiative forcing of emitted water vapor have not been formally quantified. The fact that H2O is understood primarily as a feedback constituent does not mean these forcings cannot be quantified, and the relatively new concept of "effective radiative forcing" allows for this to be done.
MA Rodger: "I'm not at all happy... "
Jim Eager: "This is shear nonsenese perpetuated by strident vegans..."
Wikipedia awaits your suggestions for improvement. I don't feel like counting all the cow asses of this world - I'd rather eat them up.
- Can the economy afford NOT to fight climate change?
sfkeppler at 00:14 AM on 23 September, 2021Economy cannot afford NOT to fight climate change, that’s right! – But how can we effectively fight global warming, if the only alternative given is to reduce energy, the human’s economies vital input? At what extent economy can afford climate action without mutilation of survival?
Yes, we can! – It’s not necessary to stop energy consumption, when fighting global warming by boosting global water cycle. Everybody studying about the carbon impact and its sophisticated relation in the biosphere, with diagnostic results. Utopic thoughts about geo-engineering with unimaginable global impacts. Science should really put the feet on earth!
The global water cycle is the natural way to intervene against global warming! “GAIA”, the auto-regulating hyper-organism, asserts temperature by water circulation. And we should learn more about the different instruments we have to enhance or reduce the fluxes. We know that evapotranspiration in the tropics by solar radiation and direct warming distributes water in the southern and northern hemispheres. We also know that evaporating water cools surfaces and returns as refreshing water. Vapor at the equator produces convection and drafts up to higher regions, where we observe ice-clouds in the uppermost layers of the troposphere. These drift to the poles and bring snow to the higher latitudes by “scratching” the stratosphere with freezing temperatures of -50°C.
It might be quite easy to booster tropical evapotranspiration, by installing artificial evaporators at the eastern coast around the Equator-line. Look at Somalia, were the mangroves have been removed for firewood from our human ancestrals. At the horn of Africa, I am sure we make the Somalian desert disappear! - It's albedo
MA Rodger at 05:23 AM on 18 September, 2021The commenter @97 is no-longer a participant here but as this response to his comment @97 is albedo-stuff, I hope the moderators will allow it.
☻ Concerning the spectrum of reflected light in earthshine:- @97, the objection was to Woolf et al (2004) using an arbitrary ordinate scale on their Fig 1 (shown @96) rather than Wm^-2. Addressing this objection (although Woolf et al Fig 2 should have sufficed as it shows a roughly constant % albedo with wavelength), below is a graph of spectrum for wavelengths 0.25 to 6.5 microns (so into the UV) with a Wm^-2 ordinate scale. (Woolf et al above shows the spectrum 0.48 to 0.92 microns, so into the IR.)
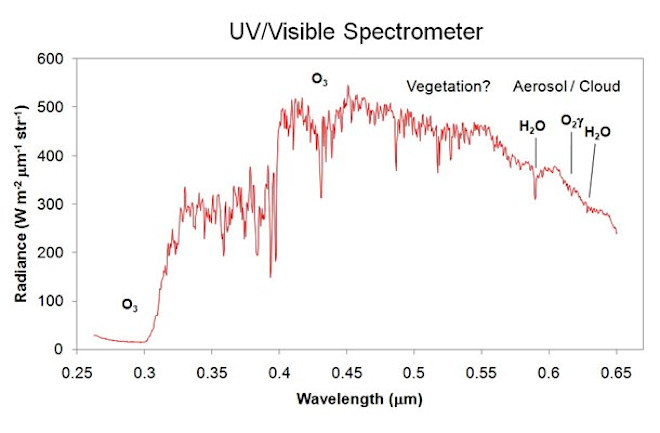
☻ Concerning Wild et al's -19Wm^-2 clear-sky radiation:- Indeed, as commented @97, it is "visa versa" @96 as "cooling" was written in error and should have been "warming" from clear-sky relative to all-sky.
Do note that the cooling from an AGW-induced decrease in albedo is greatly due to the reduction of tropical marine cloud. AR6 provides a better assessment of such cloud today that allows AR6 to state that "A net negative cloud feedback is very unlikely" with a potential range of -10Wm^-2ºC^-1 to +9.4Wm^-2ºC^-1 ['very likely' =1.67sd]. (Although half the range given in AR5, these remain broad confidence intervals.)
Yet the -19Wm^-2 result from Wild et al (2019) was not misunderstood. The value is saying that the net energy balance under clear skys is -19Wm^-2 relative to the global average. (Note a coincidental -19Wm^-2 is also given by Wild et al for Land relative to Global.)
It doesn't follow that a reduction of clear-sky conditions would result in a comenserate cooling of the planet (just as an increase in the land area of the planet would not be expected to increase planetary cooling). It is not so simple.
Note what Wild et al consider their finding would be useful for:- "To better constrain (global climate models from CMIP5), we established new clear-sky reference climatologies." There is no mention of geo-engineering. (And note that if it were, the net planetary cooling would be -19Wm^-2 for the extra cloud and a further -19Wm^-2 for the loss of clear sky - this assuming a 50% global cloud fraction.) However, the impact of altering the global level of clear-sky conditions would depend entirely on the particulars of the alteration.
Indeed, consider the cloud-effect in its totality. If the models take all the clouds out but keep everything the same, the GH-effect is diminished by about 15%. This would suggest increased cloud warms (and so does not cool,) a warming with a back-of-fag-packet global value of [33ºC GH-effect x 3.7Wm^-2/ºC x 15% =] +18Wm^-2. So +ve and not -ve. An interesting result.
☻ Finally, the mistake within the annotations of Fig3 of Pascolini-Campbell et al (2021) - It a trivial mistake (that the value of 2.3mm/yr in Fig3a should be 2.3mm/yr/yr and likewise elsewhere) as the mistake is quite evident. Simply look at the regression line. The graphed regression line rises from an anomaly of -18mm/yr in 2003.0 to +21mm/yr in 2020.0, so a rise of 39mm/yr over the 17-year period graphed = 2.3mm/yr/yr.
- It's albedo
coolmaster at 15:37 PM on 17 September, 2021@96
MA Rodger: you state that "albedo is ... depends primarily on the wavelength of the light that hits the body/molecule." This is not correct. The reflected light is pretty-much independent of wavelength being no more than "bluish". The spectrum of reflected light is thus not significantly different from the spectrum of sunlight.
coolmaster: I'm not sure if you know that e.g. plants are green (wavelength = ~ 550nm), a tomato red (~ 650nm) and blueberries (~ 450nm) blue when illuminated by sunlight with a full spectrum.
Illuminated by a full spectrum (white), the objects appear to your eyes & brain in more or less monochrome light. So - many of the incident wavelengths are absorbed and only single colors are reflected.
A snow surface is white and has a high albedo because all wavelengths are reflected in the range that is visible - nevertheless, snow absorbs very strongly in the long-wave range of IR radiation.
What you describe as "bluish" is the Raleigh scatter.
This has absolutely nothing to do with absorption, relative reflection and albedo.
Your posted graph shows the spectral properties of the light emanating from the earth - and not the energy content of sunlight, that matters in an energy balance.
Without having read the article - I guess you will hardly find the unit W / m², which is the important one for the radiation budget of the earth. So please don't mix it all up here. (MOD)
MA Rodger: The TOA radiation balance under clear sky conditions averaged globally by Wild (2019) shows 19Wm^-2 more cooling than his all-sky average.
coolmaster: No you are utterly wrong - it is vice versa.
Or do you feel yourself cooler in sun under clear sky - and feel heat when a cloud covers the sun ????
The radiation net effect of clouds and water vapor (CRE = -19W / m²) You still seem to confuse CRE with the atmospheric feedback of the clouds, which consists in the fact that with increasing temperature less cloud cover, changed lapse rate and optical depth are determined (+ 0.42Wm-2 ° C-1). Earth - is - loosing - the clouds !
MA Rodger: ☻ And to correct your bold assertions @94 / Your own derivation of a greatly different value of 344km^3/yr uses solely Fig 3a of the former paper which gives an annual rate of increase as 2.3mm/yr (it should actually be 2.3mm/yr/yr)???? and for the 16-year period the increase would be thus 5,500km^3/yr, in the circumstance not a significant difference from 7,000km^3/yr.
coolmaster: 1500km³/yr is more than I suggested to retain.
www.carbonbrief.org/satellite-data-reveals-impact-of-warming-on-global-water-cycle
Can you give us just a reference or a page in the www. quote where the unit mm / yr / yr is used ???? You should then definitely get in touch with Ms. Madeleine Pascolini-Campbell and explain to her that she was mistaken by a factor of ~20.
After all, her work and GRACE-FO are regarded worldwide as one of the most important findings of the last few years. So if you know better - go ahead ... Your pocket calculator with the built-in joker must have been very expensive.
- It's albedo
coolmaster at 23:46 PM on 13 September, 2021@GPWayne:
"We know the planet is warming, and that human agency is causing it. What we cannot say yet is how climate change is affecting albedo, how it might be affected in the future, and what contribution to climate change - positive or negative - it may make."
coolmaster: The albedo is relative ... and depends primarily on the wavelength of the light that hits the body/molecule. We should therefore always specify a wavelength range for the albedo. Otherwise, strictly speaking, the entire incoming spectrum of the sun ( UVC140nm up to Micro waves10cm) is decisive. This relativity to the albedo is particularly important for an element as widespread worldwide as H²O. I.e. ice and snow with an albedo of up to 0,9 in the visible range(380-780nm) has an albedo in the micro wave range of only < 0,1.
Albedo of the earth ist 0,3 because absorbtion is 0,7(0,5 on the surface + 0,2 in the atmosphere) --> so the atmosphere has an albedo. Higher concentrations of GHG specially CO² is lowering the albedo of the atmosphere and is thus increasing temperature. We could always increase the albedo elsewhere: clouds, white color in the outdoor area or lighter field crops through foliar fertilization with light clays are just a few of the many possibilities.
The temperature of the earth's surface is globally determined by the radiation balance, the radiation budget. This records the interaction between absorption and reflection as well as re-emission and scattering.
But no matter which albedo you are looking at, whether short or long wave - a higher albedo can never cause a rise in temperature or energy. Conversely, every falling albedo increases temperatures or energy on earth.
So I suggest that you update the last sentence of your basic rebuttal.
@Moderation response: "last warning"
In my last comment, which you would like to see in the slr section, the word albedo appears 3 times - the words clouds and cloud cover even more often. You should also warn others, who do exactly the same(i.e. MAR,BL).
The inseparable connection between albedo - clouds - water and SLR was invented by an immovable mover (Aristotle's definition of God) ! not me !
I don't want to discuss religion here, if only because I don't belong to any official religious community and because my religion is art. For me, climate science is a discipline, just like painting, sculpture, dance, music, and theater, etc.
Nevertheless, I noticed that there once was a man who said he wanted to save the world. Among other things, because he supposedly could move over the water ...
I also want to save the world ... and move (spiritually & physically) over the water.
If you don't like my holistic, alternative climate protection strategy, which lowers sea level rise and earth temperatures - I can't change it, but I can't understand it either. In my opiniont it is the very last opportunity for you, your readers, commentators, your descendants, and the rest of creation to escape from climate hell (as long as anybody presents a much better, faster or cheaper concept.)
That was my last warning to you...
- It's albedo
coolmaster at 10:47 AM on 13 September, 2021MA Rodger93:
MAR: "Your proposed grand scheme seems to be assuming atmospheric water can increase by 0.001335M km^3 annualy, or a 10% annual increase."
No - I never ever assumed, wrote or thought about that I plan or can increase atmospheric water by 1335km³ annualy.
You are making a very similar mistake as Prof. Stefan Rahmstorf from PIK in Potsdam in response to my comment in another climate forum.
Your mistake is probably that you have not read my posts with due attention, even though they are kept very simple and straightforward.
An increase in atmospheric water by 10% / year would mean that, according to the CCF, earth temperatures rise by approx. 1.4 ° C per year. A state of the climate which means certain death for all life on earth.
So you also completely misunderstood me.
My climate protection strategy would like to take the volume of 3.7mm SLR(1335km³) from the global rivers discharge when their water levels are sufficient(&clean) or even specially in flood events after rain- !!! to store it in soil moisture and groundwater over the land mass.
In principle a simple, seasonal storage of retained river water also to adapt to droughts and floods.
In dry seasons, this water will be mainly evaporated from agriculture, but also the before mentioned “amunas” of the old inca culture and their water management are a perfect way to rewet forests & moors.
hidraulicainca.com/lima/sistema-hidraulico-amunas/
This in turn ensures an increasing relative (and specific) humidity and additional cloud formation over land in a regional drought season.
After an average of ~8.5 days in the atmosphere it will return – even with a relatively high probability – as precipitation over another land area. There will be a multiplier effect that increase together with soil moisture and evaporation rate (wet regions become wetter).
As a result, the water cycle over the land areas is intensified by ~ 1-1,5% and thus the increasing size of the annual mean cloud cover over land areas leads to a higher albedo & CRE, which I estimate to be at least a cooling RF of ~ -0.2W/m² / year.
A really cooling, additional radiative forcing, which, in my opinion, can more than compensate for the current annual radiative forcing caused by CO² .
A holistic, functioning climate protection strategy,(stopping SLR AND global temperature rise & adaptation to droughts and floods) which works alternatively and independently of the reduction in CO² emissions, which only promises to stop the temperatures rise perhaps after ~ 2070 (if we as humanity can reduce emissions immediately – which I personally do not believe)
In the latest IPCC report / WG1 Chapter 7.4.2.4.3, the positive feedback of the cloud cover on an atmosphere warmer by 1 ° C is given with +0.42W m-2 ° C-1.
We are slowly but steadily losing not only areas of ice and snow albedo, but also the clouds albedo due to decreasing global mean cloud cover and higher lapse rate.
The cooling CRE with ~-19W m-2 (chapter 7.2.1. in the same report) should decrease accordingly.
The slower warming of the oceans means that there has not been enough moisture evaporated into – and then held in – the air above the oceans to keep pace with the rising temperatures over land. This means that the air is not as saturated as it was and – as the chart below shows – relative humidity has decreased, desertification is spreading rapidly mainly caused by human activities.
Dryness is a temperature driver and cloud killer.
That is why I (as an artist - not a climate scientist) think it's a good idea to create additional “artificial” clouds by additional artificial irrigation retained by river discharge from the superfluous water of the oceans.
---
MAR: but the reported 10% increase in evaporation rate 2003-19 over land equates to some 7,000km^3/y while the reported 3% increase in rainfall equates to 3,300km^3/y and the decrease in direct discharge from land to ocean a further 3,000km^3/y.
This suggests your grand scheme wouldn't make a ha'p'orth of difference. Evaporation over land is shown to have increased five-time the amount you propose yet AGW and SLR continued apace.
coolmaster: ???
360.57M km² ocean area * 3.7mm SLR = 1334.1km³ water = 8.93mm above the land area.
149.43M km² land area * 2.3L / m² increasing evaporation per year = 343.689km³ water.
* 1L / m² increasing precipitation per year = 149.43km³
* -1.01L decreasing runoff through the rivers per year = -150.92km³
* -0.75L decreasing groundwater level per year = -112.07km³
Your calculator probably has a built-in joker.
And if you are holding a PhD, you should hand it over (to me ?) as soon as possible. - It's albedo
Bob Loblaw at 02:34 AM on 12 September, 2021..and once again, coolmaster just links to a page and shows a graphic without explaining how it supports his Grand Theory.
OK. I"ll bite. On the web page at that link (which is broken - here is the correct one), we find this (emphasis added):
Another interesting relationship is that while the places with the most water vapor in any month are always among the cloudiest, it is not always true that the cloudiest places are among the most humid locations. The tropics are both very humid and very cloudy, but in many months, the Southern Ocean is among the cloudiest places on the planet, even though the amount of water vapor is relatively low. This pattern occurs because cloud formation depends on both water vapor and air temperatures. The colder the air, the more readily any water vapor in the air will condense into clouds.
Where is the part that says a 1% increase in evaporation will be guaranteed to lead to 1% more clouds?
Coolmaster probably does not even read the links or papers he posts. If he does read them, he clearly does not understand them.
Coolmaster has clearly crossed into basic trolling now.
- It's albedo
coolmaster at 01:45 AM on 12 September, 2021BL: @ 83-86
BL: - It is not directly applicable to cloud reactions to local changes in surface temperature (e.g. irrigation of land) or local changes in surface humidity (e.g. increased humidity over irrigated land).
- And coolmaster's claim that cloud cover changes in response to increased surface evaporation is basically a wave of the hand.
- He has not provided a single reference or figure to support the claim that increasing evaporation over part of the world can lead to a global increase in cloud cover
- unless he can substantiate his claim of local increase in evaporation leading to global changes in cloud cover. ..
- if you do not have to provide a reference for your claim that local surface evaporation leads to a 1% increase in cloud cover.
- Now let's look for evaporation data so that we can finally check the elusive story "1% increase in evaporation causes 1% increase in clouds". Hmmm. I'm looking hard but I don't see - I see "atmospheric water". Is that "evaporation"? I do not think so. I seem to remember that "evaporation" is flow from the surface into the atmosphere, not storage in the atmosphere.
Are we looking at a system where increased evaporation actually causes these cloud changes? I don't see any evidence of that.
- Maybe one day Coolmaster will give us the evidence we need, but I'm not going to hold my breath.
earthobservatory.nasa.gov/global-maps/MYDAL2_M_SKY_WV/MODAL2_M_CLD_FR

NASA water vapor vs. cloud fraction
IF you need a reference, that evaporation is the phase change from water ---> to water vapor - just (hopefully shorter) let me know.
BL: - You may find some clues about my background and why your Google search failed on the Skeptical Science Team page. - Congratulations. I see that you are very bussy & diligent with Prof. Dr. Martin Wild have worked together. I look forward to hopefully reading your funny future posts here in the forum soon. (Sincerely) MACIAS
@MA Rodger
Unfortunately, your graph says nothing about whether these amounts of water are taken from groundwater / aquifers or from river water or bank filtrate. I suppose you can see the difference for the SLR in that regard.
MAR: All we have to do now is sit back and watch global temperatures drop from year to year. And when we have time ...
NO - The water consumption of civilization and agriculture has increased steadily with the population growth.
Agriculture in particular, as the largest consumer, has already dangerously lowered and polluted the water table in many places. Consumption continues to rise and the switch to river and rainwater is actually inevitable.
In middle latitudes + 2 ° C, higher temperatures are also associated with ~ 10% higher evaporation. This is a huge problem for the arid regions that are becoming increasingly arid. Saving water wherever possible is certainly a challenge there today.
- It's albedo
Bob Loblaw at 11:49 AM on 11 September, 2021coolmaster @ 82:
Congratulations. Another comments policy violation. You can't find anything using Google? Maybe if you look at the Skeptical Science Team page, you will find some clues about my background and why your Google search failed.
It is amusing that you complain about a lack of links or references, when you still have yet to provide a reference for your claim that local surface evaporation will lead to a 1% increase in cloud cover. Just in case you have forgetten it, here is your original claim again:
This volume can be retained by a wide variety of measures before it flows into the oceans and converted into evaporation. - 9L / m² corresponds to ~ 1% of the average annual rainfall over land and should therefore create ~ 1% additional clouds over the land mass.
You repeat a diagram previously linked to. Let's us try to find the evidence we seek in that diagram.
- Cloud cover data? Yes, for three types (high, middle, and low).
- Clear annual cycles, especially for middle and low.
- Global total cloud cover? We don't see sums, but it is obvious that the low and middle cloud amounts are counter-cyclical... when one goes up, the other goes down. Less variation in high cloud. Could it be possible that these cloud types are responding differently to whatever the seasonal cycles are? Maybe there are changes in geographical distribution? Maybe differences between land and sea?
- Trends over time? Yes, And different trends for different cloud types.
Oh, there is that pesky cloud type issue again. Maybe it's actually important?
Now, let's look for evaporation data, so we can finally verify the elusive "1% increase in evaporation causes 1% increase in clouds" story.
Hmmm. I'm looking hard, but I don't see it.
- I see "atmospheric water". Is that "evaporation"? I don't think so. I seem to remember that "evaporation" is a flux from the surface to the atmosphere, not the storage in the atmophere.
- Are we looking at a system where increased evaporation is actually causing these cloud changes? I see no evidence of that.
- Oh, wait. Coolmaster has pointed out that this graph shows "...clouds feedback during the last decades triggered by a warming atmosphere..." My mistake - I thought you were trying to show data that supported your grand theory.
This is typical of what coolmaster has produced here: links to papers or diagrams, with no explanation as to how they are supposed to support his argument, leaving the reader to try to examine the paper or diagram in search of something only coolmaster sees. There is no "there" there.
You seem to like the IPCC reports. Since you appear to have a copy of AR6, I'll skip linking to it. Maybe it has something to say about your grand theory that irrigation can increase evaporation and cool the planet.
[search]
[search]
Oh, maybe this is it!
Section 7.3.4.1 Land use.
It mostly covers albedo changes for land, but the second last paragraph says: "The contribution of irrigation (mainly to low cloud amount) is assessed as –0.05 [–0.1 to 0.05] W m -2 for the historical period (Sherwood et al., 2018)."
Hmmm. With those error bars, it's hard to tell if the effect is positive or negative. It's also the total effect attributable to all the increases in irrigated land over the historical period. If the -0.05 number is correct, would there be a linear response to more irrigated land, so that 100x the historical area would lead to -5W/m2 and offset the CO2 forcing? How much water is used each year for current irrigated land?
That might give coolmaster a glimmer of hope. Why has he not presented this information before? Maybe the more detailed results in the reference the IPCC uses do not support coolmaster's grand theory? Maybe he just doesn't know what to look for?
Maybe coolmaster will eventually provide us with the evidence we need, but I won't hold my breath.
- It's albedo
Bob Loblaw at 11:33 AM on 11 September, 2021MA Rodger @ 81:
Yes, coolmaster's essential error is to take a comparison between mean global clear sky radiation numbers and mean global cloudy sky radiation numbers, and treat that as if all cloud is equal and the difference can be applied to any change in cloud cover he wants. He is also failing to distinguish between cloud feedback and radiative forcing. Clouds are the result of other factors, and how they respond to forcings such as increasing temperature due to CO2 rise (or surface evaporation) cannot be evaluated using the diagrams and numbers he presents.
The "cloud feedback" section of the IPCC is discussing feedback caused by increased (or decreased) global atmospheric temperature. It is not directly applicable to cloud response to local surface temperature changes (such as irrigating land), or local surface humidity changes (such as increased humidity over irrigated land).
And coolmaster's claim of cloud cover change in response to increased surface evaporation is basically hand-waving. His introduction of his glorious "theory" is done in comment #71:
This volume can be retained by a wide variety of measures before it flows into the oceans and converted into evaporation. - 9L / m² corresponds to ~ 1% of the average annual rainfall over land and should therefore create ~ 1% additional clouds over the land mass.
He has not presented a single reference or figure that supports the claim that increasing evaporation over a portion of the globe can produce a global increase in cloud cover - let alone any specific type of cloud. Radiative effects aside, unless he can substatiate his claim of local evaporation increases leading to global cloud cover changes, how you calculate the radiative effect of the cloud cover is irrelevant.
The energy/radiation flow diagrams can be done globally, split into land/sea, or split into clear/cloudy, but each is still a general average over a wide variety of conditions.
All land? What about forest vs. grassland vs desert vs. tundra? All different. Even "forest" is not a single class: tropical rain forest vs. temperate mixed-wood forest vs. temperature rain forest vs. boreal forest.
All have different cloud cover types, and treating them as equivalent is naive at best. Regardless of how accurate the diagrams that have been presented on this thread are, coolmaster has utterly failed at providing any sort of logical explanation or evidence that the local changes will lead to the global result he claims.
Nice catch on how coolmaster assumes that a constant level of irrigation/evaporation will lead to constantly increasing temperature effect (his -0.07 C/year).
- It's albedo
coolmaster at 02:18 AM on 11 September, 2021BL80:
BL: I know Dr. Wild. I've worked with him in the past.
My google can`t find anything. As long as you do not respond a link, it seems to be a silly lie.
BL: ...it condenses to form cloud, but this is not always the case.
BL: ...So will this "extra" moisture cause more clouds? Maybe. Maybe not.
same problem - no link - no references
BL: I have provided references to published science that shows not all clouds cause cooling when cloud amount increases. I see you have done absolutely nothing to refute the validity of those studies.
I provided this link last week:
https://www.climate4you.com/ClimateAndClouds.htm#Cloud%20data

You see clouds feedback during the last decades triggered by a warming atmosphere measured by satelittes. Do you really think your reference of 1960 is something new to me ?
You still confuse effect and feedback.
This is clouds radiative effect: IPCC AR6 CH. 7.2.1
Without clouds, 47W/m² less solar radiation is reflected back to space globally, while 28W/m² more thermal radiation is emitted to space. As a result, there is a ~20W/m² radiative imbalance at the TOA in the clear-sky energy budget suggesting that the Earth would warm substantially if there were no clouds.
BL: - Summer is only one of four seasons. - local is not global - so that that there
please provide a specific reference to a page number and quote. Otherwise, you are just throwing out...
-— thanks MOD that`s enough ---
- It's albedo
MA Rodger at 00:11 AM on 11 September, 2021Bob Loblaw @80,
While it will likely not assist commenter coolmaster, there is an apparent contradiction presented within the literature, a contradiction which coolmaster seems to ignore while taking a cavilier interpretation from just one side of it. So that contradiction should perhaps be explained.
♣ We have reasonably unambiguously statements from AR6 Section 7.2.4.3 'Synthesis for the net cloud feedback' (a section mentioned by coolmaster @79) which tells us Cloud Feedback is net positive unless there is "extremely large" negative contributions over certain ocean areas although there is yet "no current evidence" for such contributions.
The work supporting this conclusion includes Dressler (2013) whose Fig 5 shows (units Wm^-2):-

This finding thus contradicts the assertions of commenter coolmaster that Cloud Feedback would be net positive over land. (I will ignore the water vapour feedback which will certainly provide additional positive feedback if substantial additional evaporation occurs over land.)
♣ There is also AR6 Section 7.2.1 'Present-day Energy Budget' mentioned @79. This presents in Fig 7.2 an old friend from up thread, namely Fig 14 from Wild et al (2019).
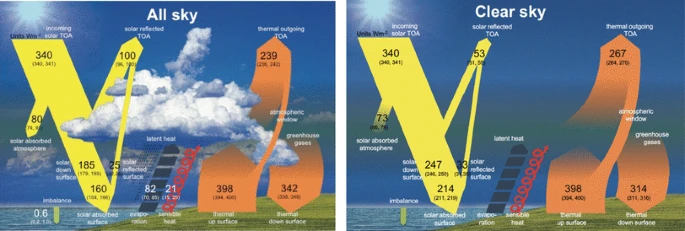
It is from this graphic that Wild et al derive the finding "The net (shortwave and longwave combined) cloud radiative effect at the TOA then results in an overall energy loss of − 19 Wm^−2," a finding echoed in AR6 section 7.2.1 'Present-day energy budget' - "As a result, there is a 20 Wm^-2 radiative imbalance at the TOA in the clear-sky energy budget (Figure 7.2 lower panel), suggesting that the Earth would warm substantially if there were no clouds."
This -19Wm^-2 is the value used by commenter coolmaster to suggest there would be a pro rata cooling due to an increase of cloud by 1% over land (although water vapour is not similarly accounted as increasing and also for some unexplained reason the cloud result is treated as being an accumulative annual cooling).
♣ These two references within AR6 appear contradictory. However, the 7.2.1 account does no more than "illustrate the overall effects that clouds exert on the energy fluxes." It simply shows that cloud effects are large while the actual Cloud Feedbacks are far more complex. Such feedbacks cannot be determined by simply comparing the average net radiation budget within areas of clear sky relative to an average for the entire planet.
So if more cloud were created, the type and location of that cloud will determine whether there is net global warming or cooling. And the sort of change in cloud resulting from additional AGW is seen to be warming. Uncertainty remains high for the size of AGW's cloud fedback, and that includes the rather jaw-dropping findings of Schneider et al (2019) and also in the CPIM6 models.
♣ I should perhaps end by making plain that for coolmaster's scheme of global cooling, this discussed 'contradiction issue' is a minor issue relative to some of its other problematic issues it generates.
- It's albedo
Bob Loblaw at 11:21 AM on 10 September, 2021Coolmaster:
Unfortunately, you have little more than a re-assertion of your previous points.
I know Dr. Wild. I've worked with him in the past. I have many years of experience in the measurment of radiation. The diagrams you have displayed are descriptive, and in no way represent a full analysis of the effects of cloud cover and global climate. I am completely confident that Dr. WIld would not consider them as evidence for the claims you are making. There is nothing wrong with what is in the diagrams - it's is what is not included.
I have provided references to published science that shows not all clouds cause cooling when cloud amount increases. I see you have done absolutely nothing to refute the validity of those studies.
You refer to the IPCC. In the most recent AR6 report (section 7.4.2.4.2), they specifically say:
In conclusion, there is high confidence in the positive high-cloud altitude feedback simulated in ESMs as it is supported by theoretical, obserrvational, and process modelling studies.
Empirical evidence. Theoretical understanding. Confirmation of the general ideas presented in the 1960s papers I cited that high cloud can cause warming, and that other factors besides area are a factor. All of which refutes your premise. All of which you have shown no evidence of considering or understanding. You simply dismiss it as "unimportant for [your] assessments". You dismiss my references to well-established scientific papers as "your speculations".
I have described the way that water vapour moves around, and the processes in cloud formation, as is covered in nearly any basic meteorology textbook. You have done nothing to argue against that, other than just declaring otherwise.
I have pointed out that increased evaporation in one location, by increasing atmospheric humidity, can lead to less evaporation elsewhere, so that that there is the possibility that little or no net atmospheric humidity increase at a global scale occurs. You have done nothing to refute that point.
The paper you link to (Chen and Dirmeyer) has "summer temperatures" in the title. Summer is only one of four seasons. It talks about local surface cooling when evaporation increases. That is not due to cloud cover changes. In the conclusions, the paper says "In summary, this study highlights the importance of irrigation in the local and regional climate..."
I will give you a hint: "local and regional" does not mean the same thing as "global". Microclimate is not global climate. If you think that part of that paper supports your claims, please provide a specific reference to a page number and quote. Otherwise, you are just throwing out journal references in an attempt to impress. (It's not working.)
Finally, you finish in your last paragraph by saying:
"1% more precipitation / evaporation will not have a major impact on the general cloud pattern."
Yet in comment 71, you said
"1% of the average annual rainfall over land and should therefore create ~ 1% additional clouds over the land mass."
Which is it? It has no major impact, or it has a 1% increase that is just so important that it will cool the globe?
You can't keep your story straight. You can't explain how your diagrams or references actually support the claims you are making. You just assert an opinion, throw out a name or two, and think you've "proven" your case.
- It's albedo
coolmaster at 09:19 AM on 10 September, 2021BL@78
BL: you double-down on your claim of a strong cooling effect for clouds. Let's examine some actual science.
I have already sent you the current science in this regard. The graphics for the global radiation balances all_sky, clear_sky, land & ocean were created and published by Prof. Dr. Martin Wild / ETH Zurich. He is a very nice person and lead author of the IPCC AR6 WGI Chapter 7: The Earth’s energy budget, climate feedbacks, and climate sensitivity. (Chapters 7.2.1 and 7.4.2.4.3 are relevant for our topic.)
You will not find our topic much more actual and precise anywhere, and if you continue to have doubts about the strong cooling influence of clouds - you should contact with Prof. Dr. M. Wild directly.
BL: summary diagrams are summary diagrams - not detailed models."
You will surely see that a slr volume of 1335km³ / year has to be distributed globally and that I therefore use global, summarizing radiation balances.
Using the posted information in the explanatory file on land use and irrigation,
https://www.frontiersin.org/articles/10.3389/feart.2020.00245/full
you also have the opportunity to observe my claims about irrigation, cloud formation, precipitation, temperature, radiative forcing etc. on a more regional level.
BL: ...it condenses to form cloud, but this is not always the case. ...So will this "extra" moisture cause more clouds? Maybe. Maybe not.
You have provided no scientific justification for this claim, or references to suitable scientific publications to support it. You are completely wrong here. You claim that there is some kind of rest room for water vapor in the atmosphere. Could you please prove that.
99,999% of atmospheric water vapor will form a cloud before it return as precipitation. Dew e.g. is also considered to be a form of precipitation.
BL: As a consequence of increasing evporation, the location where the evaporation occurs will also see less thermal energy transfer to the atmosphere, so temperatures are also affected.
Yes Sir - that´s what I mean. More latent heat flux = less sensible(thermal as you say) heat flux. H²O in the air will form clouds - dry and hot air in the atmosphere will kill them. Soil and air temperatures will decrease - and that's exactly what I intend to do with my strategy. You should also know that the extra amount of 1% precipitation/irrigation/evaporation is planed to released predominantly in spring / summer allways into a relatively unsaturated, dry and hot clear_sky atmosphere, which most closely corresponds to a drought period or desert.
Intensification of the global hydrological cycle is a robust feature of global warming, BUT at the same time, many land areas in the subtropics will experience drying at the surface AND in the atmosphere. This occurs due to a ! limited water availability ! in these regions, where the cloudiness is consequently expected to decrease.
Your speculations about different clouds, with their different effects on the albedo and SW / LW radiation effects, are not conducive to the discussion and are unimportant for my assessments. In a dry, hot, sunny high pressure atmosphere, I guess at least that mostly convective fair-weather clouds or thunderclouds (cumulus or c.-nimbus) will arise.
1% more precipitation / evaporation will not have a major impact on the general cloud pattern. The natural regional variability of the amount of precipitation is often 200mm or more between dry and humid years. Since 9mm more or less per year will regionally cause no noticeable changes in the cloud regime. Maybe there will be 3-4 rainy days/year instead of increasing hours of sunshine.
BL: Coolmaster's diagrams are nice pictures that help illustrate a few aspects...
Again - these diagrams are not mine. They are calculated by professionals of IPCC experts. You have no clue about the difference between water- & air cooling, heat capacity & efficiency. That's your problem - not mine. - It's albedo
Bob Loblaw at 12:52 PM on 9 September, 2021Coolmaster:
Little of your most recent comment has passed moderation. In what little remains, you double-down on your claim of a strong cooling effect for clouds. Let's examine some actual science.
Note that in comment 70, although I said that the diagrams you provided in comment 69 were "a useful expansion", I also noted that "summary diagrams are summary diagrams - not detailed models."
First, you claimed in #71 that 1% increase in evaporation will lead to a 1% increase in clouds, and you have repeatedly claimed that increasing cloud has a cooling effect. You also said "I look forward to your criticism and assessment", so let's see if you really mean that.
We will start with the consequences of an increase in evaporation, and we'll limit it to the land surface you have talked about (although it doesn't really make any difference to what I will present). What happens when we manipulate surface conditions to increase evaporation?
- Atmospheric water vapour will increase above that surface.
- The atmosphere will probably move that water vapour away from the surface, either vertically (convective mixing) or horizontally (advection due to wind)..
- If conditions are suitable, that extra water vapour may rise to the point where it condenses to form cloud, but this is not always the case. If it does form cloud, the location may be local, but it is more likely to be a long way away.
- As a consequence of increasing evporation, the location where the evaporation occurs will also see less thermal energy transfer to the atmosphere, so temperatures are also affected. As a result, we see changes in both temperature and humidity, and these changes will be carried downwind.
- Downwind, the changes in temperature and humidity will affect the energy fluxes in those other locations - possibly suppressing evaporation (because the overlying air is now cooler and more humid).
Now, if the additional water vapour forms cloud, we have to ask "what kind of cloud?". That depends on where and how the lifting of the air occurred which led to cooling and cloud formation. Cloud types vary a lot. Wikipedia has a nice discussion, and gives us this nice diagram:
")
So, will this "extra" humidity cause more cloud? Maybe. Maybe not. Maybe it will lead to a different cloud type. Maybe it wll lead to a similar cloud type, but at a different altitude. All of this will affect how radiation fluxes will be affected.
Coolmaster's argument then depends on claims that cloud cover will increase, and that the diagrams he has provided show the radiatove flux changes. Let us consider some of the possible radiative changes.
- A change in horizontal extent - but no change in any other cloud characteristics - will affect the ratios between clear sky and cloudy sky. This is easy to estimate.
- We may not have the same cloud type, though. Different cloud types have different radiative properties. High clouds tend to be thin, transparent, and let a lot of solar radiation through. They also may not behave as blackbodies for IR radiation.
- Low clouds are much less transparent. For IR radiation, two properties are important: cloud top temperature controls the IR emitted upward, while cloud base temperature controls the downward flux. Change the vertical temperature profile, or change the bottom or top heights of the clouds, and you change the IR radiation fluxes. This is not determined by cloud area.
None of these details are covered in the diagrams or discussion presented by coolmaster. I will repeat what I said before: summary diagrams are summary diagrams - not detailed models.
Can we find models that do include thse sorts of effects? Yes. I will dig back into two early climate change papers that were key developments in their day. They covered basics that more recent papers do not repeat, so they provide useful diagrams.
The first is Manabe and Strickler, 1964, JAS 21(4), Thermal Equilibrium of the Atmosphere with a Convective Adjustment.
Their figure 7a shows model results that cover different cloud assumptions:

Note that cloud type and height both have significant effects on the modelled radiative equilibrium. (Follow the link to the paper if you need more context.)
The 1964 paper was followed by another in 1967: Manabe and Wetherald, 1967, JAS 24(3) Thermal Equilibrium of the Atmosphere with a Given Distribution of Relative Humidity
They give two figures of interest: 20 and 21:

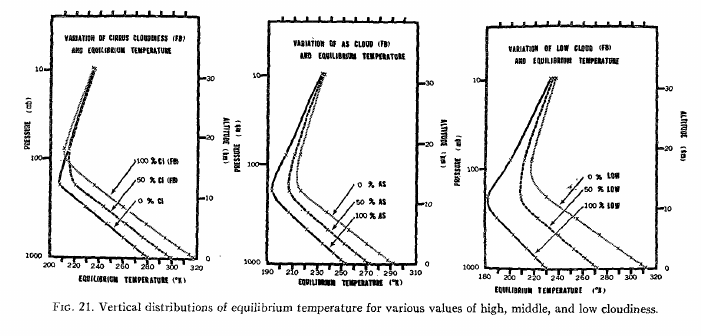
Again, follow the link to the paper for context (and perhaps larger views of the graphs).
These two figures show responses to changes in cloud amounts, for several different cloud types in their model.
- In figure 20, low and middle cloud have negative slopes (temperature as a function of cloud amount), while high cloud has a positive slope. Increasing high cloud has a warming effect.
- In figure 21, we see three diagrams of equilibrium temperature, for the same three cloud types. Each diagram shows the results for three different cloud amounts (0, 50, and 100%). The diagram on the left is for high cloud, and we see warmer tropospheric temperatures for higher cloud amounts. This is the opposite for middle and low cloud, where increasing cloud amount causes cooling.
So, we can see that climate science has know for over 60 years that different cloud types and heights have significant differences in their role in radiation transfer. The papers I have cited used a one-dimensional radiative-convective model, which is simple by modern standards. Current three-dimensional general circulation models incorporate even more vertical cloud processes, and add the horizontal dimensions that include the horizontal transport of water vapour I mentioned at the start of this comment. They generate cloud internally, based on physics, rather than assuming specific distributions - but the key message is the same:
Cloud amount, cloud type, cloud height, horizontal distribution - all are important in properly assessing the radiative effect of clouds.
Coolmaster's diagrams are nice pictures that help illustrate a few aspects of the complexity of clouds and atmospheric radiation transfer, but they are totally unsuited to the sort of predictive analysis he is trying to perform.
- Show me the money: a new slogan for the climate movement
sfkeppler at 05:33 AM on 9 September, 2021By products from tropical nations, which need the standing rainforests, because we have to give more value to the living trees than to their wood or paper. Only the trees take up carbon dioxyde and humidify the atmosphere to form shading clouds and cool rain, washing out big volumes of CO2.
Stefan
- It's albedo
coolmaster at 00:31 AM on 9 September, 2021@76
[snip]
You probably suffer from attention deficit syndrome. Thank god I am mortally bored after repeating the simplest facts of the most simplest climate knowledge more than 3 times - and BL failing to understand them.
I am not going to go around in circles with you a hundred times and then recommend psychopathological treatment to you after 3 months.
This can be done much faster. If your overview is limited to the size of a beer mat - it's not my fault.
BL: ...Increased evaporation must lead to increased precipitation, but this does not necessarily mean that there will be more cloud...
BL: ...basic meteorology, where air must cool to form clouds and precipitation,...
So what now ??? the water vapor turns into a cloud ---------— before it rains -------------— or not ???
[snip] Hopefully you are not here to pluck daisies and ask yourself: Aristotle loves me - Aristotle doesn't love me - Aristotle loves me ................? #?
You knot your brain here within 3 of your own remarkably meaningless sentences - contradicting to yourselve and not at all wondering that you have tomatoes on your eyes?
I have posted the graphs(69) for the global radiation balances all sky/clear sky so that you(and others) hopefully understand that clouds basically have a strong cooling influence on earth temperatures. [snip] You are hopelessly overwhelmed with the most simplest knowledge about CRE and watercycle. You doubt that I can produce clouds ? - ridiculous - I can produce clouds and I do it daily - my tomatoes can produce clouds - the forest next to my door even more - only BL can NOT make clouds - because he's probably "too intelligent", to piss a hole into the snow. You'll end up as a pangburn here if you don't take a quick break to get your neurons in order.
It's bad enough to run into climate deniers around every corner of this world - but folks like you who circulate Babylonian Language Confusion(BLC ??#??) are a whole lot worse.
- It's albedo
Bob Loblaw at 12:10 PM on 8 September, 2021coolmaster:
You continue to make nonsensical arguments.
I quoted your words on ocean precipitation exactly, and I explained the context of how ocean evaporation and preciaption relate to evaporation and precipation over land. The two are not at all independent.
In your most recent post, you state "...and that rain will fall into the sea." Again, you are wrong. Much of the evaporation from oceans does not fall back into the sea. How do I know this? Huge amounts of water flow through rivers and lakes from land to the oceans. The only way to get this back to the land is to evaporate it from the oceans, carry it over land, and let it fall as precipitation over land. You know this. Don't ignore it.
You ask if I am talkiing about desertification when I state "...that things other than evaporation limit both water vapour and cloud cover." No, I am not talking about desertification. I am talking about basic meteorology, where air must cool to form clouds and precipitation, and precipitation falls out of the atmosphere so that wate vapour does not increase continuously as more water evaporates. Atmospheric temperature plays a critical role in when, where, and how much cloud forms, and when, where and how much precipitation falls. Air must rise to cool, and the rise requires one of free convection, orographic forcing, or frontal systems.
Pumping more water vapour into the atmosphere will not act as a forcing for warming or cooling - it can only act as a feedback. Some other factor must cause warming for the atmosphere to hold more water vapour. Increased evaporation must lead to increased precipitation, but this does not necessarily mean that there will be more cloud. as far as radaitive effects are concerned, the latest IPCC report says that a negative cloud feedback is very unlikely. Under a warming climate, evaporation and atmospheric water vapour will both increase, and a negative feedback is what you are trying to claim with your cloud effects. There is very little scientific evidence to support this.
Your "estimate" of additional evaporation leading to "improving cloud cover" makes no sense. Clouds over land get much of their water from ocean evaporation, and much land evaporation gets transported away to make clouds in other locations - where basic meteorology explains the various processes that lead to cloud formation and precipitation.
The link I provided (to water vapour as a greenhouse gas) explains how water vapour is limited by temperature.
I am not confusing radiation effects of cloud and water vapour. I am saying that your claims of changing cloud cover through increasing evaporation are both simplistic and wrong.
Your whole argument rises or falls on your claim that increased evaporation will lead to the cloud cover changes you claim. You have provided no scientific justification for this claim, or references to suitable scientific publications to support it.
(Yes, I looked at the figures at the link you provided. The are predominately seasonal, and you provide no explanation as to what they are supposed to show. Seasonal variations are not a good indicator of of how the climate system responds to long-term changes. Too many confounding variables that you would need to sort out.)
- It's albedo
coolmaster at 05:57 AM on 8 September, 2021Bob Loblaw@74
You seem to be trying to turn the word around in my mouth - you will not succeed. I have never said that precipitation over the seas is irrelevant to the climate - but I claimed that precipitation and evaporation over the sea cannot be held back or manipulated by humans - and that rain will fall into the sea.
You can stand on the beach or on a boat with a big bucket - but is that handy to hold back 1335 km³ per year - NO. Can you give me a practical, affordable way of enhancing evaporation over the sea ? - NO. Do you need proof of this? - I hope NOT.
Just note that I want to increase evaporation by 0,7W/m² over LAND AREAS with 9L/m² and year. This improves also the energy transport from the land surface to the atmosphere by 6.13KWh/m² in spring and summer when this water will be used as additional artifical irrigation.
I've posted some graphics(69) that you think will be a useful extension. There the energy transport from the oceans to the land areas is given as 19W / m² - you don't have to give me any tutoring in this regard.
BL: ... that things other than evaporation limit both water vapour and cloud cover.
Are you talking about desertification? 10% of global surface is desert spreading rapidly. Here I've put together some other graphics and links that can give you an idea of what I'm referring to:
...From the totality of these findings I estimate the cooling radiative forcing resulting from additional evaporation through an improving cloud cover to approx. -0.2W / m² per year over land areas.(or even more due to multiplication effects)
It is suitable to compensate the current, global, annual radiative forcing of approx. + 0.04-0.05W / m² with ease.
In theory, this would stop the rise in earth temperature!
The use of additional "artificial irrigation" and retention measures with an annual, global total volume of 1335km³ = (3.7mm SLR) can reduce the predominantly CO²-related global warming with ~ -0.15W / m² "water cooling" by approx. -0,07 ° C / year.
If you take this additional volume from flowing waters and / or bank filtrate instead of using groundwater
- This also stops the rise in sea levels!
The global measures and changes in water management required for are
thus always an excellent regional protection against periods of drought, but at the same time also against heavy rain and floods.
Assuming that this water volume is completely withdrawn from global runoff and supplied to transpiration through plants or groundwater reservoirs and soil moisture, there is a potential for additional CO² absorption of ~ 4.9 - 9.8Gt / year (C3-C4 plants // 1-2Kg carbon / m³).
Overall, it can be assumed that biodiversity will benefit from additional amounts of water over land and counteract the extinction of species.
BL: A 1% increase in evapoartion will not lead to a 1% increase in clouds over land. (Feel free to provide an actual scientific reference for your claim, should you have one.)
Aristotle and I (and many others) believe in: What goes up - gets colder - and becomes a cloud - and must come down rapidly as water(~8,5days). A huge part of this additional evaporation will precipitate over a land area again (multiplication effect).
The link you sent is of little help. Here, too, the radiation-relevant net effect of clouds and water vapor (CRE = -19W / m²)), which is crucial for my strategy, is missing. You still seem to confuse CRE with the atmospheric feedback of the clouds, which consists in the fact that with increasing temperature less cloud cover, changed lapse rate and optical depth are determined (+ 0.42Wm-2 ° C-1).
May be it`s a good idea to work out this topic here together.
- It's albedo
Bob Loblaw at 11:42 AM on 7 September, 2021Coolmaster:
You seem to be trying to claim that there is some sort of method of controlling climate by increasing evaporation over land, leading to increased cloud cover?
In #72, you state "The amount of precipitation over the sea is therefor also irrelevant because it cannot be held back there."
You are wrong. The amounts of precipitation and evaporation over oceans is highly relevant. to global climate. Globally, oceans evaporate much more water than falls back iinto them as precipitation. The difference is the extra precipitation over land - where precipitation greatly exceeds evaporation for global totals.
The fact that lots and lots of evaporation from oceans is incapable of forcing ever higher and higher atmospheric water vapour and clouds should tell you that things other than evaporation limit both water vapour and cloud cover.
A 1% increase in evapoartion will not lead to a 1% increase in clouds over land. (Feel free to provide an actual scientific reference for your claim, should you have one.)
You may wish to read https://skepticalscience.com/water-vapor-greenhouse-gas.htm
- It's albedo
coolmaster at 02:03 AM on 6 September, 2021@ MA Rodger
"500,000 cu km of annual global precipitation"
Humans can only influence evaporation over the oceans indirectly (via climate change) by higher temperatures and stronger, drier winds. The amount of precipitation over the sea is therefor also irrelevant because it cannot be held back there.
Over land, the average rainfall is only 100,000-120,000km³ - approx. 100xSLR. An intensification of the water cycle by at least 1% will also increase cloud formation over land by ~ 1%.
A share of ~ 8% of the SLR consists of the water that the continents lose every year. Wetlands are drained, glaciers, permafrost areas, groundwater and aquifers are juiced. This promotes the spread of deserts, which are generally characterized by the fact that there are few clouds, little precipitation, little plantgrow(CO² absorption) and little rH. A third of the land area (~ 50 million km²) is already desert and it is spreading rapidly.
After the last Pacific Northwest heat wave at the latest, it should be common knowledge that drought acts as a temperature driver.
The year-round retained amount of 1335km³ is mainly used & transpired in spring and summer after it has been stored in soil moisture and groundwater. Assuming that it is largely transpired through plant growth, an additional 4.9-9.8 Gt of CO² are extracted from the atmosphere every year.
This climate protection strategy may seem Spanish to one or the other - and that is exactly what it has been - for centuries. Equipped with sufficient global water cooling over land, the earth's temperature will fall - not rise !
SLR & global warming will remain a problem as long as neurotic, uncreative CO2 budget-oriented people determine the public's climate protection strategies.
This is also intended as a criticism and is addressed to the Intergovernmental Panel on Climate Change and climate science in general.
- Skeptical Science New Research for Week #35, 2021
coolmaster at 23:36 PM on 5 September, 2021@citizenschallenge
If you scroll down 2 days in the comments, you could have read the answer.
https://skepticalscience.com/argument.php?a=141&p=2#137656
Pangburn talking about water vapor as a GHG looking to the atmosphere ? UUUUPS - he couldn`t see any clouds ??? -— Blind & stupid - like other deniers.
- It's albedo
coolmaster at 01:54 AM on 5 September, 2021@Bob Loblaw
"useful extension"
They are not only a useful extension of the understanding of climate - but also the basis for recognizing where and how humans intervene (or could intervene) in the climate.
Fighting the causes of an evil (GHG emissions) is important and right - but is it actually enough? - I would say - NO. After decades of meditation on Mauna Loa Observatory / Hawaii GHG concentrations are still rising steeply.
So we urgently need a second, additional strategy that is potent enough to stop further global warming.
All possibilities that humans could have available are shown in the changing global radiation balances. There you not only find the disturbed carbon cycle, but also the energy flow of the global water cycle.
When looking at the actual problems (decreasing biodiversity, SLR, droughts, record temperatures, floods, ...) that humans and creation have to suffer with global warming, it is noticeable that they all mainly have to do with the presence or absence of water. The idea of influencing the climate via the water cycle is therefore only logical, more direct and, above all, much faster. (All firefighters in this world nod their heads understandingly)
Let me now briefly explain this alternative climate protection strategy, which does not care much about the causes (mainly CO² & other warming GHG), but should at least noticeably alleviate the above-mentioned effects and problems of climate change:
- 3.7mm SLR = 9mm over the land area = 1335km³ of water = 2.7% of the global runoff via the rivers.
- This volume can be retained by a wide variety of measures before it flows into the oceans and converted into evaporation.
- 9L / m² corresponds to ~ 1% of the average annual rainfall over land and should therefore create ~ 1% additional clouds over the land mass. Also a multiplication effect arises because there is a high probability that these clouds will in turn rain down again over a (different) area of land.
- The net effect of the clouds(CRE) is given by Prof. M. Wild (ETH Zurich) as -19W / m². + 1% additional cloud cover over land (-0.19W / m²) corresponds globally to -0.07W / m² and is therefore a lot more than the current annual increase in radiative forcing.
!!! The rise in sea level and the rise in earth temperature would thus (in theory) be stopped. !!!
In the graphic below I tried to show the simulated additional amount of clouds and water(red numbers) in the radiation balance. I look forward to your criticism and assessment. - Thanks

- It's albedo
coolmaster at 10:43 AM on 3 September, 2021Also in response to blaisct's comment #66 posted over on the Urban Heat Island discussion.
The albedo is relative ... and depends primarily on the wavelength of the light that hits the body. We should therefore always specify a wavelength range for Albedo. Otherwise, strictly speaking, the entire spectrum of the sun is decisive. This relativity to the albedo is particularly important for an element as widespread worldwide as H²O.
As water vapor, it absorbs (28W / m²) largely only in the long-wave range and lets most of the visible light pass through.
As liquid water on the surface, it absorbs long-wave and short-wave light very strongly, although as a cloud in the same aggregate state, finely distributed in the atmosphere, it again reflects a high proportion (-47W / m²) of the high-energy, short-wave radiation.
As solid ice or snow on the surface, it reflects short-wave radiation as well as clouds. On the other hand, in the long-wave range it behaves like a black body and a layer of ice over the open sea isolates the one below
warmer water and prevents it from emitting its heat radiation to the atmosphere and space which in turn relativizes the ice albedo effect.
So @bleisct is not that wrong if he ascribes the Earth's albedo a major influence on global temperatures. The atmosphere (and every single component - including CO² molecules) also has an albedo if the solar spectrum is viewed holistically across all wavelength ranges and light refraction and transmission are taken into account as factors. Higher levels of GHG lower earth`s albedo by absorbing ~20% of radiation energy.
@MA Rodger is right when he remarks that the cloud albedo ingeniously has the strongest albedo and the global albedo(change) is of very minor importance over urban areas.
With a global mean surface albedo of 13.5% and net shortwave clear-sky flux of 287 Wm−2 at the TOA this results in a global mean clear-sky surface and atmospheric shortwave absorption of 214 and 73 Wm−2, respectively. From the newly-established diagrams of the global energy balance under clear-sky and all-sky conditions, we quantify the cloud radiative effects(CRE) not only at the TOA, but also within the atmosphere and at the surface.
 cloud radiative effects (CRE)")
When assessing the earth`s albedo, it`s also helpfull to have a look to the different radiation balances from land and sea and the fact that the cloud albedo is very closely interlinked with latent heat flux of evaporation in the radiation balance.
Do not confuse the strongly cooling CRE (-19W / m²) with the warming cloud radiative feedback CRF of ~ + 0.42Wm-2 ° C-1, which is a missing +RF in the above graphic by @Bob Loblaw as is also the radiative forcing of the ice Albedo effect.
.


- It's albedo
Bob Loblaw at 02:35 AM on 15 August, 2021Also in response to blaisct's comment #66 posted over on the Urban Heat Island discussion.
Blaisct:
You continue to make poor choices in the numbers and calculations that you are doing. Going over your latest effort by number:
1. You continue to select an albedo for urban areas that is too low for anthropogenic surfaces, and you have failed to cite a reference for your value. In my comment # 64 on the Urban Heat Island discussion, I gave a reference to several artificial surface materials, all with albedo values that exceed the the value you have chosen. "Urban" areas are a mix of things like grass, roads, houses, etc. You would need to calculate how much of the surface is covered by each type, and work out an albedo for an "urban" area that way. If that is what you have done, you need to show your detailed calcuations on how you arrive at the 0.08 value.
2. There are no assumptions in the 0.31 albedo value for the earth as a whole. That is based on satellite measurements, and includes reflection from the surface, clouds, clear atmosphere, etc. Note that the only part of the surface reflection that reaches space is the part that makes it back out through the atmosphere and cloud cover. To calculate this in a model (which is what you are trying to do), you need to account for spatial variations (and daily/seasonal cycles) of solar input, surface albedo, cloud cover, and atmospheric conditions.
3 to 14. You continue to make unreasonable assumptions about the area that is undergoing a surface change, and how it relates to population. There is no reason to think that they are related through a simple proportion.
15 to 20. You continue to make errors in converting solar output (1367 W/m^2 measured perpendicular to the sun's rays) to an areal average over the surface of the earth. As MIchael Sweet points out, there is a factor of 4 involved, not a factor of 2. I also mentioned this in my earlier comment. If you do not understand why this is the case, then it is difficult to see how you can expect to do any useful calculations. You also need to consider seasonal variations in solar radiation distribution and seasonal albedo.
21. Converting radiative forcing to global temperature change involves looking at the top-of-atmosphere changes (what is seen from space), not surface changes alone. To properly incorporate surface changes into a calcuation, you need to use a much more complicated model of climate response to surface albedo changes.
22. You still get a wildy incorrect answer, due to bad data input and bad assumptions.
I have not bothered to follow the link to the Mark Healey document you mention. If that is the source you are getting your incorrect ideas from, then it is not worth bothering. The result you quote (that albedo changes can account for all the obsvered temperature rise) is completely inconsistent with the science.
Over at RealClimate, they have recent posted several articles on the just-released IPCC reports. One of those summarizes 6 key results. In that post, they provide the following graph from the IPCC report, which shows the estimated temperature response due to a variety of factors over the last 100 to 150 years. "Land use reflection and irrigation" is the second-last bar on the right. Note that the calculated effect is minor cooling, not warming.

Michael Sweet's suggestion to read the IPCC reports is a good one. I often suggest that people start with the first 1990 report, as this covers a lot of the basic climate science principles in a manner that is easier to understand for the non-expert. In the 1990 report, they mention the Sagan et al paper I linked to in my first comment. Google Scholar can probably help you fnd a free copy.
https://science.sciencemag.org/content/206/4425/1363.abstract
- It's Urban Heat Island effect
blaisct at 01:01 AM on 14 August, 2021Thanks All for the input. You are increasing my understanding of the albedo effect. I appreciate the articles you mentioned and see that the subject is very complex and calculations like mine are only useful for understanding the simple significance of the many variables and not useful for reaching conclusions or predictions. One general conclusion that seem to come from all the articles and papers is that albedo is most likely significant but there is not agreement on how significant, or the range of each of the variables, or the total interaction of all the albedo variables. I sure hope that the GW experts are improving their models with new NASA satellite data. Does anyone out there know how much of the current GW data (1.1’C) in the IPCC model is accounted for by albedo change?
For entertainment only, I redid the significance of the 0.7% urban of total earth surface what if calculation to include some of the comments.
1. The reported albedo of urban areas is about 0.08 (double the 0.04). (Albedo on a 0.0 to 1.0 scale)
2. The reported total albedo of the earth is about 0.31. (Assume that includes clouds and urban albedo)
3. % of earth that is urban: =0.7%
4. The non-urban area of the earth is: 100%-0.7%= 99.3%
5. The contribution of urban areas to the total albedo is: 0.08 * 0.7% = 0.00056
6. The total non-urban area albedo contribution to the total is: (0.31-0.00056)/ 0.993 = 0.31162
7. Assume the non-urban area albedo in the 1880 era was the same as today: =0.31162
8. Current earth population is about = 7.8 B
9. 1880 era population is about =1.3 B (Using 1880 as the approximate start of IPCC temp data)
10. Assume the 1880 era urban area was proportional to population: = 1.3/7.6*0.7% = 0.12%
11. The 1880 era urban area contribution to total albedo was: 0.07*0.12% = 0.0000933
12. The 1880 era non-urban area contribution to the total albedo was: (1- 0.12%)*0.31162 = 0.311257
13. The 1880 era total albedo estimate is: 0.311257+ 0.0000933 = 0.311351
14. The difference in 1880 vs 2021 albedo is : 0.311351 – 0.31 = 0.00135 (or about 0.14% albedo change)
15. The reported output of the sun reaching the earth is about: 1367 W/m^2
16. Assume that the urban albedo is only seeing one half (balk of urban areas are in the middle half of the earth’s surface) of the above due to the curvature of the earth: 50%
17. Average surface of the earth cloud cover: =67%
18. Average albedo of clouds: = 50%
19. Total sun’s output reaching cloud covered urban areas + non cloud covered urban (corrected for curvature) is : 455 W/m^2.
20. Therefore, this energy of the albedo difference is: 0.00135* 455= 0.61W/m^2
21. I have seen conversion factors for converting this to ‘C in earth temperature rise of 0.5 to 0.7 ‘C/W/m^2. I’ll use the 0.5.
22. The equivalent earth temperature rise of the above albedo change from 1880 to now is: 0.61*.5 = 0.31’C
The IPCC reported temperature rise over the 1880 to now is about 1.1’C. This what if calculation implies that a 0.7% urban area could account about 30% of this temperature rise – not insignificant.
One of the papers (in your previous references) on land use albedo change seems to agree that man-made albedo changes (mainly in agriculture by Mark Healey https://www.scirp.org/pdf/ijg_2020062914563820.pdf) are significant and could account for all the IPCC temperature rise. Mark Healey’s paper suggest that land use changes since 1910 are stronger than the UHI albedo effect.
I am switching over to the “It’s albedo” thread. What are all the possible albedo changes since 1880? - It's Urban Heat Island effect
MA Rodger at 06:51 AM on 28 July, 2021blaisct @62,
Perhaps repeating some of the criticism @64:-
You say "The IPCC seems to give man-made albedo changes low significance because it is hard to measure and hard to detect change." But difficulty does not appear to be something to dampen your enthusiasm.
Do note that 0.04 albedo is far too low and, while potentially applicable to a sky-pointing piece of asphalt, is not applicable to urban areas. Also note that clouds float above cities forests and oceans alike and they contribute some 75% of the planet's albedo. And also note that the sun sets every evening and never rises to be overhead except at noon in the tropics. You need to divide the tropical noon-day value by four to satisfy the very simple geometry of spheres.

The solar radiation actually reflected spacewards by the Earth's surface is shown in the diagram at 23Wm^-2. If by 2100AD, the planet's urban spread were somehow to reach over 0.7% of the planet's surface area (as the most extreme projection in the graphic @60 suggests is possible) and even if that 0.7% had an albedo of zero, that 23Wm^-2 would only reduce by [23 x 0.007 =] 0.16Wm^-2 which, despite the use of the most exaggerating numbers, is significantly smaller (x10 smaller) for 2100AD than the value you arrive at for today's value. Using more realistic numbers would return an insignificant result (x100 smaller).
- It's Urban Heat Island effect
blaisct at 03:59 AM on 28 July, 2021Thanks MA Rodger, my fault, I used the % (3%) of the earth land mass that was urban instead of the % of the total earth that was urban. The number from your graph of 0.7% urban (of the total earth area) seems to agree with other published information. I assume the heat from the “heat island” effect would be well mixed around the earth and become part of the total measurement of climate change. I present the following to check out the significance of the 0.7%.
1. The reported albedo of urban areas is about 0.04. (Albedo on a 0.0 to 1.0 scale)
2. The reported total albedo of the earth is about 0.31. (Assume that includes clouds and urban albedo)
3. The non-urban area of the earth is: 100%-0.7%= 99.3%
4. The contribution of urban areas to the total albedo is: 0.04 * 0.7% = 0.00028
5. The total non-urban area albedo contribution to the total is: (0.31-0.00028)/ 0.993 = 0.31190
6. Assume the non-urban area albedo in the 1880 era was the same as today: =0.31190
7. Current earth population is about = 7.8 B
8. 1880 era population is about =1.3 B (Using 1880 as the approximate start of IPCC temp data)
9. Assume the 1880 era urban area was proportional to population: = 1.3/7.6*0.7% = 0.12%
10. The 1880 era urban area contribution to total albedo was: 0.04*0.12% = 0.000047
11. The 1880 era non-urban area contribution to the total albedo was: (1- 0.12%)*0.3119 = 0.31154
12. The 1880 era total albedo estimate is: 0.311538+ 0.000047 = 0.311585
13. The difference in 1880 vs 2021 albedo is : 0.311585 – 0.31 = 0.001585 (or about 0.16% albedo change)
14. The reported out put of the sun reaching the earth is about: 1367 W/m^2
15. Therefore, this albedo difference is: 0.001585* 1367 = 2.1680W/m^2
16. I have seen conversion factors for converting this to ‘C in earth temperature rise of 0.5 to 0.7 ‘C/W/m^2. I’ll use the 0.5.
17. The equivalent earth temperature rise of the above albedo change from 1880 to now is: 2.168*.5 = 1.08’C
The IPCC reported temperature rise over the 1880 to now is about 1.0’C. This calculation implies that a 0.7% urban area could account for all of that temperature rise. I know this is over simplified, and was only done to find out the significance of small changes in a higher heat source ( over 4X lower albedo in urban areas vs the earth as a whole) on the earth surface. Other factors in albedo change should also be included: roads, forest fires land area, sea ice melting, land ice melting, rain forest destruction, and farming practices. I can only guess that including these albedo changes in the above would increase the man-made albedo global warming calculation.
The IPCC seems to give man-made albedo changes low significance because it is hard to measure and hard to detect change. Population change and even atmospheric CO2 change should also be an indicator of historical man-made albedo change, just need a reference point. - The Albedo Effect and Global Warming
blaisct at 06:35 AM on 20 July, 2021Reading about resent NASA satellite data on finding increase heat loss to space makes me wonder how this increase in heat loss is consistent with the Radiative Forcing theory of the IPCC. My understanding of that theory is that as atmospheric CO2 increase it hold in more heat and makes the surface temperature hotter like a blanket effect while the heat loss to space remains the same. The NASA data does not seem to support the Radiative Forcing theory or I must not understand the Radiative Forcing theory. Where is the extra heat coming from?
Also reading about the “heat island” effect from big cities (up to 15’F difference between urban and suburban) makes me wonder could this be related to the NASA data on heat loss? Has population gotten big enough to have an impact on global warming? The “heat island” effect is caused by the much lower albedo (reported as 0.04, cloud free) of urban areas vs the earth as a whole (reported at 0.31). Using IPCC data one can calculate that an albedo change of only 0.15% (+1’C) is needed to account for all of the temperature change from 1880 until now. (that is a hard to detect 0.001%/year). While we are waiting on that detection level we can use related data to estimate man-made albedo change like population or atmospheric CO2.
The earth’s urban area is reported at 3.1% of the total area of the earth. The urban area back in 1880 (start of IPCC global warming data) is estimated at 0.7% (proportional to population) over 4X change. In 1880’s the “heat island” albedo effect was probably insignificant plus there was not many black parking lots or paved roads. The IPCC reports a 1’C rise in temperature since 1880. Using published information one can calculate the heat rise of the current 3.1% urban area at 4’C rise (since 1880) in earth temperate just from the urban area albedo change. (Using IPCC data of sun’s radiation to the earth at 1367w/m^2 and surface temperature rise correlation of 0.5 ‘C/w/m^2). The calculated 4’C rise is more heat than necessary to account for the 1’C observed this is probably due the reflective increase in clouds (water evaporation that eventually become clouds and reflects sun light) that would come with more heat from urban area. This overly simplified estimate of the man-made albedo effect suggests a more scientific version of albedo change should be included in any global warming model or theory. As the population of the earth gets bigger and urban areas grow this effect will get bigger. There are also other man-made albedo effects (destruction of rain forest, forest fires, melting of sea ice, and agricultural practices) which would be proportional to their % of the earth’s surface and their individual albedos.
The earth’s population should be a good indicator of urban area increase and thus man-made albedo change. Atmospheric CO2 is also corelated to population should also be a good indicator of urban area increase (albedo decrease). Are CO2 and albedo confounded in their correlation to global warming? Which force is bigger? The above calculation suggest albedo. NASA's ongoing map of the earth's cloud free albedo should be a big help in including albedo in global warming models, initial results seem to support the above.
- The New Climate War by Michael E. Mann - our reviews
Nick Palmer at 09:33 AM on 23 June, 2021Just in case you lot are still resisting the idea that the politics relating to climate science have become extremely polarised - in my view to the point where ideologues of both the left and right think it justified to exaggerate/minimise the scientific truths/uncertainties to sway the democratically voting public one way or the other - here's a video blog by alt-right hero and part of the original Climategate team who publicised the emails, James Delingpole basically saying that 'the left' have infiltrated and corrupted the science for the purpose of using political deception to seize power for themselves.
https://www.youtube.com/watch?v=866yHuh1RYM
Deconstruct or follow up Delingpoles' rhetoric elsewhere and you will find a helluva lot of intelligent articulate people who believe that the public's environmental consciences are being exploited by closet socialist forces to deceive them, using 'fear porn', into voting for policies which they otherwise wouldn't consider voting for, in a dark strategy to bring in some form of latter day Marxism. They insinuate this has got its tentacles into climate science which they assert has led to the reality of the science, as presented to the public, being twisted by them for political ends. It's absolutely not just Greenpeace, as I already said, who've 'gone red' to the point where it has 'noble cause' corrupted their presentations of environmental matters and, crucially, the narrow choice of solutions they favour - those which would enable and bring on that 'great reset' of civilisation that they want to see. It's much, much bigger than that.
I think we are seeing a resurgence and a recrystallisation of those who got convinced by Utopianist politics of the left and free market thinkers of the right taught at University - Marxist-Leninism, Ayn Rand, Adam Smith etc. Most of those students eventually 'grew up' and mellowed in time, leaving only a small cadre of incorrigible extremists but who are now, as the situation is becoming increasingly polarised politically, revisiting their former ideologies. In essence 'woking' up. I submit that the real battle we are seeing played out in the arena of climate matters is not between science and denialism of science - those are only the proxies used to manipulate the public. The true battle is between the increasingly polarised and increasingly extreme and deceitful proponents of the various far left and right ideologies and their re-energised followers.
It is now almost an article of faith, so accepted has it become, amongst many top climate scientists and commentators, that 'denialism' is really NOT motivated by stupidity or a greedy desire to keep on making as much money as possible but is rather a strong resistance to the solutions that they fear are just 'chess moves' to bring about the great Red 'reset' they think the 'opposition' are secretly motivated by.
Here's an excellent article by famous climate scientist Katharine Hayhoe identifying those who are 'solutions averse' as being a major factor in denialism. It touches on the 'watermelon' aspect. You can turn a blind eye to what I am saying if you want, but in that case you should also attack Hayhoe too - but don't expect many to applaud you...
https://theecologist.org/2019/may/20/moving-past-climate-denial
Also try this: https://www.thecut.com/2014/11/solution-aversion-can-explain-climate-skeptics.html
https://today.duke.edu/2014/11/solutionaversion
I think some people who fight climate science denialism still have the naive idea that just enlessly quoting the science to them, and Skepticalscience's F.L.I.C.C logical fallacies, will make denialists fall apart. I too used to think that if one would just keep hammering away, eventually they would give up. Anyone who tries this will find that it actually does not work well at all. Take on some of the smarter ones and you will rapidly find that you are, at least in the eyes of the watching/reading/listening public, who are the only audience it's worthwhile spending any time trying to correct, outgunned scientifically and rhetorically. That's why I don't these days much use the actual nitty-gritty science as a club with which to demolish them because the smarter ones will always have a superficially plausible, to the audience at least, comeback which looks convincing TO THE AUDIENCE. Arguing the science accurately can often lose the argument, as many scientists found when they attempted to debate such notorious, yet rhetorically brilliant sceptic/deniers such as Lord Monckton.
I haven't finished trying to clarify things for you all but right back at the beginning, in post#18, I fairly covered what I was trying to suggest is a more realistic interpretation of the truth than the activist's simplistic 'Evil Exxon Knew' propaganda one. In short, most of you seem to believe, and are arguing as if, the science was rock solid back then and that it said any global warming would certainly lead to bad things. This is utterly wrong, and to argue as if it was true is just deceitful. As I have said, and many significant figures in the field will confirm, I've been fighting denialism for a very long time so when denialists present some paper or piece of text extracted from a longer document as 'proof' of something, I always try and read the original, usually finding out that they have twisted the meaning, cherry picked inappropriate sentences or failed to understand it and thereby jumped to fallacious conclusions - similarly I read the letters and extracts that Greenpeace used and, frankly, either they were trying deliberately to mislead or they didn't understand the language properly and jumped to their prejudiced conclusions and then made all the insinuations that we are familiar with and that nobody else seems be questioning much, if at all. The idea that Exxon always knew that anthropogenic climate change was real (which they, of course, did) AND that they always knew that the results of that would be really bad and so they conspired to cover that bad future up is false and is the basis of the wilful misreading and deceitful interpretation of the cherry picked phrases, excerpts and documents that has created a vastly worse than deserved public perception of how the fossil fuel corporations acted. Always remember that, at least ideally, people (and corporations) should be presumed innocent until proven beyond reasonable doubt to be guilty. Greenpeace/Oreskes polemics are not such proof. Their insinuations of the guilt of Big Oil is just a mirror image of how the Climategate hackers insinuated guilt into the words of the top climate scientists.
Here's a clip from my post#18
NAP: "When activists try to bad mouth Exxon et al they speak from a 'post facto' appreciation of the science, as if today's relatively strong climate science existed back when the documents highlighted in 'Exxon knew' were created. Let me explain what I think is another interpretation other than Greenpeace/Oreskes'/Supran's narratives suggesting 'Exxon knew' that climate change was going to be bad because their scientists told them so as far back as the 70s and 80s. Let me first present Stephen Schneider's famous quote from 1988 (the whole quote, not the edited one used by denialists).
S.S. "On the one hand, as scientists we are ethically bound to the scientific method, in effect promising to tell the truth, the whole truth, and nothing but – which means that we must include all doubts, the caveats, the ifs, ands and buts. On the other hand, we are not just scientists but human beings as well. And like most people we’d like to see the world a better place, which in this context translates into our working to reduce the risk of potentially disastrous climate change. To do that we need to get some broad based support, to capture the public’s imagination. That, of course, means getting loads of media coverage. So we have to offer up scary scenarios, make simplified, dramatic statements, and make little mention of any doubts we might have. This “double ethical bind” we frequently find ourselves in cannot be solved by any formula. Each of us has to decide what the right balance is between being effective and being honest. I hope that means being both.""
Stephen Schneider, as a climate scientist, was about 'as good as it gets' and he said that in 1988. Bear in mind that a lot of the initial framing to prejudice readers that 'Exxon knew' used was based on documents from considerably longer ago, so what are the activists who eagerly allowed themselves to be swept up in it until no-one questioned it turning a blind eye to? It's that the computer models of the time were extremely crude because computer technology back then was just not powerful enough to divide Earth up into enough finite element 'blocks' of small enough size to make model projections of much validity, in particular projections of how much, how fast and how bad or how good... Our ideas of the feedback effects of clouds and aerosols back then was extremely rudimentary and there were widely differing scientific opinions as to the magnitude or even the direction of the feedback. The scientific voices we see in Exxon Knew tend to be those who were suggesting there was lot more certainty of outcome than there actually was. That their version has been eventually shown to be mostly correct by a further 40 years of science in no way means they were right to espouse such certainty back then - just lucky. As I pointed out before, even as late as the very recent CMIP6 models, we are still refining this aspect - and still finding surprises. To insinuate that the science has always been as fairly rock solid as it today is just a wilful rewriting of history. Try reading Spencer Weart's comprehensive history of the development of climate science for a more objective view of the way things developed...
ExxonMobil spokesperson Allan Jeffers told Scientific American in 2015. “The thing that shocks me the most is that we’ve been saying this for years, that we have been involved in climate research. These guys (Inside Climate News) go down and pull some documents that we made available publicly in the archives and portray them as some kind of bombshell whistle-blower exposé because of the loaded language and the selective use of materials.”
Look at the phrases and excerpts that were used in both Greenpeace's 'Exxon Knew' and 'Inside Climate News's' exposés. You will find they actually are very cherry picked and relatively few in number considering the huge volumes of company documents that were analysed. Does that remind you of anything else? Because it should. The Climategate hackers trawled through mountains of emails - over ten years worth - to cherry pick apparently juicy phrases and ended up with just a few headline phrases, a sample of which follow. Now, like most of us now know, there are almost certainly innocent and valid explanations of each of these phrases, and independent investigations in due course vindicated the scientists. Reading them, and some of the other somewhat less apparently salacious extracts that got less publicity, and comparing them with the 'presented as a smoking gun' extracts from Greenpeace/Oreskes/Supran etc I have to say, on the face of it, the Climategate cherry picks look more evidential of serious misdeeds than the 'Exxon Knew' excerpts. Except we are confident that the Climategate hackers badly misrepresented the emails by insinuating shady motives where none were. Why should we not consider that those nominally on the side of the science did not do the same? Surely readers here are not so naive aas to believe that everyone on 'our side' is pure as the driven snow and all those on the 'other side' are evil black hats?
Here's a 'top eight'
1) Phil Jones "“I’ve just completed Mike’s [Mann] Nature trick of adding in the real temps to each series for the last 20 years (i.e. from 1981 onwards) and from 1961 for Keith’s [Briffa] to hide the decline.”
2) “Well, I have my own article on where the heck is global warming…. The fact is that we can’t account for the lack of warming at the moment and it is a travesty that we can’t.” [Kevin Trenberth, 2009]
3) “I know there is pressure to present a nice tidy story as regards ‘apparent unprecedented warming in a thousand years or more in the proxy data’ but in reality the situation is not quite so simple." Keth Briffa
4) Mike [Mann], can you delete any e-mails you may have had with Keith [Trenberth] re AR4? Keith will do likewise…. Can you also e-mail Gene and get him to do the same? I don’t have his e-mail address…. We will be getting Caspar to do likewise.” [Phil Jones, May 29, 2008]
5) “Also we have applied a completely artificial adjustment to the data after 1960, so they look closer to observed temperatures than the tree-ring data actually were….” [Tim Osborn, Climatic Research Unit, December 20, 2006]
6) “I can’t see either of these papers being in the next IPCC report. Kevin [Trenberth] and I will keep them out somehow, even if we have to redefine what the peer-review literature is!” [Phil Jones, July 8, 2004]
7) “You might want to check with the IPCC Bureau. I’ve been told that IPCC is above national FOI Acts. One way to cover yourself and all those working in AR5 [the upcoming IPCC Fifth Assessment Report] would be to delete all e-mails at the end of the process. Hard to do, as not everybody will remember it.” [Phil Jones, May 12, 2009]
8) “If you look at the attached plot you will see that the land also shows the 1940s warming blip (as I’m sure you know). So, if we could reduce the ocean blip by, say 0.15 deg C, then this would be significant for the global mean—but we’d still have to explain the land blip….” [Tom Wigley, University Corporation for Atmospheric Research, to Phil Jones, September 28, 2008]
Please at least consider the possibility that Greenpeace, who have been deceiving the public about the toxicity and carcinogenicity of this, that and the other for decades (ask me how if you want to see how blatant their deceit or delusion is... showing this is actually very quick and easy to do) were, in a very similar way, and motivated by their underlying ideology, deliberately (or delusionally) misrepresenting innocent phrases to blacken names excessively too.
- The New Climate War by Michael E. Mann - our reviews
Bob Loblaw at 05:42 AM on 13 June, 2021Oh, Nick. You're repeating yourself, and it does not stand you in good stead.
"The short answer is that Big Oil continued to support the "B.S. factories" because they were effective at trying to protect those corporations against unwarranted attack."
I really hope that you do not consider sound science (even with uncertainties) to be "an unwarranted attack".
If you are referring to non-scientific organizations such as Greenpeace, then I hope that you are not saying that unwarranted attacks justify B.S., simply because it is "effective".
"...most seem to have been happy to accept Greenpeace et al's interpretation of events as gospel..."
A strawman position...
"I refer you again (3rd time) to my quote of Carbonbrief's article and the words of top climate scientist Andrew Dessler of Texas A&M Uni."
Repeating the quote is certainly not necessary. Using phrases such as "top climate scientist" represent an argument from authority. I was already teaching undergraduate and graduate climatology courses when Andrew Dessler was still a grad student. I had and have direct knowledge of the primary peer-reviewed scientific literature from that time.
I hope that you do not think that the 1.5C to 4.5 C sensitivity range is a complete summary of climate science.
I hope that you do not think that there was a huge amount of uncertainty regarding the lower limit back in the 1980s. There was lots of uncertainty of regional effects. Lots of uncertainty about cloud feedback effects (but unlikely to be strongly negative).
From the 1990 IPCC sumamry for policy makers:
There are many uncertainties in our predictions particularly with regard to the timing, magnitude and regional patterns of climate change, due to our incomplete understanding of:
• sources and sinks of greenhouse gases, which affect predictions of future concentrations
• clouds, which strongly influence the magnitude of climate change
• oceans, which influence the timing and patterns of climate change
• polar ice sheets which affect predictions of sea level rise
These processes are already partially understood, and we
are confident that the uncertainties can be reduced by
further research However, the complexity of the system
means that we cannot rule out surprises
THe 1990 IPCC report includes quite a bit of discussion about these uncertainties, and what needs to be done to sort them out.
One of the very few sources of a realistic argument for low sensitivity was Lindzen's "Iris effect". As Lindzhen had a good reputation as a meteorologist, this hypothesis was taken seriously. It did not pan out.
Most of the rest of the "sensitivity is low" arguments were B.S. Many were clearly B.S. in the 1980s - and are still B.S. now, even though they keep getting repeated..
Dessler may feel that the uncertainty was underestimated. Do you have any evidence of an actual number that he would put on it?
Did Exxon choose to push the known uncertainties and realistic scientifically-supportable possibitiies? No. As you admit, they chose the Baffle Them With B.S. option.
You seem to feel that was justified on their part. I do not.
"...the views of sensitivity at the time were just not solid enough to mandate massive corporation change..."
...but they were solid enough to start to invest considerable money (albeit probably peanuts for Big Oil) in the B.S. factories, in an attempt to preserve and maximize corporate profits for as long as possible.
If Big OIl's approach was so honorable, then why did they try to hide the path of the money and keep their name off it?
If you were to argue that Big Oil's corporate responsibility is to maximize shareholder value regardless of ethics, then I would concede the point.
- The New Climate War by Michael E. Mann - our reviews
Nick Palmer at 23:49 PM on 9 June, 2021When activists try to bad mouth Exxon et al they speak from a 'post facto' appreciation of the science, as if today's relatively strong climate science existed back when the documents highlighted in 'Exxon knew' were created. Let me explain what I think is another interpretation other than Greenpeace/Oreskes'/Supran's narratives suggesting 'Exxon knew' that climate change was going to be bad because their scientists told them so as far back as the 70s and 80s. Let me first present Stephen Schneider's famous quote from 1988 (the whole quote, not the edited one used by denialists).
"On the one hand, as scientists we are ethically bound to the scientific method, in effect promising to tell the truth, the whole truth, and nothing but – which means that we must include all doubts, the caveats, the ifs, ands and buts. On the other hand, we are not just scientists but human beings as well. And like most people we’d like to see the world a better place, which in this context translates into our working to reduce the risk of potentially disastrous climate change. To do that we need to get some broad based support, to capture the public’s imagination. That, of course, means getting loads of media coverage. So we have to offer up scary scenarios, make simplified, dramatic statements, and make little mention of any doubts we might have. This “double ethical bind” we frequently find ourselves in cannot be solved by any formula. Each of us has to decide what the right balance is between being effective and being honest. I hope that means being both."
I submit that part of the apparently damning content of the documents was exactly caused by Exxon's scientists, Schneider-like, simplifying their message to initially present it to their corporate employers. In exactly the same way that the denialosphere combed though the Climategate emails to find apparently damning statements and then interpreted them through a filtered 'lens' to insinuate fraud and data manipulation, usually by editing out context etc and even previous and subsequent sentences which changed the meaning completely, I submit that Greenpeace's 'Exxon knew' team did that too. They knew that the majority of people who read their report would assume that the current science that projects the bad consequences that we are (fairly) sure about today was as rock solid back way back then as it is now and would therefore jump to their desired conclusion that Big Capitalist Oil was just being evil. I'm absolutely not suggesting that Greenpeace's team were consciously being deceptive, just that they allowed their zealotry to run away with them so they saw just what they wanted to see...
Today's science, that projects bad outcomes, was by no means solid back then. I think that what Big Oil should be fairly accused of is the much less 'evil' culpability of not adequately informing the public about the full probabilities of the risks - which again is the 'Schneider' method of tailoring one's output for one's audience. Perhaps they didn't get "the right balance is between being effective and being honest" quite right. As denialists will endlessly tell us, the use of fossil fuels has been on balance a huge boon to humanity and I suspect that past one-dimensional calls by activists (including those I naively made!) to not use or explore for any more fossil fuels almost overnight, to a corporate mind, would require a public relations strategy to counter that extremist view while waiting for the science to get solid enough to start serious corporate planning for change should it be needed.
'Ban all exploration for or use of fossil fuels today' is a frequent call of today's extremists and no doubt they are sincere that they think the risks are such that such draconian action must be justified, and that things such as new technology, carbon capture, Gen3/4 nukes, agricultural changes etc must be Machiavellian Big Industry just manouevring to do nothing now to protect their financial bottom lines - delaying tactics that must be resisted. I think Professor Mann too has fallen in to the trap of feeling 'certainty' about what he thinks the solutions should be and this has lead to his dismissal, even libellous characterisations, of those who offer up a more nuanced way forward. Activists who call for an immediate ban on fossil fuels and 100% renewables by next Tuesday do not seem to realise that they are thinking in a one-dimensional way. Their 'solution' might address climate change, but such a solution would instantly cause enormous global disruption and would likely spark off the mother of all global economic recessions, which would rapidly cause long lasting extreme global hardship much greater, at least in the short to medium term, than anything global warming is scheduled to do for several decades.
So what were the 'uncertainties' back then? Some of the most important parameters plugged into climate models are those for climate sensitivity. While (widely varying) estimates existed before 2000 it only got well constrained and modelled within firm(ish) limits by papers published after then. Check out the links in this Skepsci article to see when the major papers were published.
https://skepticalscience.com/climate-sensitivity.htm
Here is Carbonbrief.org explaining the lack of certainty back then
"From Carbon Brief https://www.carbonbrief.org/explainer-how-scientists-estimate-climate-sensitivity
"In 1979, the Charney Report from the US National Academy of Sciences suggested that ECS was likely somewhere between 1.5C and 4.5C per doubling of CO2. Nearly 40 years later, the best estimate of sensitivity is largely the same.
However, Prof Andrew Dessler at Texas A&M University pushes back on this suggestion. He tells Carbon Brief:
I think that the idea that ‘uncertainty has remained the same since the late 1970s’ is wrong. If you look at the Charney report, it’s clear that there were a lot of things they didn’t know about the climate. So their estimate of uncertainty was, in my opinion, way, way too small"
"Back in 1979, climate science was much less well understood than today. There were far fewer lines of evidence to use in assessing climate sensitivity. The Charney report range was based on physical intuition and results from only two early climate models.
In contrast, modern sensitivity estimates are based on evidence from many different sources, including models, observations and palaeoclimate estimates. As Dessler suggests, one of the main advances in understanding of climate sensitivity over the past few decades is scientists’ ability to more confidently rule out very high or very low climate sensitivities.""
Activists try to insinuate that the documents and memos show that Big Oil 'knew the scientific truth' back then and adopted a position of denial, or psychopathic deception for the sake of profits, in the face of noble environmental groups campaigning against them because they also 'knew the truth' too. Much though it pains me to admit it, I was part of the campaigning certainy of those groups back then. I used to coordinate a Friends of the Earth area group and all the material I saw did not mention any of the scientific doubts and the uncertainties which featured in the scientific literature. I trusted it - it was the same thing we see today when such as Extinction Rebellion go waay over the top with the certainty of their assertions and the cherry picked nature of the information they present to the public. This is why I think that all sides - denialist/alarmist/doomist/sceptic etc - use misleading rhetoric to spin their narratives. I realise that many of the environmental activist 'troops' in their crusades like to feel certain that they know the 'truth' that Evil Big Industry had psychopathically tried to hide but I think total honesty is necessary to enable the public to judge the situation properly, so that policy changes we need are not based on the shifting sand that the 'divine deception' of the rhetoric of extremist campaigners and political forces is. Noble cause corruption is not a good strategy whether it is that of the greens, the left or right.
It's not as if even today's science is completely bulletproof, as a new paper about clouds shows. Consideration of it offers up an explanation as to why the new CMIP6 models are running too hot, and that is because observations show that some parameters plugged into current cloud models about longevity, warming and precipitation are wrong which mean that clouds cool more than previously thought. It doesn't,as it happens, change what we need to do but it does demonstrate that even today a fairly major part of the mechanics of climate changee can - uh hm - be changed.
New paper on clouds
https://www.carbonbrief.org/cooling-effect-of-clouds-underestimated-by-climate-models-says-new-study - There is no consensus
Bob Loblaw at 03:33 AM on 10 April, 2021Karlengle:
You may find it informative to read the American Meteorlogical Society's author information web page. They publish several highly-respected journals in various specialities in atmospheric science.
https://www.ametsoc.org/index.cfm/ams/publications/author-information/
The review process is described here:
...and what they expect from editors and reviewers is here:
A couple of Skeptical Science pages on peer review:
https://skepticalscience.com/clouds-over-peer-review.html
https://skepticalscience.com/pal-review.htm
The second of those links shows a case where "skeptic" scientists basically did what they keep accusing the mainstream scientists of doing. Another blog post on the same story can be found at ThinkProgress:
Two more examples of misbehaviour at journals:
https://www.desmogblog.com/energy-and-environment
- Increasing CO2 has little to no effect
MA Rodger at 20:32 PM on 3 April, 2021Rob Honeyutt @434,
Even though Zoe Phin's credentials are not that of a climatologist, I would suggest her work providing the basis for the 'article' presented @431 (her work is set out here) is so poor, she should approach her college and ask for her money back. Evidently her education has entirely failed.
What Zoe Phin manages to show is no more than "Look!! Lots of numbers with decimal points. So I'm right and AGW is fake!!!" Or in her own baseless words "The greenhouse effect hypothesis is simply incorrect and should be abandoned for the sake of empirical science."
The first table of numbers presented by Zoe Phin are presumably taken from CERES and shows that high, uppermid & lowermid clouds have increased through the period 2003-19 while low cloud shows no statistical trend. However I don't see any use of this data within the analysis provided.
The second and third tables (again presumably from CERES but quite where from CERES is a different matter as this is modelled data not measured data) shows annual global average values for surface upward & downward IR and TAO upward for clear-sky/all-sky and with/without areosols. These numbers are not the sort of thing that can be measured globally and further are a ridiculously good fit with GISS annual global average SAT which shows to anybody with half a brain who thought to examine them that the values are modelled numbers not measured numbers.
The extent of the analysis provided by Zoe Phin is simply to compare the 2003-19 averages of these annual global average IR numbers and declare the upward surface IR do not vary enough between clear-sky/all-sky for clouds to play any role in any greenhouse effect. Thus Zoe declares AGW must be fake.
The averaged clear-sky/all-sky TOA upward IR numbers vary by 25Wm^-2, enough to provide 20% of a theoretical +33ºC greenhouse effect, not a million miles from what would be anticipated. But the analysis dismisses the relevance of TOA IR. We are told "Less top-of-atmosphere outgoing radiation doesn’t cause surface heating." So what does less energy leaving the planet do? Where does the energy that is now failing to exit planet Earth go? These are the questions Zoe Phin needs to answer before she continues to make a total fool of herself.
- 2021 SkS Weekly Climate Change & Global Warming Digest #1
Dr. S. Jeevananda Reddy at 17:47 PM on 11 January, 2021Negelj
Global Warming: It is an estimate of the annual average part of temperature trend. The trend of 1880 to 2010 is 0.6oC per century in which global warming component is 0.3oC – 1951 to 2100 is 0.45oC – according to linear trend. But in reality it is not so as the energy component is constant over which superposed sunspot cycle. However, the reliability depends up on the data used. For example number of stations in around 1850 were < 100 and by around 1980 [started satellite data collection started around this time] they were more than 6000 and with the availability of satellite data the number of stations drastically come down to around 2500. The satellite data covered both urban-heat-island effect and rural-cold-island effect and showed practically no trend – US raw data series also showed this. However, this data was removed from internet [Reddy, 2008 – Climate Change: Myths & Realities, available on line] and replaced with new adjusted data series that matches with ground data series. Here cold-island effect is not covered. With all this, what I want say is warmings associated with solar power plants is added to global warming. How much?? This needs collection of data for all the solar power stations. Met station covers a small area only but acts like UHI effect – I saw a report “surface temperatures in downtown Sacramento at 11 a.m. June 30, 1998 – this presents high variation from area to area based on land use [met station refers to that point only]. So, solar wind power plants effect covers similar to heatwaves and coldwaves. Here general Circulation Pattern plays main role.
Nuclear Power: Nuclear power production processes contribute to “global warming process” while hydropower production processes contribute to “global cooling process”; the nuclear power production processes don’t fit into “security, safety & economy” on the one hand and on the other “environment & social” concepts; unlike other power production processes, in nuclear power production process different stages of nuclear fuel cycles are counted as separate entities while assessing the cost of power per unit and only the power production component is accounted in the estimation of cost of power per unit; carbon dioxide is released in every component of nuclear fuel cycle except the actual fusion in the reactor. Fossil fuels are involved in the mining-transport-milling conversion-processing of ore-enrichment of the fuel, in the handling of the mill tailings-in the fuel can preparation-in the construction of plant and it decommissioning-demolition, in the handling of the spent waste-in its processing and vitrification and in digging the hole in rock for its deposition, etc. and in the manufacturing of necessary required equipment in all these stages and thus their transportation. In all these stages radiological and non-radiological pollution occurs – in the case of tail pond it runs in to hundreds of years. Around 60% of the power plant cost goes towards the equipment, most of which is to be imported. The spent fuel storage is a critical issue, yet no solution was found. Also the life of reactors is very short and the dismantling of such reactors is costly & risky, etc., etc.
Michael Sweet/ Negelj
In 70&80s I worked and published several articles relating to radiation [global solar and net and evaporation/evapotranspiration] – referred in my book of 1993 [based on articles published in international and national journals]. Coal fired power plants reduces ground level temperature by reducing incoming solar radiation. In the case of Solar Panels create urban heat island condition and thus increases the surrounding temperature. In both the cases these changes depends upon several local conditions including general circulation patterns. Ground condition plays major role on radiation at the surface that define the surface temperature [hill stations, inland stations & coastal stations] – albedo factor varies. Also varies with soil conditions – black soil, red soil. Sea Breeze/land breeze – relates to temperature gradient [soil quickly warm up and quickly release the heat and water slowly warm up and slowly release heat] and general circulation pattern existing in that area plays the major role in advection.
Response to Moderator
See some of my publications for information only:
Reddy, S.J., (1993): Agroclimatic/Agrometeorological Techniques: As applicable to Dry-land Agriculture in Developing Countries, www.scribd.com/Google Books, 205p; Book Review appeared in Agricultural and Forest Meteorology, 67 (1994):325-327.
Reddy, S.J., (2002): Dry-land Agriculture in India: An Agroclimatological and Agrometeorological Perspective, BS Publications, Hyderabad, 429.
Reddy, S.J., (2008): Climate Change: Myths & Realities, www.scribd.com/Google Books, 176.
Reddy, S.J., (2016): Climate Change and its Impacts: Ground Realities. BS Publications, Hyderabad, 276.
Reddy, S.J., (2019a): Agroclimatic/Agrometeorological Techniques: As applicable to Dry-land Agriculture in Developing Countries [2nd Edition]. Brillion Publishing, New Delhi, 372p.
2.1.2 Water vapour
Earth’s temperature is primarily driven by energy cycle; and then by the hydrological cycle. Global solar radiation reaching the Earth’s surface and net radiation/radiation balance at the Earth’s surface is generally estimated as a function of hours of bright Sunshine. Total cloud cover [average of low, medium & high clouds] has a direct relation to hours of bright Sunshine (Reddy, 1974). Cube root of precipitation showed a direct relation to total solar radiation and net radiation (Reddy, 1987). In all these latitude plays major role (Reddy & Rao, 1973; Reddy, 1987). Evaporation presents a relation with net and global solar radiation (Reddy & Rao, 1973) wherein relative humidity plays an important role that reduces with increasing relative humidity. If ‘X’ is global solar radiation received under100% relative humidity then with the dryness [with relative humidity coming down] it may reach a maximum of 2X; and under net radiation also with increasing relative humidity net radiation is reduced. That means water vapour in the atmosphere is the principal component that controls the incoming and outgoing radiation and thus temperature at the Earth’s surface. Thar Desert presents high temperature with negligible water vapour in the atmosphere as maximum energy reaches the earth’s surface. However, these impacts differ under inland (dryness), hill (declining temperature with height – lapse rate) & coastal (wetness) locations and sun’s movement (latitude and declination of the Sun — seasons) (Reddy & Rao, 1973). IPCC integrated these under “climate system” and the advective condition by general circulation pattern [GCP].
Cold-island effect [I coined this, see Reddy (2008)] is part of human induced climate change associated with changes in land use and land cover. Since 1960’s to meet the food needs of ever increasing population, started intensive agriculture – conversion of dryland to wetland; & creation of water resources; etc. In this process increased levels of evaporation and evapotranspiration contributed to raise in water vapour up to around 850 mb levels in the lower atmosphere. Unusual changes in water vapour beyond 850 mb level [for example at 700 mb level] become a cause for thunderstorm activity (Reddy & Rao, 1978). Wet bulb temperature (oC) at the surface of the Earth provides the square root of total water vapour (g/cm2) in the vertical column of the atmosphere; and also wet bulb temperature (oC) is a function of dry bulb temperature (oC), relative humidity (%) and square root of station level pressure (height) relative to standard value in mb [p/1060] (Reddy, 1976). Thus, unlike CO2, water vapour presents a short life with steadily increasing with land use and land cover changes. However, met network in this zones have been sparse and thus the cold island effect is not properly accounted under global average temperature computations. Though satellite data takes this in to account, this data series were withdrawn from the internet and introduced new adjusted data series that matches with adjusted ground data series. Annual state-wise temperature data series in India wherein intensive agriculture practices are existing, namely Punjab, Haryana & UP belt, showed decreasing trend in annual average temperature – cooling. Some of these are explained below:
Reddy (1983) presented a daily soil water balance model that computes daily evapotranspiration, known as ICSWAB Model. The daily soil water balance equation is generally written as:
▲Mn = Rn – AEn – ROn - Dn
In the above equation left to right represent the soil moisture change, rainfall or irrigation, actual evapotranspiration, surface runoff and deep drainage on a given day (n). The term Actual Evapotranspiration [AEn] is to be estimated as a function of f(E), f(S) & f(C), wherein they represent functions of evaporative demand on day n, soil & crop factors, respectively. As these three factors are mutually interactive, the multiplicative type of function is used.
AEn = f(En) x f(S) x f(C)
However, the crop factor does not act independently of the soil factor. Thus it is given as:
AEn = f(En) x f(S,C) and f(S,C) = K x bn
Where f(S,C) is the effective soil factor, K = soil water holding capacity [that varies with soil type] in mm and bn is the crop growth stage [that vary with crop & cropping pattern] factor that varies between 0.02 to 0.24 — fallow to full crop cover conditions (with leaf area index crossing 2.75). Evaporative demand is expressed by the terms evaporation and/or evapotranspiration. Evaporation (E) and evapotranspiration (PE) are related as:
PE = 0.85 x E [with mesh cover] or = 0.75 x E [without mesh cover].
However, the relationship holds good only under non-advective conditions [i.e., under wind speeds less than 2.5 m/sec]. Under advective conditions E is influenced more by advection compared to PE. In the case of PE, by definition, no soil evaporation takes place and thus PE relates to transpiration only – where the crop grows on conserved soil moisture with negligible soil evaporation. With the presence of soil evaporation, the potential evapotranspiration reaches as high as 1.2 x PE or E with mesh cover. McKenney & Rosenberg (1993) studied sensitivity of some potential evapotranspiration estimation methods to climate change. The widely used methods are Thornthwaite and Penman presented 750 mm and 1500 mm wherein Thornthwaite method is basically uses temperature and Penman uses several meteorological parameters (Reddy, 1995).
In this process the temperature is controlled by solar energy but moisture under different soil types [water holding capacity] it is modified. This modified temperature cause actual evapotranspiration and thus water vapour. This is a vicious circle. For example average annual temperature in red soils Anantapur it is 27.6oC; in deep black soils Kadapa it is 29.25oC & in medium soils Kurnool it is 28.05oC. That means, local temperature is controlled by soils.
Reddy (1976a&b) presented a method of estimating precipitable water in the entire column of the atmosphere at a given location using Wet Bulb Temperature. The equations are given as follows:
Tw = T x [0.45 + 0.006 x h x (p/1060)1/2]
W = c’ x Tw2
Where T & Tw are dry and wet bulb temperatures in oC; h is the relative humidity in %; p is the annual normal station level pressure in mb [1060 normal pressure in mb, a constant] ; W is the precipitable water vapour in gm/cm2 and c’ is the regression coefficient.
WMO (1966) presented methods to separate trend from natural rhythmic variations in rainfall and assessing the cycles if any. (Late) Dr. B. Parthasarathy from IITM/Pune used these techniques in Indian rainfall analysis. Reddy (2008) presented such analysis with global average annual temperature anomaly data series of 1880 to 2010 and found the natural cycle of 60-years varying between -0.3 to +0.3oC & trend of 0.6oC per century [Reddy, 2008]. This is based on adjusted data series but in USA raw data [Reddy, 2016] there is no trend. The hottest daily temperature data series of Sydney in Australia shows no trend [Reddy, 2019a]. Thus, the trend needs correction if the starting and ending point parts are in the same phase of the cycle – below and below or above and above the average parts. During 1880 to 2010 period two full 60-year cycles are covered and thus, no need to correct the trend as the trend passes through the mean points of the two cycles.
3.2.4 What is global warming part of the trend?
According to IPCC AR5, this trend of 0.6oC per century is not global warming but it consists of several factors:
a. More than half is [human induced] greenhouse effect part:
i. It consists of global warming component & aerosols component, etc. If we assume global warming component alone is 50% of the total trend, then it will be 0.3oC per Century under linear trend;
ii. Global warming starting year is 1951 & thus the global warming from 1951 to 2100 [150 years] is 0.45oC under linear trend;
iii. But in nature this can’t be linear as the energy is constant and thus CSF can’t be a constant but it should be decreasing non-linearly;
iv. Under non-linear condition by 2100 the global warming will be far less than 0.45oC and thus the trend will be far less than half;
b. Less than half the trend is ecological changes [land use and land cover change] part – mostly local & regional factors:
i. This consists of urban-heat-island effect and rural-cold-island effect;
1. Urban-heat-island effect – with the concentrated met network overestimates warming;
2. Rural-cold-island effect – with the sparse met network underestimates cooling;
2.2.1 Uncertainty on “Climate Sensitivity Factor”
The word “climate Crisis” is primarily linked to global warming. To know whether there is really global warming, if so how much, climate sensitivity factor plays the main role. Climate sensitivity is a measure [oC/(W/m2)] – how much warming we expect (both near-term and long-term) for a given increase in CO2? According to Mark, D. Zilinka (2020), “Equilibrium climate sensitivity, the global surface temperature response to the CO2 doubling, has been persistently uncertain”.
Recent modelling data suggests the climate is considerably more sensitive to carbon emissions than previously believed, and experts said the projections had the potential to be “incredibly alarming”, though they stressed further research would be needed to validate the new numbers. Johan Rockström, the director of the Potsdam Institute for Climate Impact Research, said. “Climate sensitivity is the holy grail of climate science. It is the prime indicator of climate risk.
The role of clouds is one of the most uncertain areas in climate science because they are hard to measure and, depending on altitude, droplet temperature and other factors can play either a warming or a cooling role. For decades, this has been the focus of fierce academic disputes. Catherine Senior, head of understanding climate change at the Met Office Hadley Centre, said more studies and more data are needed to fully understand the role of clouds and aerosols. With this vital disputes how anyone can say there is global warming without solving this issue; so I said “global warming hysteria factor is climate crisis”.
- How much has nuclear testing contributed to global warming?
boston745 at 18:02 PM on 27 October, 2020You failed to address a single observation Ive made. You completely dismiss qualified scientists who disagree with the mainstream. And you put your faith in climate models that do not factor in things like clouds nor weakening magnetosphere. I'm sorry but it doesn't seem like you're after honest dialog.
Atmospheric scientists have learned a great deal in the past many decades about how clouds form and move in Earth's atmospheric circulation. Investigators now realize that traditional computer models of global climate have taken a rather simple view of clouds and their effects, partly because detailed global descriptions of clouds have been lacking, and partly because in the past the focus has been on short-term regional weather prediction rather than on long-term global climate prediction. To address today's concerns, we need to accumulate and analyze more and better data to improve our understanding of cloud processes and to increase the accuracy of our weather and climate models.
More than 100 comments found. Only the most recent 100 have been displayed.
More than 100 comments found. Only the most recent 100 have been displayed.


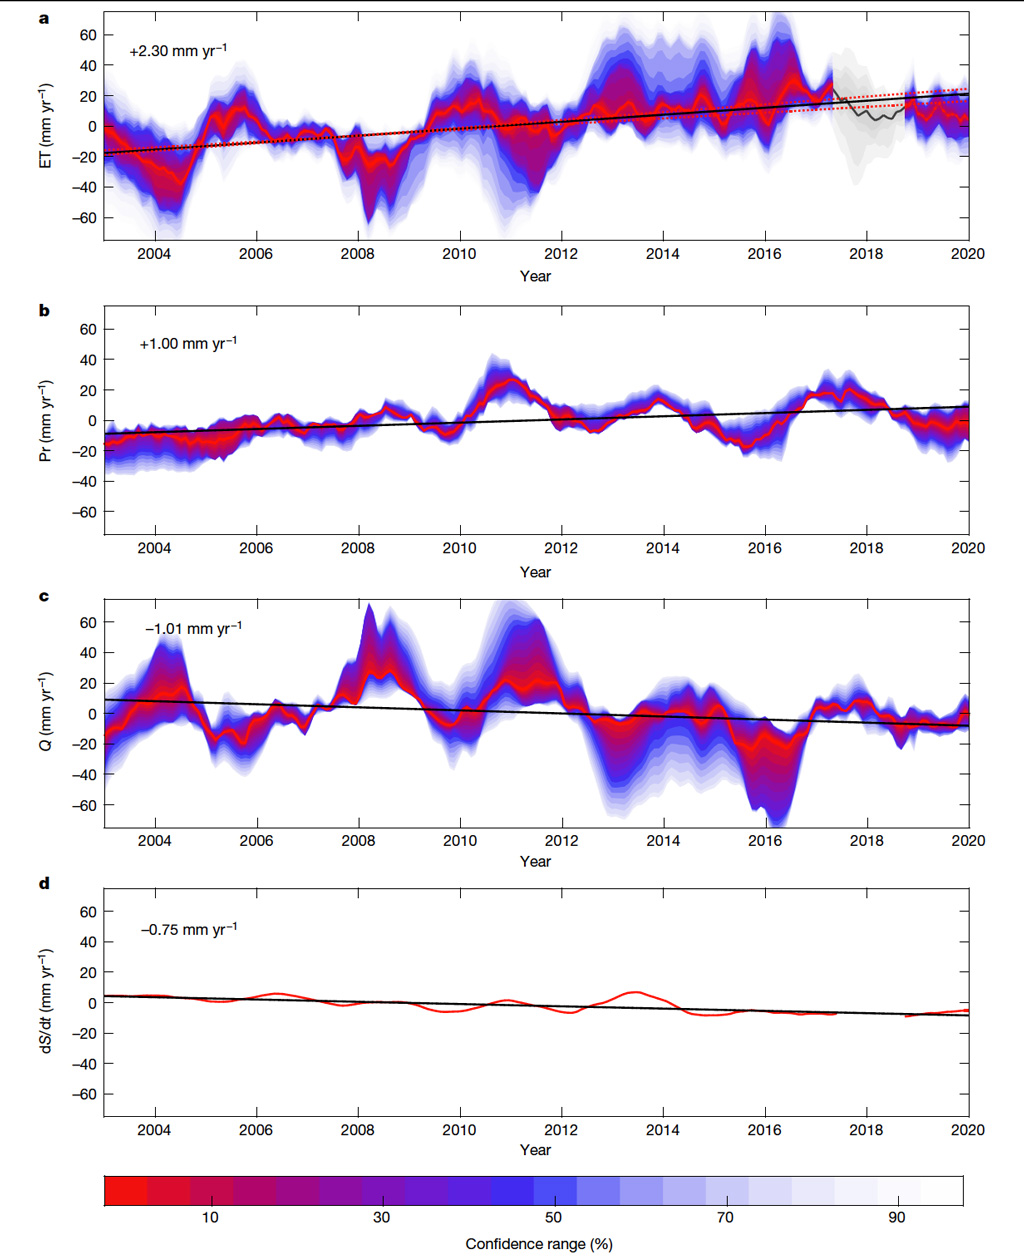
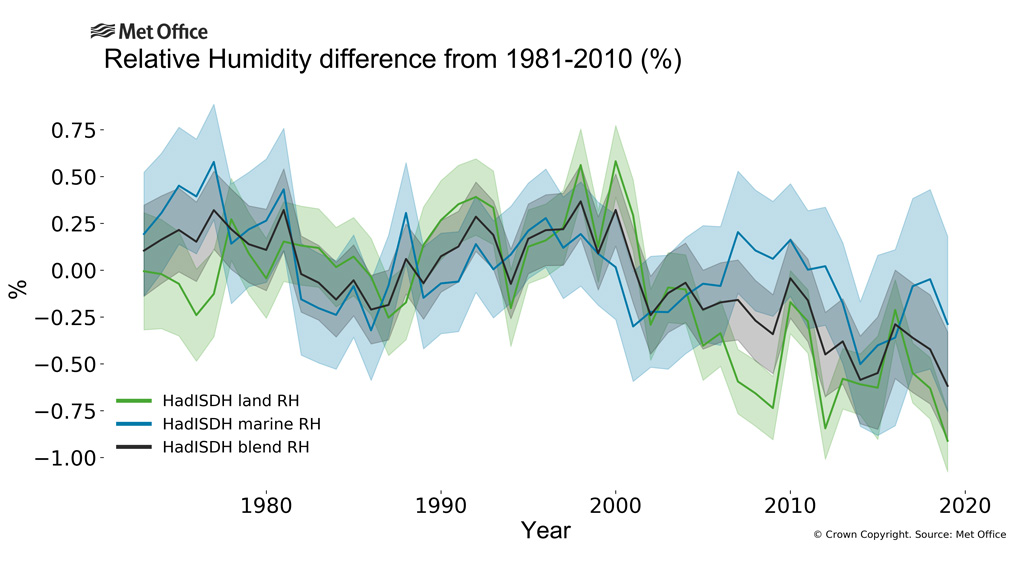
THE ESCALATOR

(free to republish)