


 Arguments
Software
Resources
Comments
The Consensus Project
Translations
About
Support
Arguments
Software
Resources
Comments
The Consensus Project
Translations
About
Support
![]()
![]()
![]()
![]()
![]()
![]()
![]()
![]()
![]()
![]()


![]()


Latest Posts
- Skeptical Science New Research for Week #30 2024
- Why were the 1930s so hot in North America?
- Why is the Texas grid in such bad shape?
- A major milestone: Global climate pollution may have just peaked
- 2024 SkS Weekly Climate Change & Global Warming News Roundup #29
- Skeptical Science New Research for Week #29 2024
- June 2024: Earth’s 13th-consecutive warmest month on record
- Plugging a video channel: Dr Gilbz
- Can we air condition our way out of extreme heat?
- 2024 SkS Weekly Climate Change & Global Warming News Roundup #28
- Fact brief - Were scientists caught falsifying data in the hacked emails incident dubbed 'climategate'?
- Skeptical Science New Research for Week #28 2024
- The world’s fourth mass coral bleaching is underway, but well-connected reefs may have a better chance to recover
- How rural families are saving thousands with electric vehicles
- What’s next after Supreme Court curbs regulatory power: More focus on laws’ wording, less on their goals
- 2024 SkS Weekly Climate Change & Global Warming News Roundup #27
- Skeptical Science New Research for Week #27 2024
- How much will climate change drag down the economy?
- Rebuttal Update Project - Summer break and relaxed publication schedule
- Climate Adam: How deadly heatwaves are blown up by climate change
- 2024 SkS Weekly Climate Change & Global Warming News Roundup #26
- Fact Brief - Does temperature have to rise before CO2 does?
- Translation #20 of The Conspiracy Theory Handbook published!
- Skeptical Science New Research for Week #26 2024
- Six incredibly popular climate policies
- At a glance - What caused early 20th Century warming?
- What record global heat means for breaching the 1.5C warming limit
- 2024 SkS Weekly Climate Change & Global Warming News Roundup #25
- Fact Brief - Was the Medieval Warm Period a global event?
- Skeptical Science New Research for Week #25 2024
Comment Search Results
Search for Predictions_150
Comments matching the search Predictions_150:
- 2022 SkS Weekly Climate Change & Global Warming News Roundup #42
scaddenp at 06:28 AM on 1 November, 2022Also see the "Lessons from Past Predictions" series which compares predictions made by scientists to how it has panned out. I would say you are listening to peddlars of strawman fallacies because you like what they say instead of reading what the science actually says.
- CO2 effect is saturated
David Kirtley at 03:34 AM on 12 January, 2019LTO @501: "i thought it might be useful to go back and look at past predictions to see how they measure up against present day."
You can easily do that right here on SkS. Scroll up to the "thermometer" in the left-side banner. Under that are some rectangular "buttons". Click on the "Lessons from Predictions" button. That will take you to a page listing blog posts dealing with past predictions/projections and how they have measured up.
- Republicans' favorite climate chart has some serious problems
Tom Curtis at 16:15 PM on 22 February, 2016FrankShann @various, CMIP5 uses historical data to 2005 inclusive, but scenario data thereafter. The equivalent model experiments for the IPCC TAR and AR4 used historical data to 2000, and scenario data thereafter. I am not aware of the dates for the FAR and SAR, but clearly they predated the reports themselves (1990 and 1995 respectively). Hansen 88 used historical data only up to 1983 (from memory).
This is important because Dana wrote:
"Climate models are certainly useful, and are doing a pretty darn good job predicting global warming. Their predictions have been far more accurate than those made by climate contrarians, who keep telling us that the Earth will start to cool any day now, as we keep breaking heat records."
In doing so he links to an article discussing the predictions of all five IPCC reports, plus other 'warmist' predictions, along with those few predictions made by AGW 'skeptics'. He was not referring to just CMIP5 predictions as you suppose, and all of the predictions include several years after the last historical forcing data, including CMIP5.
The article summarizes some of the results from a number of articles discussing the predictions of just one individual or organization in any article. The results of the comparisons are summarized in this graph:
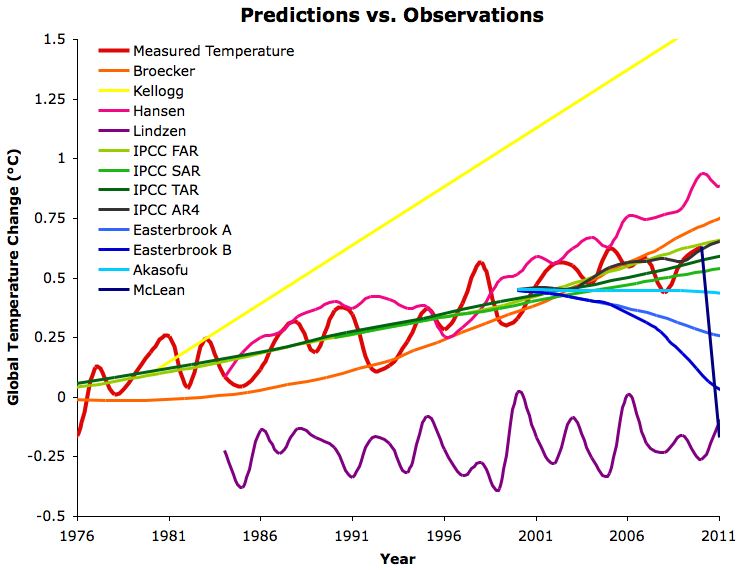
So, leaving aside all the technical points about predictions and retrodictions, and predictions and projections; your criticism of Dana is wrong. The worst that can be said of his claim is that it is fleshed out in this article, but another. That, however, is a necessity of communication. Even in the world of the internet, there is still no royal path to knowledge. And links are not just decorations.
And for what it is worth, the HadCRUT4 trend since 2005 is 0.127 +/- 0.22 C/decade, compared to a CMIP5 prediction of about 0.2 C/decade. As the difference between scenarios is inconsequential over that time period, the distinction between projection and prediction is nugatory. Ergo, the CMIP5 prediction still fairs fairly well, and certainly outperforms any 'skeptical' prediction over the same period.
- IPCC overestimate temperature rise
KR at 02:30 AM on 14 November, 2014bcglrofindel - I had forgotten about that earlier FAR specific post; SkS really contains a lot of information. If you're interested in other predictions that have been examined here, the Lessons from Predictions button in the left margin is quite useful.
I'm afraid that much of the strength of the reaction to your questions was based on past experiences - I cannot count how many times someone has commented here and on other climate blogs claiming despite the evidence that mismatches between specific projections and observed temperatures somehow invalidate all climate modeling, despite the projected emissions not matching actuals. The pattern for those 'skeptics' is one of starting out with what sems like a reasonable question, then not accepting the explanations, degenerating into denial, libertarian fantasies, and conspiracy theories while asserting counterfactuals, before their politeness finally expires and moderation kicks in. But it's difficult to distinguish between such people and the genuinely curious early in the exchange.
Note to everyone - As bcglrofindel points out, such a strong reaction can be quite offputting. Save the sarcasm for people who have demonstrated the need for heavy implements in clue delivery.
- IPCC overestimate temperature rise
KR at 05:21 AM on 13 November, 2014bcglrofindel - If you recall, I gave you a graph of temperatures vs. projections earlier in the thread, including the 1990 FAR. More specifically in the collection of SkS threads examining past projections is a direct FAR comparison here:

Far more relevant are FAR models using actual greenhouse emissions to present (which didn't exactly match any of the scenarios), as the various scenarios were just that, scenarios, not looking-glass prophetic visions of future economies:

The FAR models were quite simple - but all in all did a reasonable job.
In short: The FAR projections were not exact matches to observed history, but the models they used appear to be in the right range for predicting trends vs. GHG emissions.
I believe that is a sufficient response for the naysayers.
- IPCC overestimate temperature rise
dana1981 at 13:09 PM on 29 September, 2012
Tom - if you're specifically looking for comparisons between model temperature projections vs. observations (including by the IPCC), see the Lessons from Past Predictions series.
As a general rule, if you see colorful easy-to-understand graphs on WUWT, you can bet the folks creating that graph have screwed up somehow. Evans for example cherrypicks data horribly, comparing surface temperature projections to atmospheric temperature measurements, and only looks at a few years of ocean heat content, and only of the shallow oceans, etc. etc. - Models are unreliable
Bob Loblaw at 14:22 PM on 30 May, 2012
Clyde: you said "I know enough to understand a failed prediction. Do you want me to post the links to the failed predictions/projections?
Please do so, but keep in mind that here at SkS you will be expected to back your position up with references to real scientific literature (not just blog posts). Before you start to post your own stuff, though, you may want to review the series of posts found using the Lessons from Predictions search item. There is a button that will do this search for you near the top left of the SkS page (just above "Most Used Climate Myths"). - 2011 Sea Ice Minimum
Dikran Marsupial at 23:44 PM on 30 September, 2011
I thought today would be a good day to make a statistical prediction of September 2011 sea ice extent ;o)
I obtained from data for Arctic sea ice extent from 1979-2009 (the NSIDC data archive appears to be down at the moment, that was the best I could find). I then fitted a Gaussian process model, using the excellent MATLAB Gaussian Processes for Machine Learning toolbox (the book is jolly good as well). I experimented with some basic covariance functions, and chose the squared exponential, as that gave the lowest negative log marginal likelihood (NLML). The hyper-parameters were tuned by minimising the NLML in the usual way.
Here is a pretty picture:

Note the credible interval gets wider the further you extrapolate from the data, which is a nice feature of Bayesian models. Other highlights include:
prediction for 2010 = 4.927226 (+/- 1.069078)
prediction for 2011 = 4.772309 (+/- 1.096537)
prediction for 2012 = 4.614637 (+/- 1.128915)
ice free summer unlikely prior to 2027
ice free summer probably after 2041
I haven't checked to see how accurate the first two "predictions" actually are. This isn't really a serious attempt at a prediction, I just wanted to try out the regression tools in the GPML toolbox, but when I can get some up-to-date data, I can update the projections for 2012 and onwards. Hopefully I won't end up being the subject of a lessons from predictions post. ;o)
Caveat lector: This is a purely statistical prediction, so it is less reliable than physics, but hopefully better than chimps & buckets.


THE ESCALATOR

(free to republish)