


 Arguments


Global solar capacity grew faster than fossil fuels in 2017, says report
Posted on 17 May 2018 by Guest Author
This is a re-post from Carbon Brief by Simon Evans
For the first time, in 2017, global solar capacity grew faster than all fossil fuels combined, including coal, oil and gas-fired power stations.
That’s one finding of the latest annual report on global trends in renewable energy finance, from the UN Environment Programme (UNEP) and Bloomberg New Energy Finance (BNEF).
It shows renewables, excluding large hydro, made up three-fifths of net power capacity growth in 2017 and supplied a record 12% share of global electricity generation.
Global renewable investment held steady, with falling costs ensuring the same money bought record levels of new capacity. Within that, developing nations, led by China, claimed an ever-larger share of the total as investment fell steeply in several European countries.
Solar record
One of the most striking findings in today’s report is that global solar capacity grew faster in 2017 than the combined total for all fossil fuels – coal, oil, gas – as the chart below shows.
Note that this chart shows net capacity growth, after accounting for power plants that have retired. This is particularly significant for coal, where 32 gigawatts (GW) closed in 2017 and for gas, which lost 16GW.
Global growth in net electricity generating capacity, gigawatts, after subtracting retirements from new additions. Global net nuclear capacity shrank during 2010-2012. Fossil fuels includes coal, oil and gas. Other renewables includes biomass, geothermal, waste-to-energy and small hydro below 50 megawatts capacity. Source: UNEP/BNEF Global Trends in Renewable Energy Finance reports 2010-2018, International Atomic Energy Agency PRIS database and Carbon Brief analysis. Note that the figures reported in each year’s ‘Global Trends’ report are preliminary. Carbon Brief will update this chart if final figures become available. Chart by Carbon Brief using Highcharts.
The milestone reflects rising investment and falling costs for solar (see below for more on this). Significantly, it also reflects the decline in the growth of new coal and gas capacity, as well as an increase in retirements.
The global pipeline of new coal-fired power stations is shrinking fast and ageing plants in the US and Europe are closing down. The outlook for new gas-fired power stations is also fading, according to the world’s largest gas turbine manufacturers.
The record 98 gigawatts (GW) of new solar built in 2017 increased the world’s cumulative capacity by a third, to 399GW. Solar capacity also grew by a third in 2016 – and the amount added in the last year alone was larger than all the solar ever built before 2013.
Even the International Energy Agency (IEA), which has long been seen as downplayingthe growth potential for renewables, expects global solar capacity to reach 740GW by 2022. Others say solar growth is still consistently underestimated.
Rising share
The shift in global additions means that renewables, excluding large hydro, made up 61% of the growth in power generating capacity last year, a record high, shown in the chart, below.
(The “Global Trends” reports focus on investment in wind, solar, small hydro, biomass, geothermal and waste-to-energy projects. These are the newer forms of renewable energy, whereas large hydro has been in use for many decades.)
The grey line in the chart show the share of global power capacity which is renewable, excluding large hydro, while the blue line shows the contribution to electricity generation.
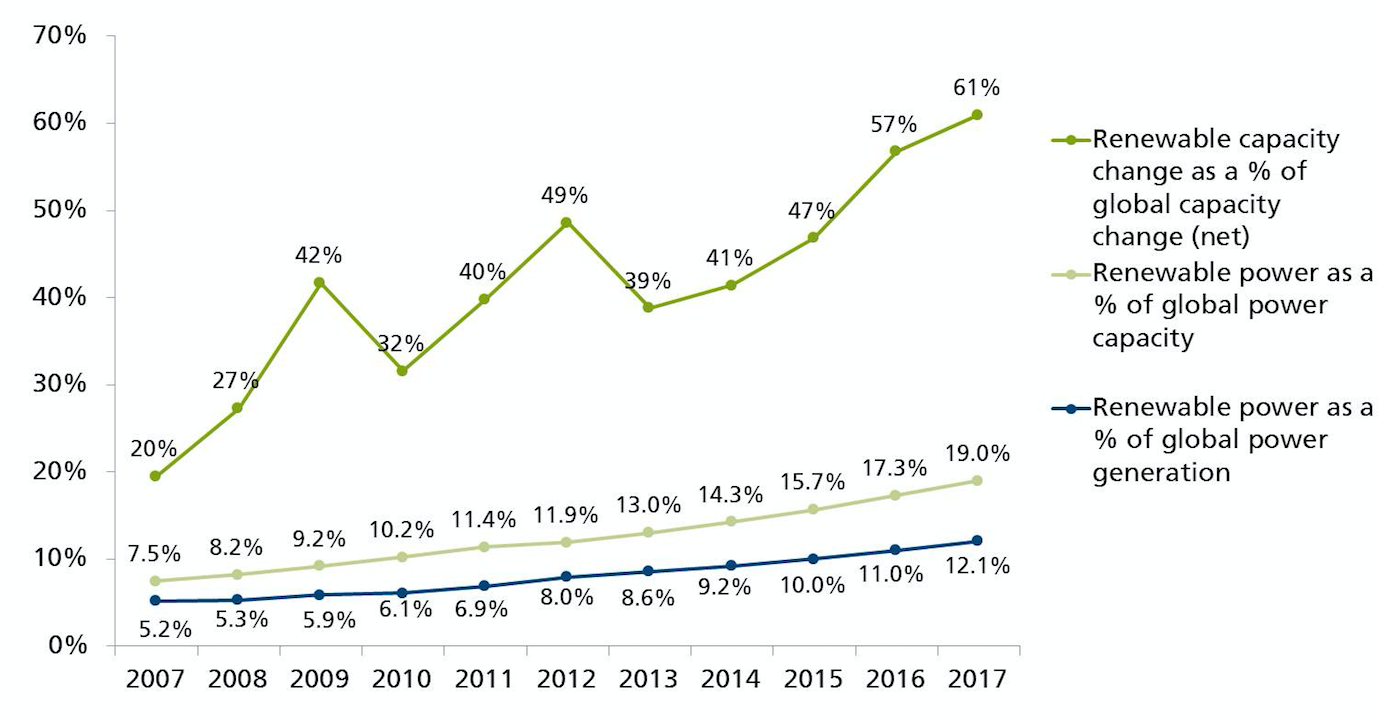
Renewable power generation (blue) and capacity (green) as a share of the global total, 2007-2017, %. Renewables excludes large hydro. Source: UNEP/BNEF Global Trends in Renewable Energy Finance 2018.
Despite contributing the majority of new capacity added in 2017, renewables, excluding large hydro, still only supplied 12% of global electricity generation – itself a record contribution that has doubled since 2010. This is because wind and solar have lower load factors than coal, gas or nuclear power plants, meaning each gigawatt of renewables generates less electricity each year.
(It’s worth noting that coal-fired power stations in the world’s largest users, from Indiato China to the US, currently generate less than 60% of the time. This is comparable to offshore windfarms, with load factors of 40-60%, though coal plants can operate on demand. Offshore windfarms generate electricity during 90-100% of hours but only occasionally reach maximum output.)
In order to reach internationally-agreed climate goals, low-carbon sources will need to supply much larger shares of the global electricity mix, with unabated coal generation falling to zero by 2045.
Falling costs
The rise of new renewable capacity is largely down to solar growth, as the first chart showed. This, in turn, is due to rapidly falling costs. Between 2009 and 2017, the global average cost of generating a megawatt hour (MWh) of electricity from solar fell by 72%, as the chart below shows. Onshore wind has also seen significant declines, of 27% over the same period.
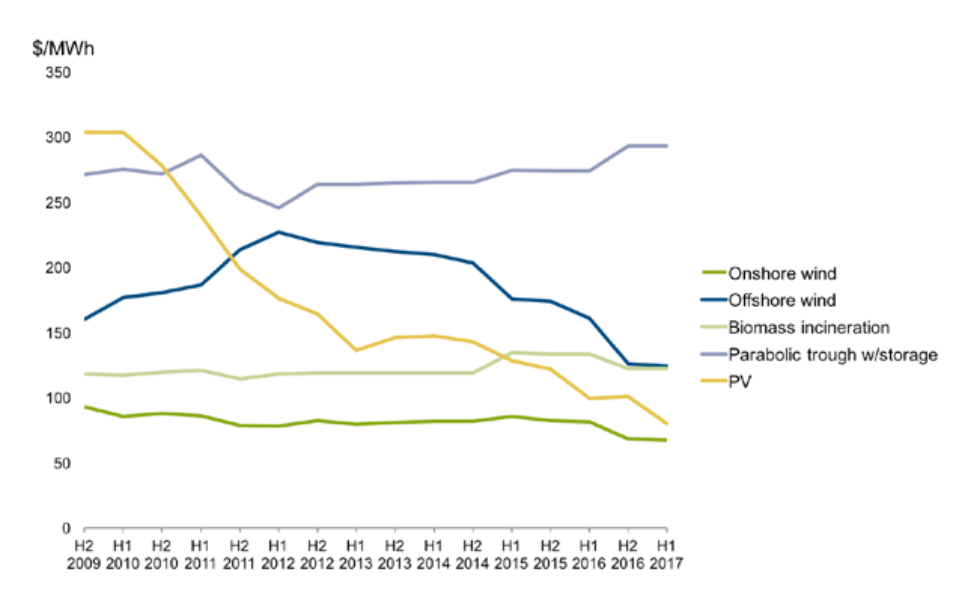
Levelised cost of electricity, by renewable technology, 2007-2017, $ per megawatt hour. Source: UNEP/BNEF Global Trends in Renewable Energy Finance 2018.
These cost reductions are continuing: the latest figures from BNEF suggest onshore wind and solar costs fell a further 18% in the first part of 2018. Publishing those numbers late last month, BNEF head of energy economics Elena Giannakopoulou said:
“Some existing coal and gas power stations, with sunk capital costs, will continue to have a role for many years, doing a combination of bulk generation and balancing, as wind and solar penetration increase. But the economic case for building new coal and gas capacity is crumbling, as batteries start to encroach on the flexibility and peaking revenues enjoyed by fossil fuel plants.”
In a growing number of countries, new wind and solar capacity is competitive with new fossil fuel plants on cost. A second tipping point is fast approaching, BNEF says, where it will be cheaper to build new wind and solar than to pay the ongoing cost of running old coal and gas capacity.
Record growth
Cheaper renewables means the world was able to install a record 157GW of new capacity in 2017, excluding large hydro. This 14% year-on-year increase was possible even though investment in the sector only grew by 2%, to $280bn, as the chart below shows.
This total remains well below the record $323bn invested in 2016, however.
(The chart breaks down investments according to the source and type of finance, including research and development spending, venture capital and private equity, small distributed capacity such as off-grid or rooftop solar, as well as asset finance.)
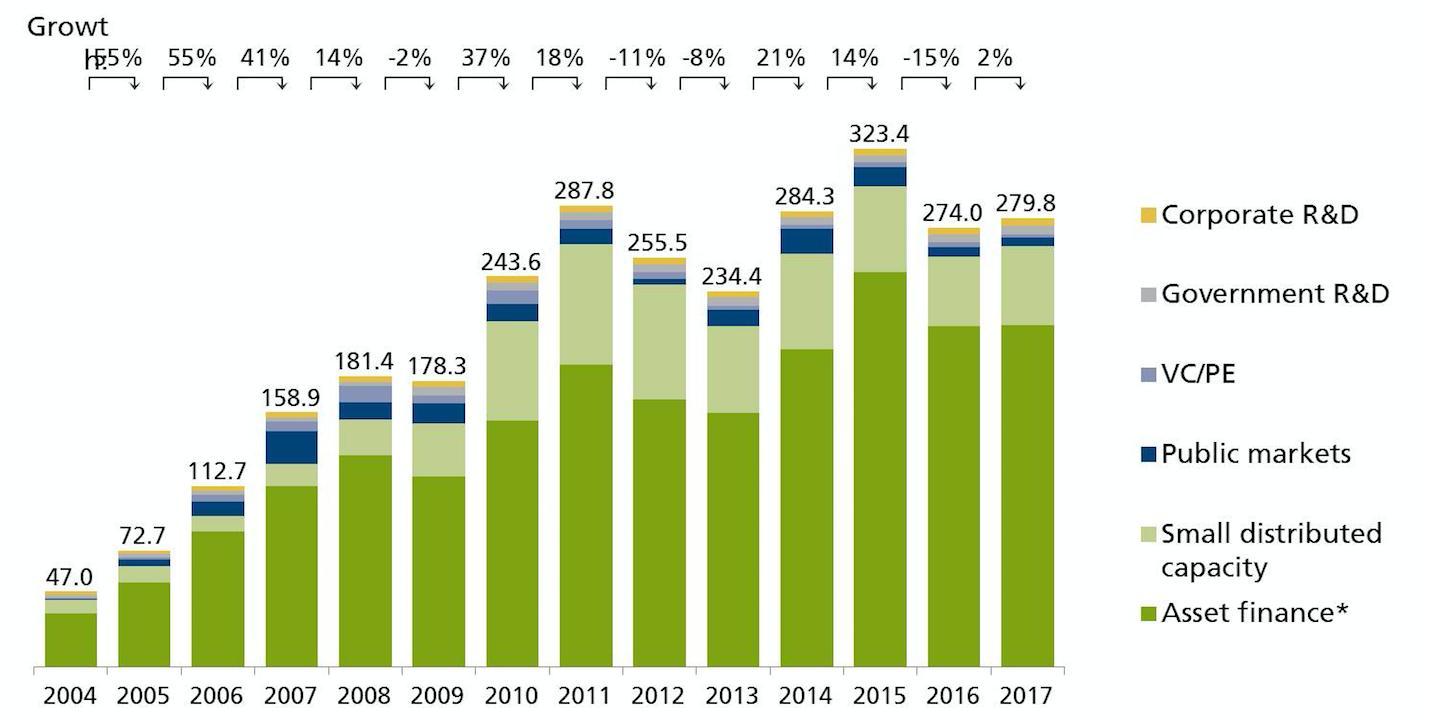
Global investment in renewable energy by asset type, 2004-2017, $bn. Year-on-year growth is shown above the chart. Source: UNEP/BNEF Global Trends in Renewable Energy Finance 2018.
In 2011, when investment levels were roughly the same as in 2017, the world installed 82GW of new renewable capacity, excluding large hydro. In other words, the cost of a new GW, averaged across all renewable technologies, has halved in six years. This is due to falling costs for each technology, as well as the shift in focus towards solar.
China story
The early growth in solar was driven by major EU economies, markets that quickly dried up as government subsidies were cut and reformed. Now, China is the engine of solar growth, installing more than half of all new capacity last year.
This shift is reflected in the trends in overall renewable investment around the world, shown in the map, below. China now accounts for 45% of renewable energy investment, excluding large hydro, spending a record $127bn in 2017. This makes it the world leaderin clean energy investment.
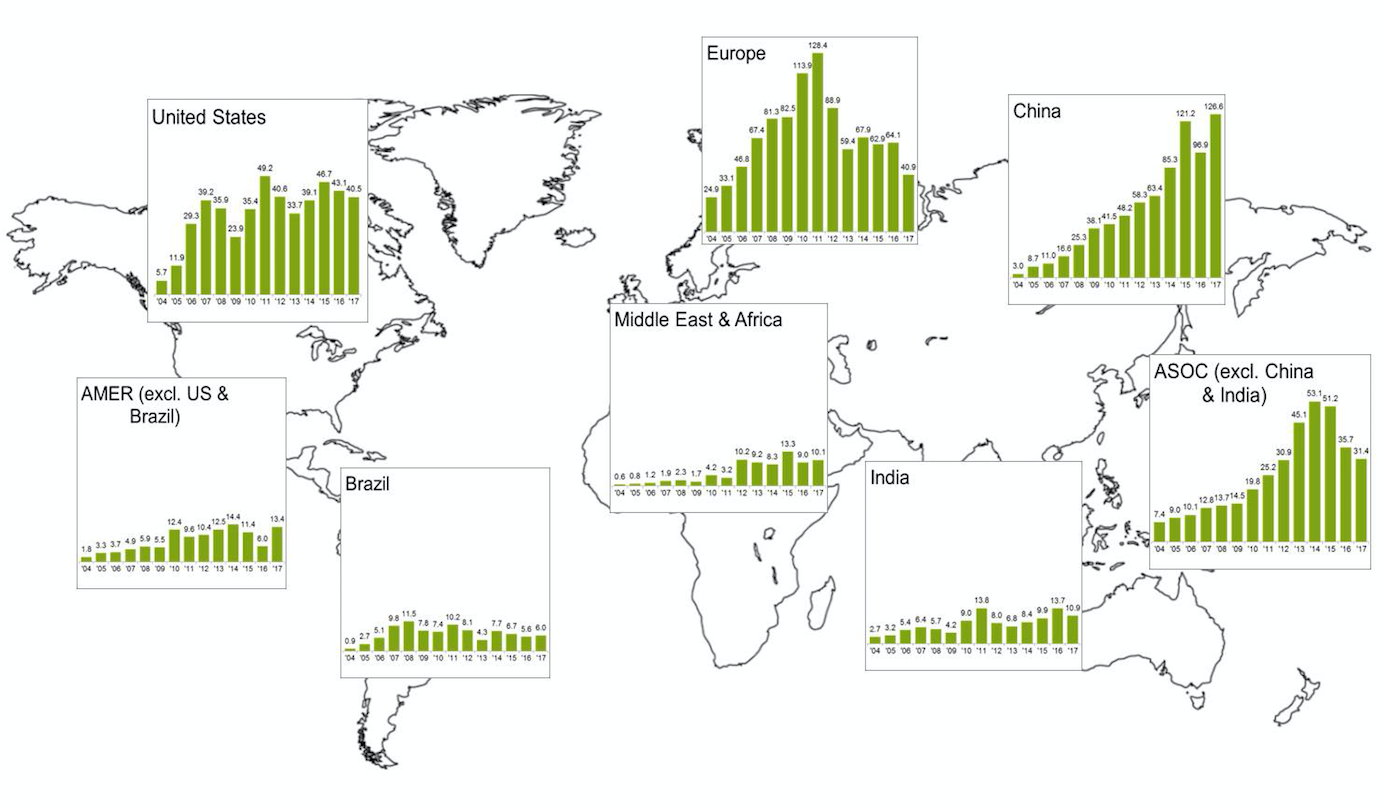
Global investment in renewable energy by region, 2004-2017, $bn. Source: UNEP/BNEF Global Trends in Renewable Energy Finance 2018.
In contrast, European investment peaked in 2011, when it accounted for 45% of the global total, before halving in the years that followed. It fell a further 36% last year, to $41bn – the lowest level in records going back to 2004.
Within this regional total, the largest fall was in the UK, where investment fell 65% to $7.6bn after the window closed on government subsidies for large-scale onshore wind and solar. Despite its far smaller population, Australia invested more than the UK in 2017, at $8.5bn.
There was also a large 35% fall in German renewable energy investment, to $10.4bn. This total is now lower than investment in India, which stood at $10.9bn in 2017, despite a 20% decline. However, a planned tariff on imported solar modules means Indian investment is expected to stall in the short term – although this will need to be temporary if their ambitious renewable energy targets are to be met.
Balance of power
For the first time in 2017, renewable energy investment in China, India and Brazil was larger, at $144bn, than the $103bn spent by all developed nations combined. You can see this in the chart below.
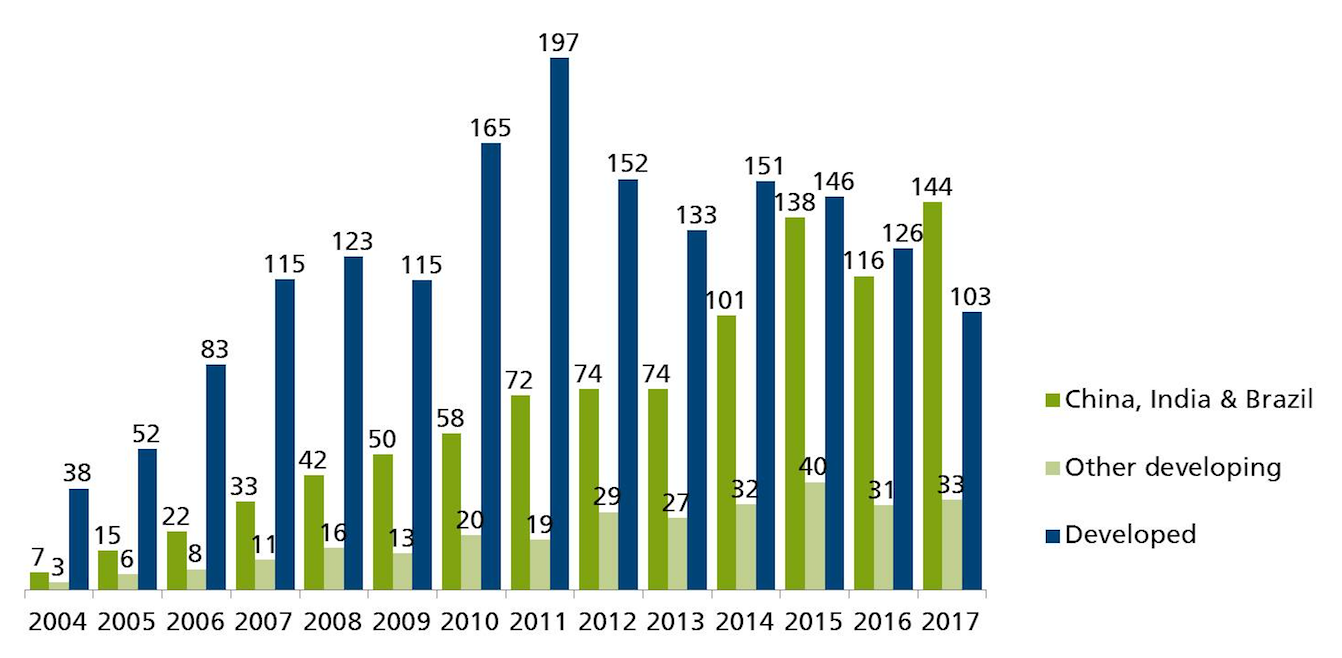
Global investment in renewable energy by type of economy, 2004-2017, $bn. Source: UNEP/BNEF Global Trends in Renewable Energy Finance 2018.
In total, developing nations increased investment by 20% compared to a year earlier, to $177bn. In contrast, developed nation investment fell 19%.
As Carbon Brief analysis shows last year, developing nations are driving the explosion in solar power. Indeed, the IEA argues that renewables, particularly solar, will help more people to gain access to electricity for the first time than coal, thanks to rapidly falling costs.
New models
The way renewable energy projects get built is also changing, as costs come down and subsidies dry up. One increasingly popular route is for governments to hold auctions for renewable capacity. This accounted for a record 51GW last year, as the chart below shows.
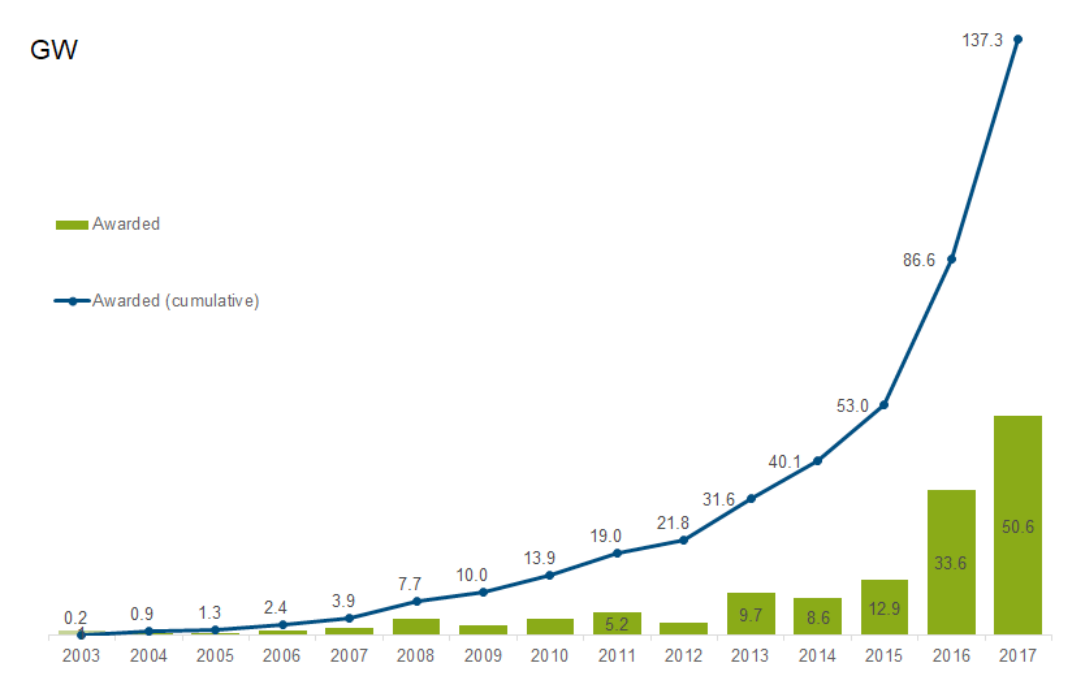
Global auctioned renewable energy capacity, 2003-2017, gigawatts. Source: UNEP/BNEF Global Trends in Renewable Energy Finance 2018.
Today’s report also lists a record 5GW of new renewables bought via power purchase agreements (PPAs), where large corporates agree to buy fixed amounts of electricity for a set number of years at a guaranteed price. PPAs are seen as one way to bring subsidy-free renewables to market, though they currently account for only a small share of deals.


This related article is interesting: "Plunging costs make solar, wind and battery storage cheaper than coal"
Briefly the article is about solar, wind and battery storage provided as a package to replace single aging coal fired power stations in Colorado State America. The total package costs are cheaper than coal and the package solves the intermittency problems by using storage.
It would seem to be a viable system that has affordable storage, so I'm mystified why people claim such things aren't possible yet. I'm not sure how the economics stand up if its scaled up or if theres some "fishook" in the scheme, but none are obvious in the text.
Nige if you have discovered the holy grail of cheap energy why don't you avail yourself of it and give us a post about all the money you are saving? What? you don't have the heavy upfront capital to get in the cheap energy game....how then is that affordable? Somebody is telling tales here.
[DB] Intimations of impropriety are proscribed by the Comments Policy here.
R murphy, the costs in the article I posted for renewable enery plus storage are claimed to be more affordable than coal. Therefore the upfront capital is less than required for coal.
Where is your fact based, verifiable evidence that the claims are false? So far you haven't provided anything apart from stupid comments.
[DB] Keep it clean
R Murphy, it appears you may be mistaking the package for a home instillation which would need a lot of capital. I said its specifically to replace old coal fired power stations due for replacement, as did the article. So obviously it doesnt require more capital than for a new coal fired power station.
As long as FF total consumption is still climbing (as 1st chart shows), and hasn't dropped into 'negative' territory, then it is hard to get excited (hopeful) at all. ... In addition, this article is only about electricity; I would guess that, if looking at total energy consumption, that % of net gain of renewables compared to FF is less than given here; and that the increase of FF consumption is proportionally more so compared to electricity only energy.
Until macro-based economic policies get installed (the most effective being 100% rev-neutral CFD w/ a steep tax rate), the chances of avoiding an ever continuous climb in temperatures is hopeless, affirmed w/ news like this showing FF consumption only continuing to increase.
Actual generation is a better metric than capacity or investment, since coal and gas usually have higher capacity factors than wind and solar, and lower installation costs.
John ONeil,
Actual generation is shown in the second graph of the OP. Last year renewables (excluding hydro) generated 12.1% of global electricity. Renewables generated only 6.1% in 2010 so the amount of renewables has doubled in the past 7 years.
Renewables have only been cheaper than fossil fuels for less than 7 years so one would expect renewables to obtain market share faster in the future since they are the cheapest energy today.