


 Arguments


Yes, Virginia, There is Sea Level Rise
Posted on 22 July 2012 by greenman3610
In the newest video in the This is Not Cool” series at the Yale Forum on Climate Change & the Media (also posted at Climate Crocks), Peter Sinclair examines the impending sea level rise, including in the context of North Carolina lawmaker denial of the accelerating sea level rise, examined here at Skeptical Science by John Bruno and Rob Painting. Sinclair does an excellent job as always - take a look:


 0
0  0
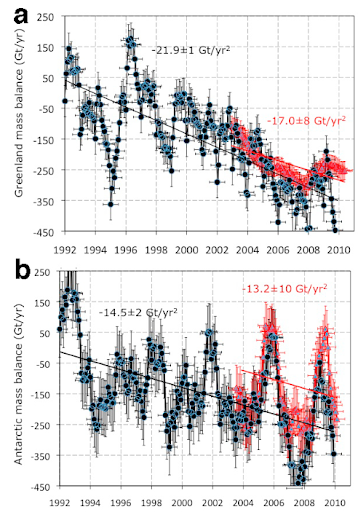
0 These ice sheets have been essentially stable for the last 7-8000 years and only began to melt/disintegrate in the late 20th century. Global sea level rise in the 20th century was anomalous within the context of the last 7-8000 years.
Certainly there are other factors to consider in North Carolina - for one it is an area that was uplifted by the presence of the gigantic Laurentide ice sheet during the peak of the last ice age. The ice sheet is long gone, but the Earth is still responding to the change in loading - hence the subsidence going on along the North Carolina coast today.
The trends in the global sea level satellite data (the last two decades) are consistent with the ocean heat content data (cooling between around 2004-2008), which is itself consistent with the solar dimming trend in the Southern Hemisphere, and the cooling phase of the 11-year solar cycle.
The Earth has an energy imbalance, so it will continue to warm and sea level will continue to rise. Whether it will accelerate in the next few years remains to be seen, but unless reflective sulfate aerosols increase, it seems likely to.
These ice sheets have been essentially stable for the last 7-8000 years and only began to melt/disintegrate in the late 20th century. Global sea level rise in the 20th century was anomalous within the context of the last 7-8000 years.
Certainly there are other factors to consider in North Carolina - for one it is an area that was uplifted by the presence of the gigantic Laurentide ice sheet during the peak of the last ice age. The ice sheet is long gone, but the Earth is still responding to the change in loading - hence the subsidence going on along the North Carolina coast today.
The trends in the global sea level satellite data (the last two decades) are consistent with the ocean heat content data (cooling between around 2004-2008), which is itself consistent with the solar dimming trend in the Southern Hemisphere, and the cooling phase of the 11-year solar cycle.
The Earth has an energy imbalance, so it will continue to warm and sea level will continue to rise. Whether it will accelerate in the next few years remains to be seen, but unless reflective sulfate aerosols increase, it seems likely to.

 [Source]
It is this reality that some in Virginia wish to deny, and that is the subject of this post "Yes, Virginia, There is Sea Level Rise".
[Source]
It is this reality that some in Virginia wish to deny, and that is the subject of this post "Yes, Virginia, There is Sea Level Rise".
 It's merely a question of whether Sea Level rise will accelerate enough to make that prediction come true.
 Caption: "Projected sea-level rise for the 21st century. The projected range of global-averaged sea-level rise from the IPCC (2001) assessment report for the period 1990–2100 is shown by the lines and shading (the dark shading is the model average envelope for all SRES greenhouse gas scenarios, the light shading is the envelope for all models and all SRES scenarios, and the outer lines include an allowance for an additional land-ice uncertainty). The updated AR4 IPCC projections (90% confidence limits) made in 2007 are shown by the bars plotted at 2095, the magenta bar is the range of model projections and the red bar is the extended range to allow for the potential but poorly quantified additional contribution from a dynamic response of the Greenland and Antarctic ice sheets to global warming. Note that the IPCC AR4 states that ‘‘larger values cannot be excluded, but understanding of these effects is too limited to assess their likelihood or provide a best estimate or an upper bound for sea-level rise.’’ The inset shows the 2001 projection compared with the observed rate estimated from tide gauges (blue) and satellite altimeters (orange) (based on Church et al. 2001; Meehl et al. 2007; Rahmstorf et al. 2007)"
"The concern that the sea-level projections may be biassed low has been reinforced by a comparison of observed and projected sea-level rise from 1990 to the present. For this period, the observed sea level has been rising more rapidly than the central range of the IPCC (2001, 2007) model projections and is at the very upper end of the IPCC TAR projections (Fig. 6; Rahmstorf et al. 2007), indicating that one or more of the model contribu- tions to sea-level rise may be underestimated." [My highlighting]
In my opinion, those who wish or choose to believe, that uncertainty is skewed towards the lower end of outcomes, are being incredibly naive.
Caption: "Projected sea-level rise for the 21st century. The projected range of global-averaged sea-level rise from the IPCC (2001) assessment report for the period 1990–2100 is shown by the lines and shading (the dark shading is the model average envelope for all SRES greenhouse gas scenarios, the light shading is the envelope for all models and all SRES scenarios, and the outer lines include an allowance for an additional land-ice uncertainty). The updated AR4 IPCC projections (90% confidence limits) made in 2007 are shown by the bars plotted at 2095, the magenta bar is the range of model projections and the red bar is the extended range to allow for the potential but poorly quantified additional contribution from a dynamic response of the Greenland and Antarctic ice sheets to global warming. Note that the IPCC AR4 states that ‘‘larger values cannot be excluded, but understanding of these effects is too limited to assess their likelihood or provide a best estimate or an upper bound for sea-level rise.’’ The inset shows the 2001 projection compared with the observed rate estimated from tide gauges (blue) and satellite altimeters (orange) (based on Church et al. 2001; Meehl et al. 2007; Rahmstorf et al. 2007)"
"The concern that the sea-level projections may be biassed low has been reinforced by a comparison of observed and projected sea-level rise from 1990 to the present. For this period, the observed sea level has been rising more rapidly than the central range of the IPCC (2001, 2007) model projections and is at the very upper end of the IPCC TAR projections (Fig. 6; Rahmstorf et al. 2007), indicating that one or more of the model contribu- tions to sea-level rise may be underestimated." [My highlighting]
In my opinion, those who wish or choose to believe, that uncertainty is skewed towards the lower end of outcomes, are being incredibly naive.
 The CSIRO estimate that not more than 30% of the sea level rise since the 1950s has come from polar ice sheets. Based on that, and using your projection, the sea level rise contribution from other sources can be expected to be 280 mm from 1990, leading to a combined expected increase of 640 mm. That estimate is not based on models, it is simple extrapolation of known data.
That illustrates, in part, the folly of simple projection. Using two different projections methods, we arrive at inconsistent results which diverge by over 50%. It also shows how foolish it is to think you can assess future sea level rise without examining potential future changes in temperature, not to mention such wild cards as the potential instability of the West Antarctic Ice Sheet.
The CSIRO estimate that not more than 30% of the sea level rise since the 1950s has come from polar ice sheets. Based on that, and using your projection, the sea level rise contribution from other sources can be expected to be 280 mm from 1990, leading to a combined expected increase of 640 mm. That estimate is not based on models, it is simple extrapolation of known data.
That illustrates, in part, the folly of simple projection. Using two different projections methods, we arrive at inconsistent results which diverge by over 50%. It also shows how foolish it is to think you can assess future sea level rise without examining potential future changes in temperature, not to mention such wild cards as the potential instability of the West Antarctic Ice Sheet.

 This plot shows that:
1. There is an underlying increase in the rate of rise. It works out at about 1mm per year increase every 70 years.
2. The rate of increase in sea levels is quasi-cyclical. Thus, depending on the phase of the cycle it is possible both to have an underlying acceleration and short term (c 30 years) drop in the rate of rise.
Despite the implications I am not a climate change denier. I believe that the acceleration in the rate of increase is almost certainly due to global warming alone. I am also in favour of the decision relating to the citizens of Virginia being based on science. However since the rate of sea level rise is quasi-cyclical and since as far as I know (correct me if I am wrong) none of the model projections include this then the four year pause to get better science may be to their advantage.
This plot shows that:
1. There is an underlying increase in the rate of rise. It works out at about 1mm per year increase every 70 years.
2. The rate of increase in sea levels is quasi-cyclical. Thus, depending on the phase of the cycle it is possible both to have an underlying acceleration and short term (c 30 years) drop in the rate of rise.
Despite the implications I am not a climate change denier. I believe that the acceleration in the rate of increase is almost certainly due to global warming alone. I am also in favour of the decision relating to the citizens of Virginia being based on science. However since the rate of sea level rise is quasi-cyclical and since as far as I know (correct me if I am wrong) none of the model projections include this then the four year pause to get better science may be to their advantage.


Comments