


 Arguments


It takes just 4 years to detect human warming of the oceans
Posted on 20 September 2017 by John Abraham
We’ve known for decades that the Earth is warming, but a key question is, how fast? Another key question is whether the warming is primarily caused by human activities. If we can more precisely measure the rate of warming and the natural component, it would be useful for decision makers, legislators, and others to help us adapt and cope. Indeed, added ocean heat content underlies the potential for dangerous intense hurricanes.
An answer to the “how fast?” question was partly answered in an Opinion piece just published on Eos.org, the daily online Earth and space science news site, by scientists from China, Europe and the United States. I was fortunate enough to be part of the research team.
To measure how fast the globe is warming, we focused on the extra heat that is being trapped in the climate. The key to measuring the extra heat is by comparing the incoming and outgoing energy – just like you watch your bank account, keeping track of income and expenses to tell whether your bank balance will increase or not.
Okay so how do we measure these incoming and outgoing flows? In our view, the best way is in the oceans. We know that the oceans absorb almost all of the excess heat – so, perhaps we can detect energy increases in ocean waters?
Measuring the oceans is challenging. They are vast and they are deep – measurements can be noisy. Detecting a long-term trend (a signal) within the noise can be a challenge. But this challenge is exactly what we focused on. We wanted to know how large the signal-to-noise ratio is for ocean heat measurements because this would tell us how many years of data are needed to detect warming. Can we detect global warming with one year of measurements? With a decade? Or do we need multiple decades of measurements to be sure the climate is changing?
Our work shows that scientists need less than 4 years of ocean heat measurements to detect a warming signal. This is much shorter than the nearly three decades of measurements that would be required to detect global warming if we were to use temperatures of air near the Earth’s surface. It is also slightly better than the nearly 5 years of sea level rise data that are needed for detecting a long-term trend. This means that the warming is not natural, but rather stems from the human-induced climate change, primarily from increases in heat-trapping gases in the atmosphere.
This finding should help change the way we talk about global warming. Normally scientists and the public wait for the official annual “global temperatures” to be released (every January or February) by major research groups like Nasa, Noaa, and the Hadley Centre in the UK. Avid consumers of global warming news often use these air temperatures to “prove” or “disprove” global warming. If it was hot last year, “its global warming!” If last year was cool, “global warming is over!”
But the year-to-year fluctuations of air temperatures are predominantly associated with El Niño and weather variability and mislead those who use any one year as climate-change proof. We saw the impact of fluctuations over the past two decades where a slowing of the rise of global surface temperatures led to false claims that global warming had “stopped” or that there was a “hiatus.” No such cessation occurred for ocean heat content.
Hence global ocean heat content data isn’t so noisy. It represents the total thermal energy in the ocean waters, and is now known with a high degree of certainty (see the figure below), in part because scientists have improved ocean temperature sensing methods and increased the number of sensors throughout the ocean waters.
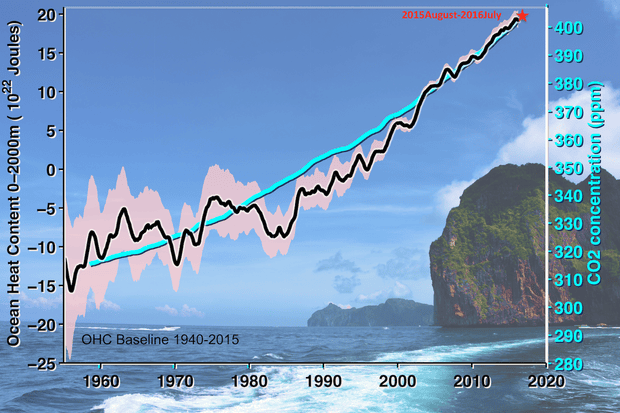
Increases in ocean heat content since 1950s. Illustration: Cheng, L., K. E. Trenberth, J. Fasullo, J. Abraham, T. P. Boyer, K. von Schuckmann, and J. Zhu (2017), Taking the pulse of the planet, Eos, Vol. 98.
According to our analysis, the top 10 warmest years of ocean heat content are all in the most recent decade (following 2006) with last two years being the hottest.


Abraham: "ocean heat content is the key to quantifying how fast the climate is changing" Arguing online, I tell people that while global warming causes climate change, they aren't exactly the same thing. A useful proxy for 'climate change' is the surface temperature record. But when deniers note that that proxy hadn't changed temperature much for 12 years after 1998, they said 'global warming' had stopped. No, the proxy for 'global warming' is ocean heat content. I try to explain that, since the ocean is 200 times more massive than the atmosphere, trying to measure 'global' warming without it is like trying to discern the direction of a hurricane by measuring a pocket of air in its SW quadrant.
“Ocean Heat Content” should become a standard metric not only for measuring climate change but for testing our computer models that are used to predict the future climate.
Roger Pielke Snr will feel vindicated by this conclusion. He's been saying the oceans are the best metric for many years.
https://pielkeclimatesci.wordpress.com/2008/03/19/comments-on-the-npr-story-by-richard-harris-entitled-the-mystery-of-global-warmings-missing-heat/
https://pielkeclimatesci.wordpress.com/2006/08/30/mismatch-btween-models-and-observations/
By coincidence, in the 1st article, he notes that OHC had not risen by.... 4 years.
Is the corrollary here that we will not see another 4 years of no OHC rise as long as we're emitting CO2 at present rates? And should that happen, won't the contrarians point at this article to say global warming is over?
[BTW, wen clicking on the SkS home link, this article is the only one that appears. It's all blank below. I cleared the cache, but no result. Something's up with the site]
[BW] Thanks for the heads-up, Barry. The homepage display should be fixed now.
Roger was only looking at 0-700m. You get heat loss from upper ocean to atmosphere in an El nino. He stopped beating that drum when OHC marched on upward. OHC is another important metric for quantifying climate change but I think it is too early for calling it the "standard" metric. Because the surface is where we live, surface temperature is what matters to us humans. My understanding is that it is not a trivial thing to extract OHC from models so dont know how climate modellers would feel about both their modelling skill in oceans and using OHC for validation.
Is there a problem with the SKS website? I see only this one article when I go to the home page.
[BW] The homepage display should be fixed now.
Talking about the air temperatures fluctuating, my idea to cool oceans would cause havoc with readings, but would cool, I believe. If one has mist evaporative cooling ( see https://en.wikipedia.org/wiki/Evaporative_cooler ) with an efficiency of 80%, then sea surface temperatures of 27 deg C or so could drop below surface temperatures of 26 deg C or so needed for hurricanes. https://www.seatemperature.org/caribbean-sea says, "The water of the Caribbean is warm, clear and has lower salinity levels than the neighbouring Atlantic. The average water temperature is around 27°C (80°F) and varies as little as 3°C (37°F) throughout the year." Now 27 deg C is sufficient for hurricanes to form. The temperature also does not change much, so in future, sea temperatures could be high enough throughout the year for hurricanes to form. Example. Air temperature is 33 deg C (dry bulb temperature). The humidity is 70%. Calculation: The wet bulb temperature is 28.31 deg C and therefore an 85% efficiency evaporative cooling would cause the air temperature to drop to 29 deg C. Surface temperatures could be altered by these means
[JH] Excessive repetiton deleted.
Please note that posting comments here at SkS is a privilege, not a right. This privilege can be rescinded if the posting individual treats adherence to the Comments Policy as optional, rather than the mandatory condition of participating in this online forum.
Please take the time to review the policy and ensure future comments are in full compliance with it. Thanks for your understanding and compliance in this matter.
Swayseeker @5
The evaporative coolers use fans to induce a cooling effect, so I dont see how a mist comes into things or relates to evaporation as such.
I also don't see how you would apply such devices to the oceans in a practical way and you dont describe how. It looks very difficult.
You also need to provide calculations to show how many you would need at what cost. It would clearly be huge numbers probably staggering as you have thousands of square kms, even within the limited area that generates hurricanes like Irma, and you would need to cool pretty much all those oceans.
It could also have unintended negative consequences.
However wave powered pumps have been suggested to drive warmer surface water deeper down as below. These sorts of ideas arent new but have many difficulties in application.
www.vox.com/energy-and-environment/2017/9/8/16264376/stopping-a-hurricane-science
But this is not really the right website to float such ideas, this is a science website not a technology forum. It kind of really distracts me from the article above, and climate science. But Im not knocking novel ideas, but you must think them through.
Why not get involved with some website that deals with engineering ideas and get some feedback from the real experts on practicality and costs?
1. I don't like, but can understand, some of the reluctance of video media (we'll exclude FoxNews) to mention "global warming" during hurricane coverage, because the complexity of the attribution would require too much explanation:
Not 'cause'...The ocean temperature...the frequency of all hurricanes, or just the 4's and 5's...rain and water vapor...wind shear...stalling, with speculation about jet streams... ...
2. They could alternatively emphasize the synonym of GW, 'higher temperatures'.
In partial compensation, the coverage could could increase the existing mention of Sea Surface Temperatures, beyond the existing color coding. As by mentioning the actual temperatures (does 30C correspond to category 5?). And maybe showing past smaller hurricanes' tracks with their cooler temperatures. Just saying 'hot' or 'hottest' doesn't fully describe the situation.
3. Heat content/temperature below the surface sometimes gets mentioned, but I've never seen it shown.
For today's hurricane Maria track, follow Google's "RSMAS Ocean Heat Content North Atlantic."
For some other examples, see the Google images at 'hurricane ocean heat content'.
scaddenp @ 3,
Pielke Snr has been consistent on OHC being the best metric. He hasn't "stopped beating that drum."
Pielke Snr 2017: "Ocean heat content changes is, by far, the much better way to assess global warming. Ocean heat changes can be much more directly related to the radiative imbalance at the top of our atmosphere."
https://www.washingtonpost.com/news/capital-weather-gang/wp/2017/01/18/scientists-react-to-earths-warmest-year-we-are-heading-into-a-new-unknown/?utm_term=.1e4f7ccdd2c5
Nor did he limit that to the upper 750 meters.
"To be able to predict future climate change, in principle, it is necessary to be able to evaluate the actual current and future heating of the climate system from anthropogenic and natural sources as well as to evaluate where this heating is accumulating. For example, heat could be stored in the ocean at depths greater than 3 km (where observations were not reported in the Levitus et al. studies), instead of lost to space..."
http://journals.ametsoc.org/doi/pdf/10.1175/BAMS-84-3-331
You may be thinking of his comments on OHC papers which were about the upper 300/700/750 meters.
When he was blogging this view some years back, he tended to get criticism for it by those who (usually rightly) deconstructed 'skeptic' arguments. His papers don't rate a mention in the opinion piece linked above. I remember those to and fros, and it's disappointing that his earlier work has been sidelined in this recent opinion.
The time period assessed in the opinion piece seems way too short. 12 years? Better to do multiple series of that length than just one.
The GMST trend uncertainty for the period (2004-2015) is just wrong. They get a trend of 0.016°C ± 0.005°C per year. In all global surface data sets the uncertainty is larger than the trend for that period.
Possibly a typo, but as it appears twice, it doesn't give me much confidence in the piece in general.
John,
Is the GMST uncertainy for the period 2004-2015 in the opinion piece correct?
0.016°C ± 0.005°C per year
GISS has the same trend, but an uncertainty of 0.021.
What am I missing?
Barry @8 and @9, "What you are missing" is the bigger picture.
The GMST warming trend you quote [of 0.016 degrees per year] may be plus or minus a particular "uncertainty" figure — but do you not think it would be crazy to therefore deduce that "There is nothing going on" / "Move along folks ... nothing to see here" ?
Take a common sense look at the bigger picture — since whether the expressed numerical uncertainties be tenths or thousandths of a degree, yet the polar ice is still melting away and the sea level is rising and glaciers are disappearing and plants & animals are changing their activities accordingly. The world is really changing — regardless of any "viewed-through-a-narrow-straw" type of blinkered assessment.
In overall terms, Pielke ( +/_ one generation ! ) is wrong-headed.
Fool @ 7:
The "science" correspondents in almost all the media are hopeless. Even the better of them were putting the recent hurricanes down to AGW without caveats.
The only one I take any notice of is Peter Highfield, late of the BBC and other outlets, who puts out YouTube talks under the name Potholer54: masterly understatements and full of links to the relevant papers - unlike the deniers who just "know" their alternative facts are common sense right.
Barry @ 9:
It looks to me also like the uncertainty on the GMST trend is wrong. I can get a value in the same ballpark (but not the same as) theirs by leaving out the autocorrelation.
This makes no difference to the calculation in the opinion piece, since they do not use that value. However the trend uncertainty is itself derived from the value of sigma - I need to think about the implications of that.
The presentation of the mathematics behind determining the specific values of information presented (and detailed description of what is being presneted) can be investigated to be better understood, but it is clear in Fig.1 of the "Taking the Pulse of the Planet" Opinion Piece in Eos that the magnitude of fluctuation, or noisiness, of the Ocean Heat Content is very small compared to the Global Mean Surface Temperature (the magnitude of "GMST Linear Trend= 0.016°C ± 0.005°C/yr ; σ=0.110°C/yr" seems to indicate that the value of trend ± variation is not the 2σ value in the SkS Trend Calculator and that the σ presented is not meant to be like the σ in the 2σ value of the SkS Trend Calculator).
My way of looking at it, as an engineer I always use quick ways to test/validate analysis results or claims made, has been to experiment in the SkS Temperature Trend Calcualtor to find the range of magnitude of running mean for GMST that results in a trend line as smooth as the OHC line in Fig. 1 (the 12 month running mean of OHC).
The 60 month running mean of GMST does not look as smooth as the OHC 12 month running mean. And the 120 month running mean of GMST looks smoother than the 12 month running mean of the OHC. To me that means that it would take more than 5 times, but less than 10 times, as long a time series in the GMST to see evidence of a trend that is evident in the OHC data. The mathematical result showing a comparison of 27 years for GMST to 4 years for OHC is within the range of values that make sense to me.
OPOF,
27 years for GMST seems about right to me, too, but I'm not convinced that 4 years is sufficient for OHC. The opinion piece only considered 12 years of data to 2014. Further back in the record are many occasions when OHC did not warm for 4 years and even longer.
Though the data get spottier further back in time, a statistical test using other periods, rather than just one, would have been more convincing. Why should 2004-2015 be assumed to be typically representative?
barry,
The slope/trend of the OHC line has clearly become steeper since the early 1990s. And the uncertainty band is also clearly larger in the OHC data prior to 2000. Given the same level of noisiness of the data the shallower the trend line the longer it takes to 'identify a trend'. And larger noisiness prior to 2000 may also be due to the uncertainty of the methods of data evaluation prior to 2000 rather than actual changes of OHC. So earlier sets of data would be expected to have a longer time required to identify the trend, but that would not be very relevant to the future evaluations using current or more certain methods of determining OHC.
A better test of what you are concerned about may be to evaluate longer time periods ending in the most recent year of data (maybe 2016) to identify how far back you have to go to see a significant change from the '4 year value' determined in the analysis that is being reported, without going back into time periods of significantly higher uncertainty.
Note that the same would apply to the 27 years for GMST. That duration would likely be longer if an earlier 12 year period was evaluated. The relative durations between the OHC and GMST may maintain the ratio of 27/4 between the GMST duration and OHC duration, and should since the OHC an Sea Level Rise do not have the levels of noisiness of values that occur in the GMST data.
OPOF,
Yes, the results would likely be less tight using different/longer time periods, and the uncertainty greater. But I think that would be good science. 2014/2015 were subsequent hottest years in the record. That's going to skew results.
From the opinion piece:
These analyses show that during 2015 and 2016, the heat stored in the upper 2,000 meters of the world ocean reached a new 57-year record high (Figure 1). This heat storage amounts to an increase of 30.4 × 10²² Joules (J) since 1960 [Cheng et al., 2017], equal to a heating rate of 0.33 Watts per square meter (W m−2) averaged over Earth’s entire surface—0.61 W m−2 after 1992.
It seems they consider the data useful enough for earlier periods, but perhaps not for the calculation they performed. ARGO became fully global in 2007, for example. But they did not include 2016 - presumably because of the el Nino skewing results.
If data limitations 'forced' them to use the one 12-year period, that limitation might also have earned a comment, and perhaps some added uncertainty. I was a little surprised to see no commentary on why this particular choice of time period and not another, like 2003-2014, for example. 2003-2014 has 50% lower trend than the period they chose. The actual trend may not make a difference, but it would have been good to see that discussed, as the trend they chose had 2 consecutive record warm years at the end. But even the noise might be peculiar to the period selected.
Had it been a study rather than an 'opinion', I expect they'd have explored these things.