Climate Science Glossary

Term Lookup

Enter a term in the search box to find its definition.

Settings

Use the controls in the far right panel to increase or decrease the number of terms automatically displayed (or to completely turn that feature off).

Term Lookup

Settings


All IPCC definitions taken from Climate Change 2007: The Physical Science Basis. Working Group I Contribution to the Fourth Assessment Report of the Intergovernmental Panel on Climate Change, Annex I, Glossary, pp. 941-954. Cambridge University Press.

Home Arguments Software Resources Comments The Consensus Project Translations About Support

Twitter Facebook YouTube Mastodon MeWe

RSS Posts RSS Comments Email Subscribe


Climate's changed before
It's the sun
It's not bad
There is no consensus
It's cooling
Models are unreliable
Temp record is unreliable
Animals and plants can adapt
It hasn't warmed since 1998
Antarctica is gaining ice
View All Arguments...


Username
Password
New? Register here
Forgot your password?

Latest Posts

Archives

Climate Models: Learning From History Rather Than Repeating It

Posted on 26 August 2010 by gpwayne

Climate models are mathematical representations of the interactions between the atmosphere, oceans, land surface, ice – and the sun. This is clearly a very complex task, so models are built to estimate trends rather than events. For example, a climate model can tell you it will be cold in winter, but it can’t tell you what the temperature will be on a specific day – that’s weather forecasting. Climate trends are weather, averaged out over time - usually 30 years. Trends are important because they eliminate - or "smooth out" - single events that may be extreme, but quite rare.

Climate models have to be tested to find out if they work. We can’t wait for 30 years to see if a model is any good or not; models are tested against the past, against what we know happened. If a model can correctly predict trends from a starting point somewhere in the past, we could expect it to predict with reasonable certainty what might happen in the future.

So all models are first tested in a process called Hindcasting. The models used to predict future global warming can accurately map past climate changes. If they get the past right, there is no reason to think their predictions would be wrong. Testing models against the existing instrumental record suggested CO2 must cause global warming, because the models could not simulate what had already happened unless the extra CO2 was added to the model. Nothing else could account for the rise in temperatures over the last century.

Where models have been running for sufficient time, they have also been proved to make accurate predictions. For example, the eruption of Mt. Pinatubo allowed modellers to test the accuracy of models by feeding in the data about the eruption. The models successfully predicted the climatic response after the eruption. Models also correctly predicted other effects subsequently confirmed by observation, including greater warming in the Arctic and over land, greater warming at night, and stratospheric cooling.

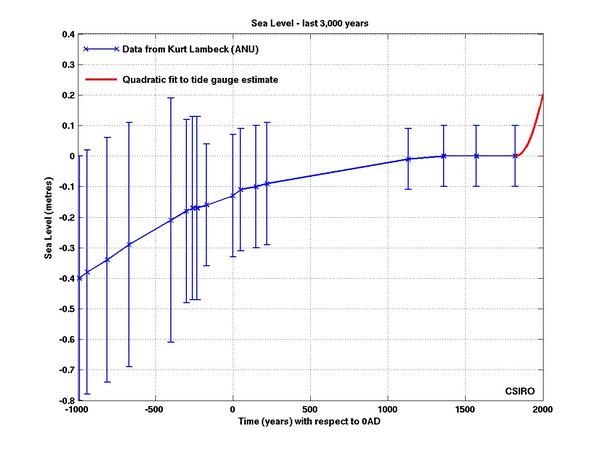
The climate models, far from being melodramatic, may be conservative in the predictions they produce. For example, here’s a graph of sea level rise:


Sea level change. Tide gauge data are indicated in red and satellite data in blue. The grey band shows the projections of the IPCC Third Assessment report (Copenhagen Diagnosis 2009).

Here, the models have understated the problem. In reality the events are all within the upper range of the model’s predictions. There are other examples of models being too conservative, rather than alarmist as some portray them. All models have limits - uncertainties - for they are modelling chaotic systems. However, all models improve over time, and with increasing sources of real-world information such as satellites, the output of climate models can be constantly refined to increase their power and usefulness.

Climate models have already predicted many of the phenomena for which we now have empirical evidence. Climate models form a reliable guide to potential climate change.

Note: This post is the Basic version (written by Graham Wayne) of the skeptic argument "Models are unreliable". We're currently going through the process of writing plain English versions of all the rebuttals to skeptic arguments. It's a big task but many hands make light work. If you're interested in helping with this effort, please contact me

0 0

Printable Version  |  Link to this page

Comments

Comments 1 to 37:

  1. I wonder what the modelling and real effect of the icelandic volcano will be? Was it grand enough to reduce the temp rise and will it give fodder to the 'skeptics' that the planet isn't warming? On the subject of tides, I'm curious to know how a value is assigned with an accuracy of a few mm to a water level that is fluctuating wildly by a few cm every second and a few metres every 6 hrs. Maybe someone can enlighten me? (I probably can find the answer instantly with google and I shouldn't be wasting readers' time and this valuable space!)
    0 0
  2. John, the impact of the Iceland volcano is limited by it's location, not only the size of the eruption. Were it situated closer to the equator, and of sufficient size, it's emissions would be taken up by the tropical circulations, originating at the equator, and distributed around the globe.
    0 0
  3. May be worth mentioning that in some climate models at least (if not all), the FIRST test is ensure that if there are no forcings, then there is no trend - ie all the cycles will be there but no trend of 30 years. John, an average can be very stable and measured with high precision even if individual reading are highly variable. Make some waves in a bath (but dont slop water out of it). You level readings will around the bath will be changing madly but the amount of water in the bath isnt so average will be stable. My understanding is that Eyjafjallajökull effects will be small - it small compared to Pinatuba and in the wrong place to have much effect. (A tropical volcano powerful enough to eject sulphur into the stratosphere is a climatic event).
    0 0
  4. Thanks for the volcano info. Bath analogy doesn't help. Are the readings (tidal guages) taken every millisecond and then averaged and what of the satellite measurements with those big ocean waves? Academic question a bit off topic which is about predictions.
    0 0
  5. Timing of the readings doesnt matter for tide guage. Its the average of the all the readings that counts, because that levels out the waves and lunar cycle. I sure you can find a tide guage near you for example of data. My local can be found at port otago. Of course, going from a change at individual stations to global sea level changes isnt trivial. Satellite altimetry doesnt have a wave or tectonic problem so more reliable when calibrated. Big literature - Stick JA Church into google scholar for starting point, then PL Woodworth for more tide guage orientated stuff.
    0 0
  6. Further to scaddenp's response re tide measurements - you have similar issues measuring noise levels with a meter. The old-fashioned way was to watch the needle madly wave back and forth, and guesstimate the lower, middle, or upper points. These days, the meters no longer have needles, and *do* take measurements on millisecond timeframes, calculating the averages mathematically. This has led to a few changes in approach over the years, as the old "maximum" level is closer to the 10th percentile of the actual fluctuating values (known as the L10). Similarly, the "minimum" is now measured as the L90, or 90th percentile. But for climate studies, and sea levels in particular, the moment-to-moment variation isn't important, you only care about the average - what we in the noise business call the Leq, or "equivalent continuous level". In the noise case, it's the level with the same acoustic energy (due to logarithmic decibel scales, this isn't the same as the average level). For tides or temperatures, measured on a linear scale, it's just the average over a reasonable timeframe. For tides, you might pick a period of, say, 30 days, to average out a lunar cycle. Temperatures might look at an annual average, to smooth out the seasons - depending on what you're looking for. (sorry for wandering a bit off-topic there... :-P )
    0 0
  7. Now I've done some internetting and found the answer I was after. The tide gauges are a pipe which has a small hole at the bottom which acts as a capacitor and smooths out the short term fluctuations from waves. Readings are taken every 6 mins. Where were we ... oh yes predictions.
    0 0
  8. I wonder why graphs showing sea level rise, on this site, always start in the latter half of the 20th century. If you start with a year about 100 years earlier, apparently you get a different picture: 
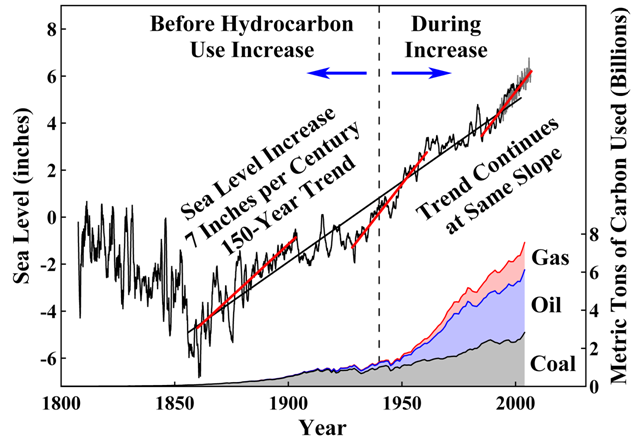
If this graph is right, the sea level started to rise at a steady pace almost 100 years "too early". That is, long before the use of hydrocarbons started to explode around the middle of the 1900's. So, maybe the proposed reason for the sea level increase (i. e. CO2) is debatable?
    0 0
  9. Your graph doesn't look right Argus. Where's it from?. This graph however, is an update to Church & White 2006 A 20th century acceleration in global sea-level rise
    0 0
  10. Thank you for the updated graph! To me the two graphs look sufficiently similar, and they both convey the same message to me: sea levels have risen at a rather steady rate since 1870 -- so why are we (like in this post) concentrating only on the curve from 1970 up to 2010? One answer might be that the purpose is to connect the last part to the recent rise in CO2. That is why the trend of the preceding century does not fit in. Another answer might be that it is because we can see a steeper rise during the last 20 years, and that this looks alarming enough. However (looking at the graph), a similar steep period seems to have occurred in the period 1935 to 1955, so ...? (The graph I found was from here.)
    0 0
  11. Argus #8: The first thing which jumps out at me about your graph is the odd labeling. If you look at the 'hydrocarbons' data you will see that it ACTUALLY starts increasing circa 1850... exactly when the sea level rise begins. They just LABEL the start at around 1940. Switching into 'incorrect skeptic logic' mode for a moment I'd guess that the claim is that fossil fuel use accelerated ~1940 and thus if it were causing the sea level rise that should ALSO have increased at the same point. However, this is faulty logic because temperature forcings from CO2 and other greenhouse gases are NOT linear... they are logarithmic. Meaning that the first X units of increase causes more warming (and thus sea level rise) than the second X units which cause more than the third X units and so on. Basically, in order to maintain a linear increase in temperatures the rate of CO2 emissions HAS to be increasing.
    0 0
  12. CBDunkerson, If I understand your first paragraph correctly, you are saying that a steep decrease in sea level during the years 1800-1850 is immediately replaced by a steep increase, from the moment they started burning measurable amounts of coal. The tiny amount burned around 1850 is impossible to read out from the graph, but it certainly seems to be less than one percent of the present figure. If I understand your second paragraph correctly, for the sea level to continue rising, we have to keep increasing CO2 emissions even further. So, if we just stay at the present level of production, sea level will also stay at the present level. That is kind of reassuring.
    0 0
  13. "Computer modeling of global climate is perhaps the most complex endeavor ever undertaken by mankind," writes MIT atmospheric scientist Kerry Emanuel in his short book What we know about climate change. This is the first paragraph of the article, "Powerful new climate model unveiled", published in yesterday's (Aug 26) edition of USA Today. Needless to say, this article has attracted anti-AGW bloggers like flies to honey. http://content.usatoday.com/communities/sciencefair/post/2010/08/powerful-new-climate-model-unveiled/1#uslPageReturn
    0 0
  14. Just off the top of my head, without putting a lot of thought into it, my explanation for the trend shown in the SLR graph is that a relatively slow increase in sea level was associated with the end of the Little Ice Age, and then graded into a slightly steeper (and accelerating) rise caused by anthropogenic global warming. In other words, it's a lot like the global mean temperature graphs -- a century-long rise, but with a different balance of causes in the first vs second halves of the century. In other words, we can't use the existence of SLR as proof of AGW, since it can and does have other causes at other times. But we can say that recent SLR is consistent with AGW. Does that make sense, Argus?
    0 0
  15. Argus #12: Nope, you didn't quite follow it. Warming due to CO2 and other GHGs is logarithmic. Therefor, in order for warming from GHGs to show a linear trend the rate at which these gases are increasing has to continually increase. That does not mean that warming would stop if the rate of GHG increase became constant... rather the rate of warming from GHGs would begin to slow. Now when you factor in feedback warming and factors leading to sea level rise (ice mass balance loss and thermal expansion of water) it gets more complicated. Both of those can go on for years after the GHG warming slows or even ceases. Again, look at your graph. There was a significant build up of CO2 emissions for DECADES prior to the 1940 line they identify. That CO2 increase caused warming, which was magnified by positive feedbacks, which caused sea level rise. The argument that accelerating CO2 emissions after 1940 should have led to a matching acceleration of sea level rise is simply false... there is no reason that the two factors must rise at exactly the same rate and many reasons (explained above) why they would not. Sea level rise IS accelerating... just not as fast as CO2 emissions. Which isn't at all surprising given the logarithmic nature of GHG temperature forcings.
    0 0
  16. CBDunkerson - the logarithmic nature of GHG forcings - does that mean we have already done the MOST damage with the CO2 already released. If the temp forcing of the first doubling is 3C - what would you estimate the temp forcing of the next 280PPM increase in CO2 is? (I fight, work, cajole, and live to push CO2 emissions to zero - so no hidden denier agenda here). Thankss.
    0 0
  17. Argus, the planet has been warming since the mid-1800's, so one would expect sea level to rise over that period as well. The fact that it has risen is a proof of global warming -- no matter to what one attributes the cause of the warming. The attempt to connect fossil fuel consumption directly to sea level rise is a straw man. The warming seen up to about 1940 is thought to be caused in part by human activity and in part by solar activity. But solar output has been stable since that time. Initially, global temperatures stabilized for a few decades despite increasing CO2 in the atmosphere, likely due to the dimming effect of industrial particulates in the atmosphere. Since the 1970s, however, the CO2 effect has emerged as the dominant driver of global warming. So drawing a single line from 1850 through 2010 and claiming CO2 can't be the cause is disingenuous at best, and typical of the denialist literature.
    0 0
  18. actually thoughtfull, ln(560/280) is 0.693147. If we assume that all feedbacks are logarithmic at the same scale (they aren't) and ignore lag times then that would mean a 3 C rise from a doubling of CO2 would be using a 'temperature forcing factor' (not actually how it works) of 3 / 0.693146 = 4.328085. Multiplying that factor by ln(840/280), the additional +280 ppm you asked about, would then yield TOTAL warming of 4.754888 C... so the first 280 ppm increase would give 3 C warming and the second 280 ppm about 1.75 C... the third would give about 1.25 C more, making the total at 1120 ppm (two 'doublings' over the baseline) 6 C. To get to 9 C you'd need 2240 ppm and so forth.
    0 0
  19. Argus @ 12, wishful thinking may indeed be comforting, but it won't affect sea level rise. Notice the title of the Church & White paper I linked to @ 9?. And the "recent" sea level rise put into context. The concern is for that 70 meters of sea level rise locked up in the Greenland and Antarctic ice sheets, the same ice sheets that are exhibiting accelerated melt, and the 1 to 2 meters of sea level rise anticipated for this century.
    0 0
  20. Spencer Weart's The discovery of global warming Has interesting sections that provide a background to the models and how climate scientists learnt from them and developed them further by using them to investigate past and present climates. See Simple Models of Climate Change and General Circulation Models of Climate
    0 0
  21. Looking at the graph in #9, a quadratic would be a better fit than a linear trend, thus indicating an accelerating rise, which is somewhat consistent with the CO2 rate of increase.
    0 0
  22. Argus I think its good that as a sceptic you look at long term trends presented as a straight line rather than short term noise. I note the long term temperature trend since around 1880 to 20009 is a straight line pointing up.
    0 0
  23. Thank you CBDunkerson - I see that it is still 3C per doubling, and I can accept that I don't completely understand why it isn't 3C/280ppm (I kind of do - once you double the CO2 the marginal harm of an additional ppm is lower, but the relationship of 3C/doubling still holds). I am thinking you need a given BTU to bump into twice as many CO2 molecules as the baseline to yield the 3C increase. I think I am proving my (lack of) mental powers here. Thanks again for clarifying the log bit.
    0 0
  24. actually thoughtfull - The CO2 absorption band shape is between a Gaussian and a Lorentzian in shape (Riccardo posted about this here). The peak is saturated, but with every doubling the band blocked broadens enough to add an additional 3C. Not intuitive, perhaps, but if you think of it as scaling a clipped Gaussian it kind of makes sense.
    0 0
  25. Wow - I feel like a butterfly flapping it's wings along a fractal coastline (said butterfly being blissfully unaware of the complexity it's simple actions represent) - I had no idea how much complexity lived behind "3C/doubling of CO2" - thanks CBDunkerson, KR and Riccardo for the insights. If anyone wanted to try a post fully explaining this bit in layman's term (hint: Guassian and Lorentzian don't qualify ;-)) - I at least would be grateful. I have enough to be happy with "3C/doubling" - but I could not defend an attack on that (although I have never seen an attack that realized how complicated the concept of climate sensitivity was (other than to say "no support for anything more than .75C/doubling - ie no positive feedbacks)). Back to muttering and puttering - perhaps I will awaken tomorrow and suddenly understand that which eludes me today (and too, perhaps all deniers will succumb to logic and facts - both outcomes are highly doubtful).
    0 0
  26. CBDunkerson at 05:02 AM, calculating CO2 levels is only a small part of the complete picture. That complete picture has to include water vapour. Each degC rise equates to a 6-7.5% increase in water vapour, or about 20% for each doubling of CO2. If those relationships are linear, then during the ice age water vapour would have been about 15,000ppm, currently about 20,000ppm and with a doubling of CO2 about 24,000ppm. How all that extra water vapour transforms back to a liquid or a solid, and what it means in terms of cloud cover is I think the most interesting, and perhaps the most important process that needs to be understood..
    0 0
  27. Thanks, Dappledwater, CBDunkerson, Ned, CBW, nigelj, for your responses to my questions about sea level and CO2! Sea level was an example of what models try to predict. Now back to the posted text about models in general. The following is stated: "The models used to predict future global warming can accurately map past climate changes." This measure of accuracy is, of course, important. The next sentence reads: "If they get the past right, there is no reason to think their predictions would be wrong." No reason? That sounds, to me, a bit too optimistic. What if the model is wrong on some points, but repairs these errors by being wrong on other points as well? Then, even if the model fits known historical data, it will not necessarily fit future data. Recently some preliminary results of a study of the atmosphere, undertaken this year, were presented. It seems that some assumptions about both greenhouse gasses and black carbon may have to be modified. See article here! Two quotes: Among the surprises to come out of HIPPO data are nitrous oxide concentrations that consistently seem to increase with altitude. "Yet the models all show concentrations decreasing with altitude," says Wofsy. The implication, he adds, is that models are either not properly accounting for the transport of nitrous oxide or they are missing a source of the greenhouse gas.Wofsy and his colleagues report that the first HIPPO flight in January 2009 found levels of black carbon that average about five times lower than predicted by an ensemble of 14 global aerosol models […] The models underestimated how much black carbon is being scrubbed out of the air by precipitation, says lead author Joshua Schwarz, […].
    0 0
  28. johnd #26: Yes, I mentioned that I was skipping over the details of feedback effects entirely since 'at' was asking about the '3 C per doubling of CO2' estimate specifically. However, the broad strokes of the hydrological cycle aren't really as much of a mystery as you seem to suggest. Where and when a particular precipitation incident will occur, aka 'weather', is much more difficult to predict than average precipitation, aka 'climate'. The increased water vapor content of the atmosphere is the single largest positive feedback included in that '3 C per doubling' estimate. Rain, snow, clouds, and other incidental effects of that increased atmospheric water vapor have been studied and found to have fairly negligible effects... to the point where it isn't clear whether they are a net positive or negative feedback, but IS clear that they are a tiny fraction of the positive feedback effect of the water vapor itself.
    0 0
  29. 9.Dappledwater There is a new paper in JGL-Oceans (presently it's flagged as the most popular download) which uses a new method for calculating 20th SLR. JOURNAL OF GEOPHYSICAL RESEARCH, VOL. 115, C08013, 15 PP., 2010 doi:10.1029/2009JC005630 Reconstruction of regional mean sea level anomalies from tide gauges using neural networks Manfred Wenzel and Jens Schröter While they find similar 20th C SLR to other papers, such as Church & White 2006 they do not see any late 20th C acceleration. They explain this as follows "This is obviously due to the missing depression in sea level prior to 1950 that is the main difference of our result to CW06" I can't comment on the neural network method used in their calculations but it does suggest there is still more to learn about this particular metric.
    0 0
  30. CBDunkerson at 22:03 PM, the broad strokes of the hydrological cycle are indeed broad if the mathematics which drives the climate change theories is exchanged for the application as it applies in practice. Clouds coverage of the earths surface is about 2/3 so it is a major factor of not only how much solar radiation intersects the earths surface but where. Whilst debate rages over small changes in solar output, by comparison little is devoted to how small changes in solar output compares to small changes in cloud coverage and distribution in terms of nett effect, simply because clouds are dismissed because no-one is sure of the nett effect. YET the whole effect that the climate has on the planet is dependent on how much and the distribution of the solar radiation falling on the surface. It is unequal heating and cooling that firstly sets in motion the processes that try to find thermal equilibrium, but also where the unequal warming and cooling occurs that results in thermal energy being absorbed or liberated from the soils and waters which in turn affects whether CO2 is also being absorbed or liberated. In addition the circulation that develops as thermal equilibrium is sought also transports the CO2 either depriving or making it available to and from the various sources and sinks in varying combinations with moisture and warmth that combined determine whether a location becomes a nett source or sink for not only the thermal energy and moisture, but the CO2 as well. Even if all that does have a negligible effect as you claim, which I disagree with, if it is what determines whether the nett effect is positive or negative, small or large, then obviously understanding, and being able to measure it becomes very important. It is all very well to look at the nett effect today and correlate one piece of data with another, but if the processes which are not fully understood are input in to create models that successfully recreate the past climate in order to make predictions leading forward, one can never be sure whether the assumptions being made are correct or merely the result of a number of wrong assumptions canceling each other out.
    0 0
  31. Argus #26. We do actually have one long term climate model of future temperatures. Arrhenius in 1896 predicted a one degree rise for the 20th century from fossill fuel burning, not a bad estimate. Thats very sobering. Never loose siight of that in the detail and exact effects of relatively minor gases like nitrous oxide. Never loose
    0 0
  32. johnd, we've had weather satellites for decades now. They've been able to track the changes in atmospheric water vapor, regional temperatures, clouds, precipitation, et cetera. We can also measure various positive and negative feedback effects of these clouds and precipitation... NONE of those measurements comes anywhere CLOSE (i.e. within an order of magnitude) of the positive feedback from water vapor. Nor does the net effect (which may even be positive). Ergo, NO they just aren't that important. Show me a measurement which even suggests that there could be a net negative feedback from 'downstream' effects (e.g. clouds, precipitation) of increased water vapor capable of offsetting a significant portion (i.e. 10%) of the positive feedback from water vapor and we'll talk. Until then it's all just vague hand-waving... and directly contradicted by the both the paleoclimate record and all measurements of the current ongoing climate change.
    0 0
  33. I tried to post this yesterday but it has disappeared so I try again. You should be interested in the alternative opinion of “physicist, computer Programmer, environmental activist, financial expert” John Droz presented in his January article “Climategate: The Perils of Global Warming Models” (Note 1). This requires no embellishment from me as it reflects my own opinion perfectly. QUOTE:
    0 0
    Moderator Response: Use your own words, please.
  34. Pete Ridley - I'm not terribly surprised that your post got deleted; I believe John Cook and the moderators prefer links to giant quotes, rather than cut-n-paste. Sadly, your post (and your ongoing attitude regarding models as in your posts here, and here) reflects one of the major characteristics of denialism: #4, Impossible expectations and standards of proof. If you include your references to John O'Sullivan and others, as you did discussing satellite temperature records, you are also using tactic #2, Fake Experts. Demanding absolute accuracy, absolute proof, 100%+ certainty - these are all tactics that have repeatedly been used to deny evidence and scientific consensus. I clearly recall these very same tactics used to argue that second hand smoking was not proven harmful, and that CFC's weren't shown to damage the ozone layer. In fact, my brother used to be one of the public apologists/deniers for a major tobacco company, trying to argue against the 'second-hand smoke' issue on his companies behalf. He frequently used the "Not absolutely proven" certainty argument - and he knew quite well he was making s**t up. He referred me to the book "Thank You For Smoking", and stated "This is my job - I am this man." I just cannot take the absolutist argument seriously. We're well past the 95% certainty level for anthropogenic global warming, with a 3 deg. C +/- ~1 warming for a doubling of CO2. Insistence on absolute proof, on climate models that absolutely reproduce temps in the presence of noise - these are just calls to do nothing, and have no scientific basis. The models do a decent job, which has been statistically shown, and ignoring predictions from them is just foolish.
    0 0
  35. Fortunately, Pete, I saw your post of Droz (or druz, as Le Guin might call him) before it disappeared. Droz had the amazing logical faculty to promote the idea that unless a model perfectly predicts what it sets out to predict, it should be tossed out. Pete, look yourself in the mirror and ask yourself if you truly believe that. Every day you bet your life on imperfect modeling that you yourself perform. When you ride your bike to work, you know that the possibility exists that a car could swerve into the bike lane and kill you. Yet you make an educated guess that the likelihood is fairly low (yet people still die in bike lanes). Now, when people gather together and develop a rigorous public and peer-reviewed methodology that produces climate models, you reject them as useless because they do not perfectly predict the future. When all variables and rules are completely known, as in certain programming situations, then models can be created that perfectly predict the future. What about the climate suggests to you that such perfection is possible for climate forecasting? Or perhaps it is that you have a climate model that is capable of perfection? Your position, however, seems to consistently be that trying to model climate is totally pointless and a waste of taxpayer dollars. If that's not what you believe, then shut up already about it and try to help improve the modeling!
    0 0
  36. hi, can I suggest an ultra-basic version? Skeptical criticism of climate modelling undermines the overall skeptical position. The case for using computers to predict future climate is founded on todays climatic instability. Perhaps, some skeptics lambasting climate models, are without realising it, arguing that the climate is less predictable/stable than science currently forecasts. The logical destination point for such an argument would to be a lot less skeptical of AGW. OK Somebody tell me where Ive gone wrong.
    0 0
  37. Way back in December 2006 I attended a lecture on "climate change" at the Perimeter Institute for Theoretical Physics where the presented stated that "all climate models predict warming" and only differ on the point of no return. I just stumbled onto this lecture which can be viewed by clicking the following link: From here to eternity: Global Warming in Geologic Time
    0 0

You need to be logged in to post a comment. Login via the left margin or if you're new, register here.


The Consensus Project Website

THE ESCALATOR

(free to republish)


© Copyright 2024 John Cook
Home | Translations | About Us | Privacy | Contact Us