Climate Science Glossary

Term Lookup

Enter a term in the search box to find its definition.

Settings

Use the controls in the far right panel to increase or decrease the number of terms automatically displayed (or to completely turn that feature off).

Term Lookup

Settings


All IPCC definitions taken from Climate Change 2007: The Physical Science Basis. Working Group I Contribution to the Fourth Assessment Report of the Intergovernmental Panel on Climate Change, Annex I, Glossary, pp. 941-954. Cambridge University Press.

Home Arguments Software Resources Comments The Consensus Project Translations About Support

Bluesky Facebook LinkedIn Mastodon MeWe

Twitter YouTube RSS Posts RSS Comments Email Subscribe


Climate's changed before
It's the sun
It's not bad
There is no consensus
It's cooling
Models are unreliable
Temp record is unreliable
Animals and plants can adapt
It hasn't warmed since 1998
Antarctica is gaining ice
View All Arguments...


Username
Password
New? Register here
Forgot your password?

Latest Posts

Archives

Global warming is accelerating the global water cycle

Posted on 8 October 2010 by John Cook

In the global water cycle, fresh water evaporates from the oceans, rains out over land and runs back into the sea. Global warming is expected to intensify this cycle, leading to an increase in river runoff (otherwise known as river discharge). The problem is direct measurements of discharge around the world's rivers are limited. However, a new study takes advantage of advances in satellite measurement techniques (Syed et al 2010, and thanks to PNAS, here's the full paper). Satellite measurements of ocean mass, evaporation and precipitation were combined to create an observation-based estimation of global river discharge. They found that over the period analyzed (1994 to 2006), river runoff has been increasing by about 1.5 percent annually. The global water cycle is intensifying.

The authors use a number of independent estimates of river runoff. Global sea level was measured by satellite altimetry. This was combined with ocean heat and salinity data to determine changes in ocean mass. Gravity measurements by the GRACE satellites were also used to measure changes in ocean mass as well as monitor redistribution of water mass among the different parts of the planet.

Satellite observations of surface wind speed, sea surface temperature and specific humidity of surface air helped to calculate evaporation rates. Satellite and surface radar data plus rain gauge measurements were merged to provide the best available analysis of global precipitation. All these different methods were combined to create an ensemble mean - essentially their best estimate of global river runoff.
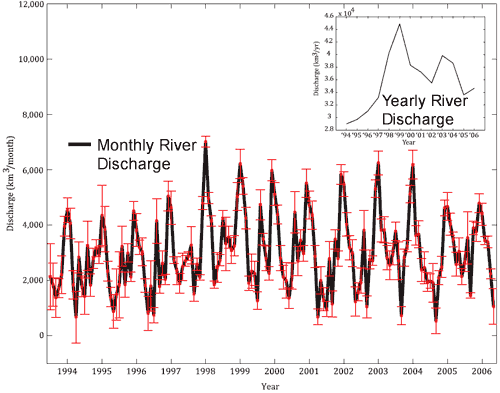

Fig. 1. Monthly variations in global freshwater runoff using various combinations of precipitation and evaporation estimates (solid black line). The Inset shows annual freshwater discharge.

According to co-author James Famiglietti, identifying a trend "was a surprise". I'm surprised that they were surprised as increasing runoff is an expected outcome from warming oceans. Perhaps the time period was considered too short or the signal too noisy to expect to find a trend yet. Famiglietti speculates that "the acceleration of water cycle may already be underway". But the authors do advice that the trends should be interpreted with caution over such a relatively short period (1994 to 2006). Longer-term trends will become clearer as more data becomes available over time.

0 0

Printable Version  |  Link to this page

Comments

Comments 1 to 44:

  1. The graphs don't look very convincing. Please don't tell the skeptics that I said that. Bob Guercio
    0 0
  2. Yes, too noisy to say anything very strong about a trend; the statistics must be marginal. Too soon to declare this another sign of AGW, it would be embarrassing if a couple years from now the trend turns down...
    0 0
  3. I also don't see a trend, especially since the start point is pretty low, and it looks like the end point is lower. It seems to me without knowing any the parameters for the period before 1993, there is no discernible long term trend. I assume that there is something I am not understanding from just eyeballing the chart.
    0 0
  4. We could wind up fighting another denier argument.
    0 0
  5. The US Geologic Survey has been measuring water flow for a very long time. Seems like a longer data trail could be obtained.
    0 0
  6. From eyeballing the graphs it seems likely they are talking about a simple 'area under the curve' trend line... basically, if you were to draw a line through the data such that the area between the line and the data lines above the line equals the area below the line that line would be increasing by 1.5% per year. Given the extremely noisy signal and the large number of uncertain measurements going into the results I'd agree that it isn't clear how robust that result is. I think their surprise was that the data should show anything other than a near zero trend over such a short timeframe. This result suggests that the total river outflow of the planet will double within 50 years if current trends continue... which certainly seems extreme.
    0 0
  7. I encourage everyone to look at Fig.2 in their paper. The trends in global freshwater discharge and global-ocean evaporation between 1994-2006 have p-values <0.001, while for the same period the trend in global-ocean precipitation has a p-value of 0.01. Nevertheless, the data are noisy, with the trends more than an order of magnitude less than the standard deviation of the data. They may be onto something, but IMHO there is simply not enough data (given the noise)to state unequivocally that the global hydrological cycle is accelerating-- and they do not do that. In fact they state that “Sustained growth of these flux rates into long-term trends would provide evidence for increasing intensity of the hydrologic cycle.” This paper is not the first to determine that there are indications/evidence that the hydrological cycle has been accelerating, and their findings seem to support previous work to that effect (e.g., Labat et al. 2004). So perhaps one should consider it as yet another piece of evidence that the hydrological cycle may be starting to accelerate. That said, they have developed a useful and novel technique that can be applied as more data become available-- therein probably lies the greatest contribution of this paper, the technique.
    0 0
  8. Figure 1 does not show a very clear trend. The average from 1994-2006 might be a rise of 1.5 % annually, but I see two phases: 1994-1998 rising, and 1998-2007 slightly decreasing. By the way, 1998 is also the year that had the highest global mean temperature, according to HadCrut. Do we see here the confirmation of the pause in global warming since 1998? Not only global warming has stopped, also the monthly river discharge. This is also evidence, that the GISS-data (having hotter years after 1998) are exagerated.
    0 0
  9. Well the second graph looks a little familiar.
    0 0
  10. @fydijkstra: "By the way, 1998 is also the year that had the highest global mean temperature, according to HadCrut. Do we see here the confirmation of the pause in global warming since 1998?" The fact that 1998 was exceptionally warm does not indicate a "pause" in Global Warming. To suggest as much indicates a weak understanding of statistical significance in trends. Even HadCRUT makes it clear the warming is still there, and didn't pause:
    0 0
  11. Further to Albatross' remarks it's worth looking at the abstract, just as a reminder of the modesty of the claim made in this paper: Freshwater discharge from the continents is a key component of Earth’s water cycle that sustains human life and ecosystem health. Surprisingly, owing to a number of socioeconomic and political obstacles, a comprehensive global river discharge observing system does not yet exist. Here we use 13 years (1994–2006) of satellite precipitation, evaporation, and sea level data in an ocean mass balance to estimate freshwater discharge into the global ocean. Results indicate that global freshwater discharge averaged 36,055 km3∕y for the study period while exhibiting significant interannual variability driven primarily by El Niño Southern Oscillation cycles. The method described here can ultimately be used to estimate long-term global discharge trends as the records of sea level rise and ocean temperature lengthen. For the relatively short 13-year period studied here, global discharge increased by 540 km3∕y2, which was largely attributed to an increase of global ocean evaporation (768 km3∕y2). Sustained growth of these flux rates into long-term trends would provide evidence for increasing intensity of the hydrologic cycle. I suppose for those of us obsessed w/this subject the excitement lies in this being another phenomenon consistent w/expectations. For my part I would enjoy somebody doing an integration of this information w/OHC over the same time period. That might address possible overreach as exemplified by fydijkstra's remark.
    0 0
  12. I would enjoy somebody doing an integration of this information w/OHC over the same time period. Somebody qualified to do so, that is.
    0 0
  13. Re: mfripp (5) Thanks for pointing that out. Given the global nature of the datasets required, and that controls were made via satellite measurements (GRACE goes back to 2002, for example), it is of no surprise that this study focuses on the period it did. The availability of regional data, as you point out exists, does not help extend coverage into the global arena. Even if enough spacial coverage existed, too great of a separation in time from the control period covered by the satellites would diminish the accuracy of the portion greatest removed in time from the controls. I.e., the data needs to have a temporal vicinity to the satellite era. Great thought, though. This will be a nice tool for future monitoring usage. The Yooper
    0 0
  14. fdijkstra: Do we see here the confirmation of the pause in global warming since 1998? "Pause?" In the satellite data, the trend since 1998 is almost identical to the previous trend, except a little bit steeper: Figure 1. Satellite measurements of lower troposphere temperatures, 1979-1998 (blue) and 1999-2010 (orange). Courtesy RSS.
    0 0
  15. Lots of messy confounding issues here: (1) Pan evaporation rates have been reported to be decreasing not increasing, a reduction in windiness being a key driver - Roderick ML, Rotstayn LD, Farquhar GD and Hobbins MT. (2007) On the attribution of changing pan evaporation. Geophysical Research Letters VOL. 34, L17403, doi:10.1029/2007GL031166 (2) El Nino has changed position and intensity increased - Lee, T., and M. J. McPhaden (2010), Increasing intensity of El Niño in the central-equatorial Pacific, Geophys. Res. Lett., 37, L14603, doi:10.1029/2010GL044007. (3) Gedney et al initially postulated increased transpiration efficiency – more CO2 less water use – Gedney N, et al. (2006) Detection of a direct carbon dioxide effect in continental river runoff records. Nature 439:835–838. (4) Then Piao et al 2007 suggest both climate and land use change affect global runoff, with land use being half the increase. They refute Gedney et al. on CO2 saying increase in vegetation growth compensates for the CO2 anti-transpiration effect. (Shilong Piao, Pierre Friedlingstein, Philippe Ciais, Nathalie de Noblet-Ducoudré, David Labat, and Sönke Zaehle Changes in climate and land use have a larger direct impact than rising CO2 on global river runoff trends PNAS 2007 104 (39) 15242-15247; doi:10.1073/pnas.0707213104) (5) So we have a mixture of reduced evaporation, stronger El Nino hydrological cycle in Modoki mode position, CO2 anti-transpiration effects and land use change (clearing) ? How much is AGW? hmmmmmm
    0 0
  16. LukeW at 06:59 AM, I was about to post something on evaporation trends but see you have already taken care of that. The link below adds to your reference and sets out to try and correct some commonly held assumptions. River runoff is really only a by-product, it is dependent on a number of other factors, and anyway is only a calculation rather than an actual measurement. On the other hand, rainfall and evaporation are actually measured and any modeling can be verified by real data, but more than that they are the two critical components without which the hydrological cycle simply would not exist. Agro-ecological implications of change to the terrestrial water balance
    0 0
  17. And factor in Zhao and Running (2010) who show that plant growth actually appears to be declining slightly.
    0 0
  18. LukeW, Good points. Yes, a lot is happening. I would not trust the pan evaporation rates much (they do not reflect what happens over vegetated surfaces, and are notoriously error prone). Anyhow, the authors here specifically talk about increases in global-ocean evaporation as the SSTs increase (see their Fig. 2). Over land modeling ET is incredibly difficult and observing it using EC systems is not much easier, and data from the global FluxNet network are probably the best data that we have for ET from various biomes. Not sure if they have looked at trends-- they only have about 10 years of FluxNet data though. Yes, factoring in land use change is problematic. But don't forget that man made dams can also reduce run off by holding back some water. Fig. 2 in the Syed et al. paper shows that there is evidence of the hydrological cycle over the oceans/seas which cover about 70% of the planet (by only considering the oceans one avoids problems with land use change). Also, P - E < 0 (from their Fig. 2, E > P) over the oceans, which suggests that there must be increased precipitation over the land areas (b/c globally P-E should be ~ 0).
    0 0
  19. DSL at 08:12 AM, that study is looking at the effects of droughts which are short term and regional events. Both the lead article here, and the first paper referenced by LukeW at 06:59 AM indicate general increases in rainfall globally.
    0 0
  20. Albatross at 08:36 AM regarding E>P over oceans, do they indicate how E was determined? If the pan evaporation data was to be used directly, then over land E>P also, by a large factor. The trend is perhaps the most reliable indicator.
    0 0
  21. JohnD, From the paper: "Global-ocean evaporation estimates for the period 1994–2006 are obtained from SSM/I (2), OAFlux (23), and the Hamburg Ocean Atmosphere Parameters and Fluxes from Satellite data (HOAPS; 42) version 3, which is available only through 2005. All the evaporation datasets estimate the latent heat flux using the bulk aerodynamic formulation in order to compute ocean evaporation (2). Satellite observations of surface wind speed at the reference height, sea surface temperature and specific humidity of air near the sea surface are the key variables used in the formulation. Despite, the greater variance in the E estimates (see SI Text 2 and Fig. S5), the temporal variability of these datasets is consistent, with all monthly estimates within one standard deviation of their monthly ensemble mean. The average values of global-ocean evaporation ranges between 400,200 km3∕y (for SSM/I) and 415,900 km3∕y (for OAFlux)." Even allowing for this uncertainty E is still greater than P over the global oceans. "If the pan evaporation data was to be used directly, then over land E>P also, by a large factor." Not that I do not believe you, but which paper is that from?
    0 0
  22. Albatross at 09:53 AM, these maps from BOM perhaps best illustrate the difference. Note that it is E as measured by pan evaporation that is charted. I think that pan evaporation should exceed rainfall is something that should be self evident. Given that pan evaporation appears to be the only actual standardised physical measurement, at some point all other calculated values of evaporation under defined conditions such as Evapotranspiration (ET) must at some point be referenced back to such physical measurements. I note in the explanation you provided, it is E that is referred to, not ET, so I assume that it is being used to define the same E as BOM do, though that is not clear.
    0 0
  23. It is difficult to evaluate global water cycle based on observational data. The achievement of Syed et al. is great. (I am a bit ashamed that I have not published original results though I am purported as an expert in this field of science.) But it is a piece of science in action and it should not be considered as something definite. There is asymmetry in the situation of climate science. From theories, it is easier to discuss global phenomena. From observations, it is easier to discuss local phenomena. *** In the world of numerical climate models (which are based more on theories than on observations), the situation is clearer, but again somewhat confusing. I have watched simulations by all global climate models which participated in "CMIP3" collaboration (the same as which was used in IPCC AR4) in a certain scenario (A1B) of greenhouse gas emission for the 21st Century. As the global mean surface air temperature rises, global mean precipitation and global mean evaporation (which are nearly equal to each other) increase in all models. But the relative rate of increase is slower than that of global mean water vapor content in the atmosphere. Accordingly, the mean residence time of water vapor in the atmosphere becomes longer. In terms of mass flow per unit time, the water cycle accelerates. But in terms of efficiency of recycling, the water cycle decelerates. The results seem robust as far as the current generation of climate models are concerned. There is a small possibility that all models err similarly, because all models use hydrostatic approximation and (various kinds of) cumulus parameterization.
    0 0
    Moderator Response: Not to cause embarrassment or red ears, but let's acknowledge how privileged we are to have Dr. Masuda pay us a visit. We can best do so by applying our very greatest effort in formulating any questions we may have regarding the topic of this thread, the global hydrological cycle.
  24. Johnd @22, I get back to you tomorrow, have plans tonight.
    0 0
  25. Kooiti Masuda at 12:26 PM, Kooiti, even though it may not be within your direct field of interest, when the topic allows, it would be of interest to hear your perspective on the research being done at JAMSTEC on the Indian Ocean, and the IOD, and how it all fits into our current understanding of regional and global climate.
    0 0
  26. johnd's question to me seems off-topic here, but I try to answer for once. I know that JAMSTEC does both observational and modeling studies about the Indian Ocean, but I am not better at explaining them than the official web site. The Indian Ocean Dipole is an element of interannual variability, something in the Indian Ocean like El Nino in the Pacific. "IOD positive" means sea surface temperature is low near Sumatra (high near Kenya). "IOD negative" is the opposite. While oceanographers tend to view that IOD and ENSO are distinct things, I rather view that both are parts of the Southern Oscillation in the broader sense as first envisaged by Gilbert Walker in 1920s. IOD, as well as ENSO, is not a directly important element of climate change (of longer time scales), but the trends in how often positive and negative IOD events occur can be a subject of climate change with many people's interest. I think that some basic characteristics of the Indian Ocean are more important in the issue of climate change (as well as water cycle). One is that the seasonal reversal of monsoon is the most distinct here. Another is that the intertropical convergence zone can appear on the either side of the equator here. Also, Madden-Julian oscillation (a mode of intra-seasonal variablilty) is usually generated in the equatorial Indian Ocean.
    0 0
  27. Kooiti Masuda #23: "Accordingly, the mean residence time of water vapor in the atmosphere becomes longer." If I understand correctly, this model result is a consequence of the same thinking (based on the Clausius–Clapeyron relation) that suggests a warming atmosphere will hold a greater amount of water vapor... rather than an independent verification (since higher evaporation + longer water vapor residence would perforce mean more total water vapor) of it. Do the Syed et al results bring us closer to validating the assumptions underlying these water cycle models? To clarify where I'm going... water vapor feedback is one of the major factors in determining 'climate sensitivity'. I'm wondering if water cycle monitoring and/or modelling are now precise enough to validate the projected positive feedbacks from water vapor. I know that Roy Spencer has recently suggested that an accelerated water cycle might actually lead to negative water vapor feedback due to precipitation outpacing evaporation; "The average amount of water vapor in the atmosphere represents a balance between two competing processes: (1) surface evaporation (the source), and (2) precipitation (the sink). While we know that evaporation increases with temperature, we don’t know very much about how the efficiency of precipitation systems changes with temperature. The latter process is much more complex than surface evaporation (see Renno et al., 1994), and it is not at all clear that climate models behave realistically in this regard. In fact, the models just “punt” on this issue because our understanding of precipitation systems is just not good enough to put something explicit into the models."
    0 0
  28. Kooiti Masuda at 22:14 PM, Kooiti, thank you for your response,I hope that you become a regular visitor here. Though seemingly off-topic, understanding how such systems work or change over time is relevant to understanding the global water cycle. Not only for understanding how the cycle manifests itself under current climate conditions, but how it may manifest itself under changed conditions. I tend to agree with the oceanographers in that the IOD and ENSO are distinct entities as looking at them from the Australian regional view, being in the middle, the nett result delivered upon us will at times be due to them working in unison, feeding off one another, whilst at other times they are offsetting each other, with all sorts of combinations in between. This seems particularly evident when examining how drought develops over Australia, that perhaps giving some of the relevance to the water cycle. It is also relevant when considering whether or not everything that occurs in the region that is attributed to ENSO, may at times be attributable to the IOD thus perhaps downgrading the influence that ENSO is thought to have.
    0 0
  29. I did a blog post on climate change's impact on water resources that some may find useful: O Water, Water, Wherefore Art Thou Water?
    0 0
  30. Dr. Mandia, Thanks for that link @29. I forgot about Zhang et al. (2007), good paper. The observations (1925-1999)used in their paper show an increasing trend in zonally-averaged P (over land surfaces) in most latitude bands. The exception being 0-30 N, where data show a drying trend. Re Spencer. From what I know Scott, at least for thunderstorms, precipitation efficiency decreases as vertical wind shear increases. I am not aware of any papers which show a link between precipitation efficiency and temperature. That said, it is my understanding that a decrease in environmental lapse rates (i.e., leads to weaker updrafts and more entrainment)and/or a drier/warmer sub-cloud layer (more evaporation of precipitation) will reduce precipitation efficiency. Personally, I think that Spencer is being overly pessimistic. The land-surface component of the GCMs has received much attention in recent years. What they need to do is get the horizontal grid spacing down (to less than 20 km) so that they can use superior convective parameterization schemes and also better resolve convective systems (as well as eddies and currents in the oceans). Hopefully Moore's law continues to hold, b/c doing so is mostly a question of brute computing power.
    0 0
  31. Dr. Masuda, Thank you fro dropping by, very much appreciated.
    0 0
  32. Johnd and LukeW, Luke: "Pan evaporation rates have been reported to be decreasing not increasing, a reduction in windiness being a key driver" It is important to note that it has been demonstrated that pan evaporation can not be used to infer ET from the terrestrial land surface, especially vegetated surfaces. Brutsaert and Parlange (1998) showed that "although these studies are valuable, pan evaporation has not been used correctly as an indicator of climate change." Golubev et al. (2001, GRL) used parallel observations of actual evaporation and pan evaporation at five Russian experimental sites to callibrate the pan evaporation data. From their abstract "....we recalibrate trends in pan evaporation to make them more representative of actual evaporation changes. After applying this transformation, pan evaporation time series over southern Russia and most of the United States reveal an increasing trend in actual evaporation during the past forty years. " IMO, the take home message here is that pan evaporation data, while useful for some applications, should be used with caution when inferring trends in actual ET. Also, it is likely, that when handled properly, the pan data suggest that actual ET has actually been increasing. I cannot access the GRL paper by Roderick et al. (2007), so I am not sure if they considered or allowed for Golubev et al's or Brutsaert and Parlange's findings.
    0 0
  33. Johnd @22, "Note that it is E as measured by pan evaporation that is charted. I think that pan evaporation should exceed rainfall is something that should be self evident." Actually, it is not self evident that pan evaporation should exceed P. Pan evaporation is not the same as ET, in fact it is is more of a measure of the potential evaporation or atmospheric demand-- a theoretical measure which is very rarely achieved. So, again, it is best to use actual ET. Making the rather dangerous concession that pan evaporation can be used as a proxy for ET, we see (as you note), that in semi-arid areas (which large swaths of Australia are), P-E << 0. In contrast, in more moist climates, such as over extreme southeastern Australia, P-E ~ 0 or P-E > 0. See this paper for a more thorough discussion. Some researcher use the difference (or ratio) to identify semi-arid areas, for example. Or to distinguish between drought (P-E < 0) and pluvials (P-E > 0). See here for an example.
    0 0
  34. CBDunkerson (#27): Excuse me for not answering all of your questions. Water vapor content of air contacting sea surface follows Clapeyron-Clausius relationship. It is not guaranteed that total water vapor content in the atmosphere is proportional to it (i.e. average relative humidity is constant), but it seems to be valid in good approximation. It is something like an exponential function of temperature. On the other hand, evaporation is limited by energy available at the surface. I am confident that enhanced greenhouse effect yields more evaporation. Partly because increase of downward longwave radiation at the surface results in larger amount of energy potentially available for evaporation. Partly because higher temperature shifts the partition of the energy between latent heat flux of evaporation (LE) and sensible heat flux (H) more favourable to evaporation (i.e. lower Bowen ratio H/LE). But the increase by these two process combined is more like a linear function of temperature than exponential, so it is slower than the increase of water vapor content. So far I have been discussing global mean quantities. The variable shown in Syed's figure is the amount of flow of water from land to ocean. It is possible that the logic about global mean quantities applies here as well, but it is also possible that partition between land and ocean is more important than global mean.
    0 0
  35. Albatross at 04:08 AM, firstly my comment of pan evaporation exceeding P being self evident is based on the understanding that the conditions that cause moisture to evaporate in the natural environment do not cease once all available moisture has been consumed. I too view E as determined by pan evaporation as being a measure of the evaporation potential, and there I see it's value as being able to understand and quantify the components that drive evaporation, as well as track any trends, thus allowing any modeling formulated to be validated against standardised physical measurements. Fully understanding and quantifying those driving forces is important if the reasons for declining pan evaporation rates are to be found, and only then will it be able to be determined how those changes are manifesting themselves in other ways. So I do see that the trends in pan evaporation as being relevant, as well as important. Obviously the raw data produced by pan evaporation should not be used in any climate modeling because the moisture that it indicates as having been evaporated is not necessarily in the atmosphere. BOM use other terminology to define actual evaporation and that is why I wanted to know whether the E you referred to earlier was the same E as defined by others. The BOM definitions follow:- Evapotranspiration (ET)...is a collective term for the transfer of water, as water vapour, to the atmosphere from both vegetated and un-vegetated land surfaces. It is affected by climate, availability of water and vegetation. Areal actual ET ...is the ET that actually takes place, under the condition of existing water supply, from an area so large that the effects of any upwind boundary transitions are negligible and local variations are integrated to an areal average. For example, this represents the evapotranspiration which would occur over a large area of land under existing (mean) rainfall conditions. Areal potential ET ...is the ET that would take place, under the condition of unlimited water supply, from an area so large that the effects of any upwind boundary transitions are negligible and local variations are integrated to an areal average. For example, this represents the evapotranspiration which would occur over a very large wetland or large irrigated area, with a never-ending water inflow. A "large" area is defined as an area greater than one square kilometre. Point potential ET ...is the ET that would take place, under the condition of unlimited water supply, from an area so small that the local ET effects do not alter local air mass properties. It is assumed that latent and sensible heat transfers within the height of measurement are through convection only. For example, this represents the evapotranspiration which would occur from small irrigated fields with a never-ending water inflow, surrounded by unirrigated land. Point potential ET may be taken as a rough preliminary estimate of evaporation from small water bodies such as farm dams and shallow water storages.
    0 0
  36. Johnd@35, I was referring to evapotranspiration, ET. That is, the actual latent heat flux from the terrestrial surface. ET is also what the NWP models and GCMs simulate with varying degrees of sophistication.
    0 0
  37. Potential evaporation (or potential ET) is a hypothetical concept. Roughly speaking, it is amount of evaporation (including transpiration) assuming that the ground surface is always wet and all other things being equal as actual. But detailed definitions related to what I said "always wet" and "other things" are different from one author to another ... how to specify air temperature, humidity, wind speed, surface roughness, surface albedo, radiative energy input, etc. Also there are many different approximate ways to estimate it. So we need to be careful about the methods when we compare results of different authors. Conceptually it can be said that potential evaporation consists of two factors, energy input to the surface, and deficit of moisture in the air near the surface. And actual evaporation from land involves at least one more factor, availability of water on the ground (usually from the soil). Pan evaporation can be considered as a kind of potential evaporation, but not equal to its typical definition. Brutsaert considers that pan evaporation varies oppositely to actual evaporation. It is reasonable when moisture deficit dominates pan evaporation and it is mainly a result of actual evaporation. Situation may be different when moisture deficit does not vary much and changes in the energy factor is dominant.
    0 0
  38. Ned (#14) and Archiesteel (#10): Yes, there is a pause in global warming since 1998. Showing a rising trend 1994-2010 or 1979-2010 does not falsify the claim, that there is no warming since 1998. Almost every trend from an earlier year than 1998 to 2010 shows a rising trend, but even the most hard core climate scientists admit the pause since 1998. Remember the remarks in the ClimateGate e-mails: "it's a travesty that we can't explain it".
    0 0
    Response: The "travesty" quote by Kevin Trenberth is not talking about a pause in surface temperature warming. What's he's talking about is that we know our planet is in an energy imbalance due to model simulations, satellite measurements and rising sea levels. However, our observation system is unable to account for all the heat accumulating in our climate. The full context of Trenberth's quote is discussed in "Trenberth can't account for the lack of warming" or if you want to get it from the horse's mouth (apologies to Dr Trenberth for the metaphor), I suggest reading the original paper that the quote referred to: An imperative for climate change planning: tracking Earth's global energy (Trenberth 2009).
  39. fydijkstra, also the 'it has not warmed since 1998' fiction can be discussed here, here, or here.
    0 0
  40. @fydijkstra, I have responded to your false claim that there has been no warming since 1998 here.
    0 0
  41. The water cycle is SLOWING, not accelerating according to NCAR: http://feww.wordpress.com/2009/04/22/surprise-worlds-largest-rivers-drying-up/ "Climate change drying up world’s 925 largest ocean-reaching rivers. About 72 percent of the world’s 925 largest ocean-reaching rivers are drying up, most of them because of the climate change, according to a report by National Center for Atmospheric Research, Boulder, Colorado." and "Annual freshwater discharge into the world’s oceans decreased during the 1948–2004 research period as follows" And here's a graph of global freshwater discharge from a 2010 study by Trenberth. It tells a rather different story than the Syad2010 that is the topic of this post. source: http://www.cgd.ucar.edu/cas/Trenberth/trenberth.papers/ClimateChangeWaterCycle-rev.pdf
    0 0
  42. #2 Spencer Weart at 02:49 AM on 8 October, 2010 says "Yes, too noisy to say anything very strong about a trend; the statistics must be marginal. Too soon to declare this another sign of AGW, it would be embarrassing if a couple years from now the trend turns down... " Au contraire, the paper claims the trend is very strongly supported by statistics, p<0.001. Actually they declare not one but THREE trends, all p<0.001. You don't have to wait a couple of years for a downtrend. The paper found a downtrend for the last 7 years of the study period, with significance p<0.001. "An increase in the ensemble mean of R is evident from 199412–199906 (2,904 km3∕y2; p < 0.001), followed by a decreasing trend (−756 km3∕y2; p < 0.001) through the end of the study period (199907–200611). The trend for the entire 199412–200611 study period is 540 km3∕y2 (p < 0.001)."
    0 0
  43. Syed et al. say that the trends of global mean discharge are statistically significant. It is surely true. But, the values they obtained for different periods vary wildly without understandable reason. As I look at their Fig. 2A, my impression is that there is no consistent trend. The part of year 1993-2005 of the figure which Charlie A quoted from Trehberth's paper is similar in a sense that there is no obvious trend, though its year-to-year peaks and valleys do not always match those of Syed et al. On the other hand, my impression of Syed et al.'s Fig. 2B is that the global mean evaporation from the oceans has a consistent positive trend in the 1993-2006 period, though I am not sure if the trend is attributed to enhanced greenhouse effect or multi-decadal variability. Evaporation from the ocean is a dominant part of the global total evaporation, which represents the largest scale of the global water cycle. On the other hand, the global total river runoff represents the partition between land and ocean -- one step smaller scale than the global mean. It seems (to me) that the trends in the actual water cycle is simpler in the global scale than in more detailed scales.
    0 0
  44. Climate scientists are able to work wonders with numbers. In spite of the wild variations without understandable reason, Syed & Famiglietti were able to extract highly significant trends (actually 3 trends for each parameter..... One for an early period. A second trend in the opposite direction for the a later period. And a third trend for the entire period. 7 of the trends were p<0.001, 2 of the global precip trends were only signficant to p<0.01) for each of the parameters. This is amazing for those parameters which are small differences of large quantities with significant variation and errors. For example, the discharge (R) is the (delta in ocean mass) + (global ocean evaporation) - (global ocean precip). It is also striking that Syed and Famiglietti were able to detect trends much smaller than the variances between the multiple observational datasets of the same parameter, such as the global ocean evaporation (HOADS, SSM/I, and OAFlux). (See table S1). As I noted above, the discharge (R) has both an upward trend in the first 4-1/2 years, then a downward trend in the last 7 years, and an overall trend over the entire period that is upward. The summary below only lists the overall 1994-2006 trends, although Syed and Famiglietti show 3 significant trends for each parameter in Figure 2. Discharge (R) Mean 36;055 km3∕y Std dev 16;164 km3∕y trend 540 km3∕y2 Evaporation (E) (SSM/I, OAFlux, & HOAPS) Mean 409,152km3∕y std dev 10;236 km3∕y trend 768 km3∕y2 Precipitation (P) (GPCP & CMAP) mean 374;220 km3∕y std dev. 14;221 km3∕y trend 240 km3∕y2 Global-ocean mass change (ΔM∕Δt) (GMSL minus steric sea surface height) mean 1;044 km3∕y std deviation 14;328 km3∕y trend 23 km3∕y2
    0 0

You need to be logged in to post a comment. Login via the left margin or if you're new, register here.


The Consensus Project Website

THE ESCALATOR

(free to republish)


© Copyright 2025 John Cook
Home | Translations | About Us | Privacy | Contact Us