Observations of past climate change help rule out natural causes of current climate change
Posted on 20 November 2020 by ScottKnapp
This post is an updated intermediate rebuttal to the myth "climate is changing now because climate has always changed". It was written by Scott Knapp as part of the George Mason University class Understanding and Responding to Climate Misinformation, combining climate science and communication best practices to debunk common climate myths.
The total rate of global warming observed since the industrial revolution can only be explained by the observed excess of CO2 in the atmosphere. The excess of CO2 can only be explained via human sources. Let us first examine the post-industrial revolution warming and some of the telltale signs that humans are responsible.
The human fingerprint
How can we be sure that humanity’s release of greenhouse gases are to blame for the observed rise in global temperature? First, let’s look at evidence showing that greenhouse gases are causing the current warming. Then we will explore how we know that the recent increase in greenhouse gases is due to human activity.
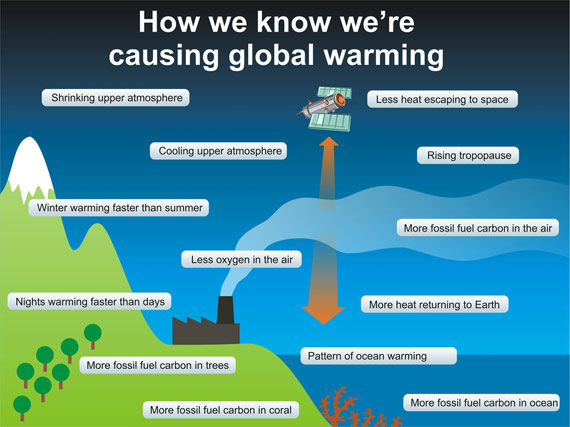
Greenhouse gases like CO2 are understood quite well, so we can make predictions about what we should observe. When CO2 is added to the atmosphere, it causes the lower atmosphere (aka the troposphere where we live and experience its weather) to warm. This warming occurs because the added CO2 traps infrared heat emitted from the Earth's warm surface - heat that would otherwise escape to space. However, in the stratosphere, above the troposphere, adding CO2 to the atmosphere causes it to cool. This is because the extra CO2 in the stratosphere radiates more heat to space. The stratosphere has been cooling in recent decades, as atmospheric CO2 increases. This also rules out the sun, as an increase in solar energy would heat the whole atmosphere.
Another example, predicted by Arrhenius in 1896, states that winters should warm more than summers. Hemispheres receive less sunlight in winter and cool down by radiating energy away into space. If greenhouse gases were increased, they would act to prevent some of that energy from radiating away, thus warming the winter hemisphere. The warming effect on winter was predicted to be greater than that of summer. Again, this is observed.
It is also possible to use statistical techniques, like detection and attribution studies, to compare the relative contributions of various factors (such as greenhouse gases, aerosols, etc.) towards the recent global warming trend. These too show that the recent global warming trend cannot be explained without the additional greenhouse gases humans have released into the atmosphere.
Given that the warming is caused by greenhouse gases, how do we know that human CO2 emissions are specifically to blame for their sudden increase? This too can be quantified.

Figure 1. Examples of human fingerprints on global warming. Source
We have accurate estimates of how much CO2 we release each year, and we also have a good understanding of the natural annual variability of CO2. Although the land and ocean are absorbing CO2 all the time, it is not enough to prevent the increase of atmospheric CO2. There is currently more CO2 being put into the atmosphere annually than natural processes can remove. One way to observe the ocean absorption of CO2 is by the increasing acidification of ocean water.
Additionally, the average atomic weight of atmospheric CO2 is observed to be decreasing. The carbon atom in CO2 can have different amounts of neutrons in its nucleus, a difference we can measure. Of the three main reservoirs of CO2—plants, water, and air—plants have a detectably lighter average weight of CO2. This indicates that much of the atmospheric CO2 is coming from a plant based source. Fossil fuels, the primary source of greenhouse gas emissions, are made of fossil plants, and therefore contain the lighter average atomic weight of CO2.
There are other examples of human fingerprints, like the depletion of atmospheric oxygen due to combustion or nights warming faster than days, which confirm our scientific understanding. The planet is warming unnaturally fast, and the only explanation is the excess release of greenhouse gases like CO2 by humans.
The myth commits the single cause fallacy
Now let’s take a closer look at the myth. The myth that current climate change is natural because past climate changed naturally makes an implicit, and incorrect, assumption. It assumes that because the climate has changed from natural causes before, it can only be changing from natural causes now. This is committing what is known as the single cause fallacy. As the name suggests, this is when a phenomenon is falsely attributed to a single cause, even though other causes are possible. It would be similar to saying that smoking cannot cause cancer because people were getting cancer before cigarettes were invented. In the following sections we will look at different examples of past climates commonly used in the myth.
Previous warm climates and energy balance
One version of this myth compares current climate to past periods where CO2 levels were comparable but temperatures were different - this is meant to sow doubt about the legitimacy of CO2 as a driver of climate change. However, this discrepancy can be explained by the process of energy balance.

Figure 2. Global average temperature relative to 1960-1990 average in degrees Celsius (Larger Image).
Figure 2 shows that there were only a few periods in the past million years that briefly had temperatures warmer than today (those are related to orbital changes, which will be discussed later). However, if we want a period with sustained temperatures warmer than today, we need to go back at least three million years. This period, the Pliocene, had CO2 levels comparable to today’s at around 400 parts per million (ppm), yet had average global temperatures approximately 1.8°C - 3.6°C warmer than today. It may seem odd that a similar CO2 amount would be so much warmer. This reflects the concept of energy balance.
The average temperature of Earth is dependent on the balance between incoming and outgoing energy in the form of radiation. Energy comes in from the sun, and energy leaves when the surface radiates it back into space. If the incoming and outgoing radiation are equal, the global temperature will remain the same. If either the incoming or outgoing radiation amount changes, the temperature of Earth will slowly increase (net energy in) or decrease (net energy out) until a new balance is reached. So-called “greenhouse gases” - like CO2 - trap radiation on Earth, reducing the amount of outgoing radiation. If we reduce the energy out, while the energy coming in has not changed, there is now more energy coming in than going out. In order to reach a new balance, the planet must heat up until it is radiating enough energy out to restore balance.
The process of achieving energy balance of the coupled ocean-atmosphere system takes roughly a few thousand years. So how was the Pliocene warmer than today if it had a similar CO2 level? When we look at temperature records reflecting thousands or millions of years, we are looking at values which represent an Earth in energy balance. Right now, the CO2 in our atmosphere has increased more than 40% in just over 100 years. We are still out of balance and will need many hundreds or thousands of years to get back to balance via an increase in global temperature. This means that even if CO2 stopped rising right now, we have already locked in gradual warming for hundreds of years as the oceans slowly warm.
Ice ages and Earth’s orbit
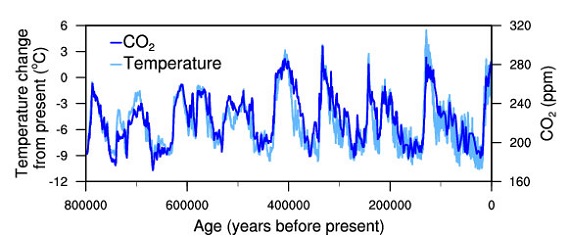
The up and down temperature patterns seen from the present to about one million years ago in Figure 2 represent what are known as the ice ages. Graphs like these are used in support of the myth; proof that the climate is always changing. Their regular intervals are explained by regular changes in Earth’s orbit, known as Milankovitch cycles. When the orbit changes so that the Earth is receiving significantly less energy from the sun during summer in the northern hemisphere, the polar ice caps expand towards the equator, cooling the planet. Cooler oceans can hold more dissolved gas, so some of the CO2 that was in the atmosphere moves into the ocean. This helps cool the planet further as greenhouse gases are removed from the atmosphere. When the orbit begins changing back, the opposite happens. This relationship is clear when looking at the ice core data in Figure 3.

Figure 3. Temperature change (light blue) and carbon dioxide change (dark blue) measured from the EPICA Dome C ice core in Antarctica (Jouzel et al. 2007; Lüthi et al. 2008). The 0 on the x-axis corresponds to 1813 (NOAA).
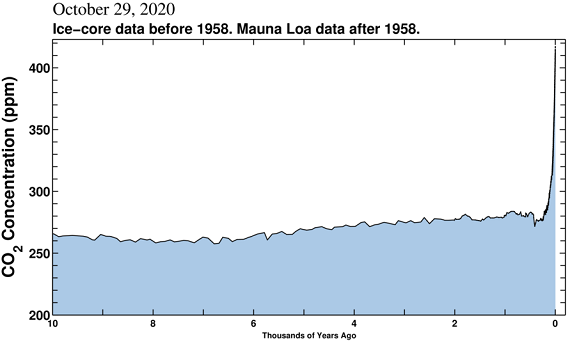
Figure 3 contains data from the past 800,000 years, but stops at the year 1813, before the Industrial Revolution. Without looking at data from the past 150 years, it appears that we are currently at the peak of the latest cycle and should expect the global temperature and CO2 levels to plateau or begin to fall. However, if we zoom in on the past 10,000 years and include modern data, as in Figure 4, we see CO2 gradually rising about 10-15 ppm before suddenly spiking in the last 150 years. Look again at Figure 3 and be sure to note the scales of both the time and CO2 changes. The largest changes in CO2, going from about 200 ppm to 300 ppm, all take upward of 10,000 years. In Figure 4, we see a change from about 280 ppm all the way up to 410 ppm occur in less than 200 years. Both the size and the speed of the modern change in CO2 is totally unprecedented in at least the past 800,000 years!

Figure 4. Atmospheric CO2 concentration taken from ice-core data over the past 10,000 years. (Scripps Institution of Oceanography)
Medieval Warm Period and Little Ice Age
Around the years 950-1200 CE, temperature reconstructions show that parts of the Northern hemisphere experienced moderate warming, often referred to as the Medieval Warm Period (MWP) or the Medieval Climate Anomaly (MCA). From roughly 1450-1850 CE, both hemispheres experienced moderate cooling. This became known as the Little Ice Age (LIA). Although these periods are sometimes characterized as proof that modern climate change is a natural fluctuation, that claim is difficult to support. The exact amount, timing and cause of the temperature changes are not agreed upon. Simulations with varying solar intensity and volcanic forcing seem to replicate some of the changes, but are not conclusive. On the contrary, the temperature changes since the industrial revolution are known quite well, along with the solar and volcanic forcings. Those forcings can confidently be rejected as causes for the observed increase in temperature in the past 150 years. The MCA and LIA are examples of natural climate variability, and they do not conflict with our understanding of modern climate change.
Conclusion
To summarize, none of the mechanisms which facilitated previous climate change can explain the rapid rise in both CO2 and temperature observed over the past 150 years. However, human-released CO2 explains both!


 Arguments


Comments