


 Arguments


Climate change: sea level rise could displace millions of people within two generations
Posted on 11 June 2019 by Guest Author
Jonathan Bamber, Professor of Physical Geography, University of Bristol and Michael Oppenheimer, Professor of Geosciences and International Affairs, Princeton University
This article is republished from The Conversation under a Creative Commons license. Read the original article.
Antarctica is further from civilization than any other place on Earth. The Greenland ice sheet is closer to home but around one tenth the size of its southern sibling. Together, these two ice masses hold enough frozen water to raise global mean sea level by 65 metres if they were to suddenly melt. But how likely is this to happen?
The Antarctic ice sheet is around one and half times larger than Australia. What’s happening in one part of Antarctica may not be the same as what’s happening in another – just like the east and west coasts of the US can experience very different responses to, for example, a change in the El Niño weather pattern. These are periodic climate events that result in wetter conditions across the southern US, warmer conditions in the north and drier weather on the north-eastern seaboard.
The ice in Antarctica is nearly 5km thick in places and we have very little idea what the conditions are like at the base, even though those conditions play a key role in determining the speed with which the ice can respond to climate change, including how fast it can flow toward and into the ocean. A warm, wet base lubricates the bedrock of land beneath the ice and allows it to slide over it.
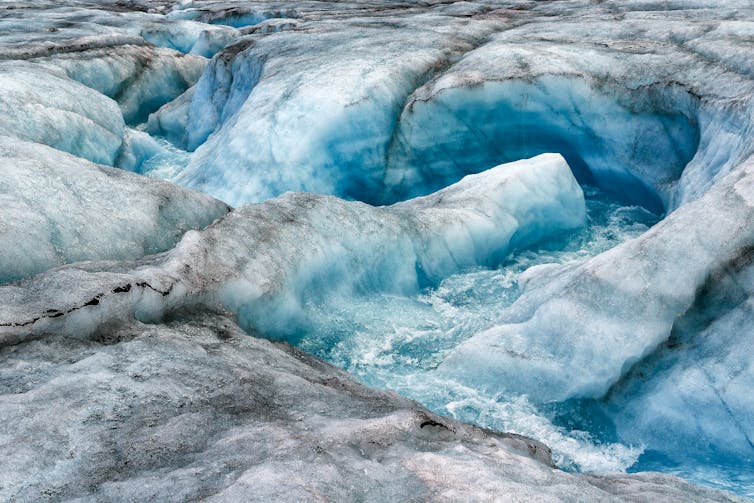 Though invisible from the surface, melting within the ice can speed up the process by which ice sheets slide towards the sea. Gans33/Shutterstock
These issues have made it particularly difficult to produce model simulations of how ice sheets will respond to climate change in future. Models have to capture all the processes and uncertainties that we know about and those that we don’t – the “known unknowns” and the “unknown unknowns” as Donald Rumsfeld once put it. As a result, several recent studies suggest that previous Intergovernmental Panel on Climate Change reports may have underestimated how much melting ice sheets will contribute to sea level in future.
What the experts say
Fortunately, models are not the only tools for predicting the future. Structured Expert Judgement is a method from a study one of us published in 2013. Experts give their judgement on a hard-to-model problem and their judgements are combined in a way that takes into account how good they are at assessing their own uncertainty. This provides a rational consensus.
The approach has been used when the consequences of an event are potentially catastrophic, but our ability to model the system is poor. These include volcanic eruptions, earthquakes, the spread of vector-borne diseases such as malaria and even aeroplane crashes.
Since the study in 2013, scientists modelling ice sheets have improved their models by trying to incorporate processes that cause positive and negative feedback. Impurities on the surface of the Greenland ice sheet cause positive feedback as they enhance melting by absorbing more of the sun’s heat. The stabilising effect of bedrock rising as the overlying ice thins, lessening the weight on the bed, is an example of negative feedback, as it slows the rate that the ice melts.
The record of observations of ice sheet change, primarily from satellite data, has also grown in length and quality, helping to improve knowledge of the recent behaviour of the ice sheets.
With colleagues from the UK and US, we undertook a new Structured Expert Judgement exercise. With all the new research, data and knowledge, you might expect the uncertainties around how much ice sheet melting will contribute to sea level rise to have got smaller. Unfortunately, that’s not what we found. What we did find was a range of future outcomes that go from bad to worse.
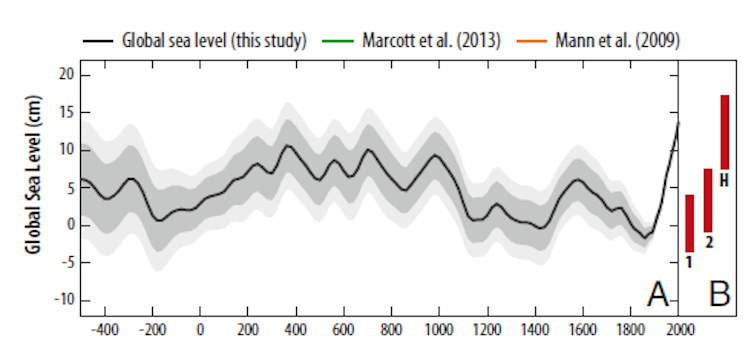 Reconstructed sea level for the last 2500 years. Note the marked increase in rate since about 1900 that is unprecedented over the whole time period. Robert Kopp/Kopp et al. (2016), Author provided
Rising uncertainty
We gathered together 22 experts in the US and UK in 2018 and combined their judgements. The results are sobering. Rather than a shrinking in the uncertainty of future ice sheet behaviour over the last six years, it has grown.
If the global temperature increase stays below 2°C, the experts’ best estimate of the average contribution of the ice sheets to sea level was 26cm. They concluded, however, that there is a 5% chance that the contribution could be as much as 80cm.
If this is combined with the two other main factors that influence sea level – glaciers melting around the world and the expansion of ocean water as it warms – then global mean sea level rise could exceed one metre by 2100. If this were to occur, many small island states would experience their current once-in-a-hundred–year flood every other day and become effectively uninhabitable.
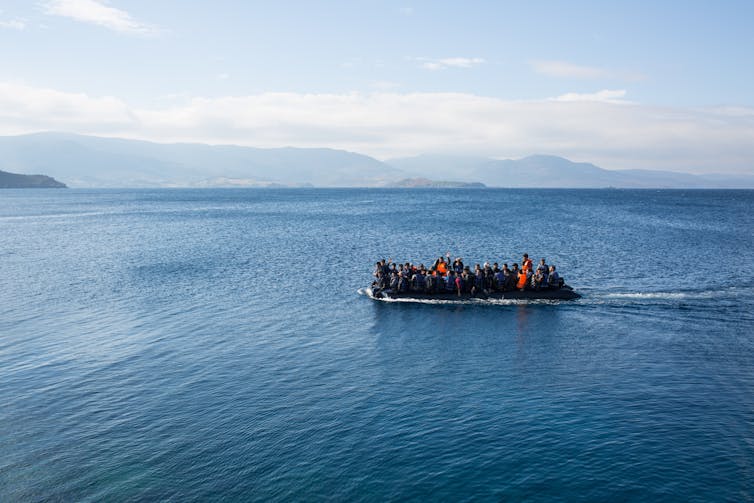 A climate refugee crisis could dwarf all previous forced migrations. Punghi/Shutterstock
For a climate change scenario closer to business as usual – where our current trajectory for economic growth continues and global temperatures increase by 5? – the outlook is even more bleak. The experts’ best estimate average in this case is 51cm of sea level rise caused by melting ice sheets by 2100, but with a 5% chance that global sea level rise could exceed two metres by 2100. That has the potential to displace some 200m people.
Let’s try and put this into context. The Syrian refugee crisis is estimated to have caused about a million people to migrate to Europe. This occurred over years rather than a century, giving much less time for countries to adjust. Still, sea level rise driven by migration of this size might threaten the existence of nation states and result in unimaginable stress on resources and space. There is time to change course, but not much, and the longer we delay the harder it gets, the bigger the mountain we have to climb.


Island nations in the Carribean, Pacific and SE Asia are at particular risk from rising seas, and many of these are near the tropics so also at risk from more heatwaves. People from the Caribbean could probably be accommodated in the Americas, but the numbers at risk in places like Indonesia, Malasia and Taiwan is larger and going to cause some real refugee problems, especially for adjacent potential destination countries like Australia, China, Myanmar, Vietnam which are also particulary vulnerable to sea level rise and already have huge population pressures of their own.
It's not going to be easy to resolve such issues on top of exising refugee problems caused by natural disasters, economic and political problems. Climate change could tip all this so it spirals out of control.
This is an interesting post and it's good to know that people in the field are continuing to collect information and re-think climate change and sea level rise in particular. However, the earth could also be hit by an asteroid large enough to wipe out civilized life - there are still rocks out there that haven't been detected. There are a couple of things about the asteroid problem that are different: (1) there's not much we can do about an asteriod threat and, (2) those predicting possible asteriod threats put some fairly good error bars on their predictions. Thing is, you can always predict possible disaster ... like maybe a volcano suddenly building under Seattle, but if you can't put error bars on the prediction then the prediction is worthless. Seems like this post suggests high risk with associated extremely high and completely unquantified uncertainty.
Note the error bars on the graph of reconstructed sea level and how those bars diminish to zero at present day. That graph does not say that sea level is currently higher than it's been in 2500 years. It says that sea level might be higher than it's been in 2500 years with the uncertainty large in the far past. Peaks in things like sea level and climate temperature will be naturally diminished when tracked, via proxies, far into the past because the measurement methods do a natural averaging. Averaging always diminishes peaks and toughs.
That graphic is from Kopp et al 2016. From that paper:
Extremely likely = 95%.
We know that in the early 20th Century, about one-third of the observed warming is from human activities. This corresponds well to the observations from Kopp et al 2016. However, since 1950, pretty much all of the observed warming is from human activities. Thus, the closer we get to the present the greater the human-driven component of the knock-on effects of that warming (like SLR from land-based ice sheet mass losses due to that warming) becomes.
Per Slangen et al 2016,
Anthropogenic forcing dominates global mean sea-level rise since 1970
Takeaways:
higgijh @2, your contention that theres not much we can do about an asteroid threat is not matched by reality. NASA has a substantial programme monitoring asteroids, and NASA has a well advanced programme to deflect an asteroid here.