


 Arguments


SkS Analogy 7 - Christmas Dinner and the Faux Pause
Posted on 9 June 2017 by Evan
Tag Line
Saying “No warming” since the last El Nino is like
Saying “No weight gain” since the last Christmas dinner.
Elevator Statement
On Christmas eve you eat a big dinner, with lots of seconds, gravy, ooey gooey sweet potatoes with more sweet than potatoes. After the monster dinner, generous helping of pie, ice cream and lots more. You weigh yourself after the “dinner”. The next morning you find creative ways to get rid of the food you “ate” the night before, all of it (and more) ending up in the “waste” bin. You weigh yourself again, for comparison.
Hurrah, a new weight-loss technique. How to lose 5 lbs. (or more) in one delightful day. For the next month you note that you have not gained a single ounce since that gorging Christmas dinner. In fact, you’ve managed to keep your weight below the Christmas-eve measurement. Weight-loss is easy: just push your weight up momentarily to some unsustainably high weight, and then eat a more modest diet thereafter.
This tale would seem absurd, except this is exactly what educated, well-paid senators of the USA say on a regular basis. They substitute 1998 (the year of a monster El Nino) for Christmas dinner, they substitute temperature for body weight, and then say “No warming in __ years”, and neglect to note that the start of the “arbitrary” time period they’ve chosen was a monster El Nino. This Zombie Myth keeps on walking, eating the brains of many, despite the fact that we’ve notched record warm years 3 years in a row (i.e., 2014, 2015, and 2016). With the record warmth we’ve had, it’s possible we’re in the middle of the next Christmas “Dinner”.
Climate Science
Our bodies and the earth go through many cycles. We drink a cup of coffee, gaining a small amount of weight, and then a couple of hours later we lose that weight. We eat a meal, and then within 24 hours we lose the weight of that meal. We drink, we sweat. We eat, we burn calories by maintaining our bodies. We eat a lot, we exercise a lot. Our bodies have cycles that last hours, days, weeks, months, and one of the longest cycles that lasts nine months. We have random cycles associated with illness that also affect our weight. We know that the ups and downs of our weight due to these cycles has nothing to do with our average weight. In addition to all of these transient cycles, there may be an underlying, long-term weight gain or loss that requires long-term weight measurements to separate from the “noise” of the other cycles.
The earth is the same, and there are many cycles that affect temperature. Daily cycles with the rising and setting of the sun, weekly cycles associated with weather, monthly cycles associated with seasons, yearly cycles associated with slowly changing ocean currents, decadal cycles (i.e., cycles with a period of about 10 years) associated with the activity of the sun, etc. There are also random cycles that affect the temperature, such as volcanoes that periodically burp.
One of the strongest cycles is associated with ocean currents, such as El Nino and La Nina. El Nino is a set of conditions that bring warm ocean water to the surface, releasing large amounts of energy from the ocean to the atmosphere, warming the air. La Nina is the opposite, creating a set of conditions that bring cooler ocean waters to the surface, cooling the air. El Nino conditions can cause global average temperatures to “temporarily” increase by about 0.2C, but usually when the El Nino subsides, the air temperatures cool off. Typically neither the temperature increase of El Nino nor the temperature decrease after El Nino or during La Nina are indicative of long-term trends in average global temperature, but instead simply represent a temporary increase or decrease of global average temperature.
The exception to this is that during extended periods between El Ninos when the ocean currents keep relatively cool water on the surface, much heat goes into the oceans. During subsequent El Ninos, much of the heat stored in the oceans during the cooler phases comes out, causing a step increase in global average temperature. El Ninos can therefore mark a sudden increase in temperature, but what they are doing is releasing energy from the oceans that has been stored continuously over many years. Therefore, the best way to look at long-term trends of atmospheric air temperatures is to plot data over many decades: looking at temperature data over time periods of 10 years or less can lead to erroneous conclusions, such as “global warming has stopped.” To see how this works, consider the GISS temperature record, created by SkS to show how embedded within a trend of rising temperature there are periods of apparent cooling.
The "Faux Pauses" result because of cherry picking the data. Just like weighing yourself after going to the bathroom and being concerned that you have lost weight.
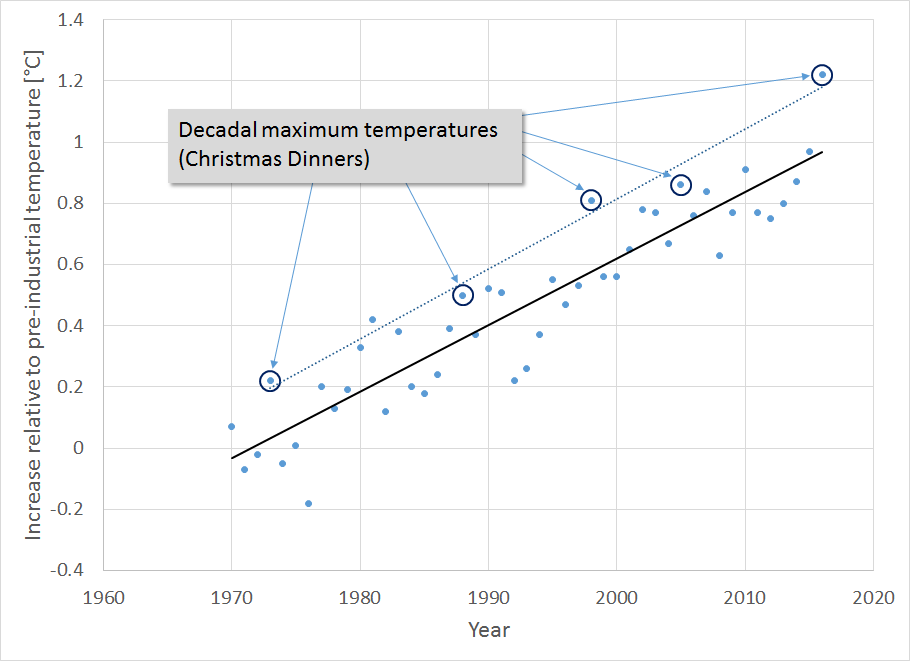
Another view is to plot temperature data and to note the decadal high temperatures, as follows. The circled data points represent the high temperatures within each decade (i.e., 1970-1979, 1980-1989, ...). We show the data for 2016 temperature assuming that it will likely be the high temperature for the 2010-2019 decade. What is interesting is that the line through the decadal high temperatures rises at the same rate as the line through all of the temperature data. This is like recording your weight after Christmas Dinner every year, and then noting that your Post-Christmas-Dinner Weight tends to follow your true weight, but is shifted up by a few lbs. Whereas Christmas Dinner occurs at the same time every year, the decadal maximum temperatures do not occur equally spaced (i.e., 10 years apart), because the random behavior of atmospheric and ocean currents, as well as solar cycles, means that the year within a decade when the maximum temperature occurs is somewhat random.
The climate is warming. Increased temperatures are dangerous. CO2 is the cause. The solution is to emit less CO2 and other greenhouse gases.


Good article, but the weight loss analogy is rather complicated and convoluted. The more technical explanation in the article following this was fine and easy to follow. I don't think the temperature trend and so called pause is an issue that suggests a good, simple, useful analogy.
I think instead your technical explanation was enough. Most people would grasp that you can have one longer term trend modulated by other shorter term trends. There is also the issue that there was no pause in ocean temperatures.
The problem was more one of scale. The denialists distorted things to make an approximately 8 year pause sound like a very long pause of 17 years by cherry picking 1998 as a starting point and cherry picking what temperature data they used. I think the public would have have some intuitive insight that 17 years looks suspicious, but 8 years or so is not unexpected.
You are right to call the denislists out on this dubious sort of interpretation. It's basically an exaggeration fallacy.
To extend your Christmas dinner analogy, suppose you went to your doctor and he asked if you were gaining weight. 'No', you say brightly, 'I measure the circumference of my left wrist each day, and it has remained the same since last Christmas'. 'Perhaps you should measure your waist instead', says doc. 'My waist is covered in clothing', you retort, 'that's too difficult'. Your doctor measures your waist and reports unhappily that, despite the evidence of your wrist, you never really stopped expanding since last Christmas (this analogy communicates that evidence of global warming is more accurately determined by sampling the ocean than the air, even if it requires more work).
nigelj@1 and ubrew12@2. I like your suggestions to focus on the oceans as well, and the idea of wrist vs. waist is interesting. I think what you are both saying as well is that most people simply don't think about the temperature of the ocean. The reason for focusing on the body weight is that I felt this is something that all people understand, and intuitively people differentiate between signal and noise, even though they don't know that's what they're doing.
Using the wrist/waist reference takes the analogy in a different direction, but one that is equally important. For this direction (informing people that the temperature of the oceans is also important) others have used sea level rise in the 20th century as an indication that ocean temperature is rising, just like mercury in a thermometer rises (expands) as it warms.
If you want to make the point that short-term noise doesn’t negate the long-term climate trend, maybe the best analogy is daily temperatures vs. the seasons. Just as manmade GHGs now are the main global climate forcing on a decadal to century time scale, the shifting distribution of insolation is the main seasonal forcing. Clearly that doesn’t mean that every day during the spring is warmer than the previous one – a few colder days doesn’t mean that the coming summer is cancelled.
To test this pretty obvious concept, I checked the average daily temperatures at my local weather station here in south-eastern Norway from March 1 to May 31 this year. It turned out that of these 92 successive days, only 45 were warmer than the previous one while 45 were colder and 2 the same, and there was nearly no warming the first three weeks of April. The long "hiatus" in April didn’t prevent the overall temperature to rise about 15oC from early March to late May.
This shows that as long as the underlying forcing keeps on increasing, the warming will continue despite some ups and downs that are mostly caused by redistribution of heat within the climate system.
Logic and science work only for the study of nature, they are not how people work. They're also unpopular with most people, who are both uwilling and also unable to apply them to most issues. That works out well in general, because most issues (how to attract a mate, raise children, etc) aren't logic problems. If we ask people who were promoted as tribal leaders to suspend the normal way of doing things (noise, persuation, charm) and be nerds, we can expect a chilly reception at best.
Only when people believe there's something in it for them, their identity group or same cause they adhere to (Gaia, Jesus, USA, their investments etc) will they suspend looking for ways to reinforce what they already believe and even attempt to follow the foreign thought process of observation, testing and deduction.
But climate is not an obvious process you can demonstrate on a tabletop, so it will again come to whether a pol will listen to the wizards who interpret heirogyphics. They'd sooner swim through a sewage pipe than slog through the neccessary background to verify the science themselves.
Evan @3, most of your analogies have been good, but for me your xmas dinner analogy was just too long and complicated. I feel the purpose of an analogy is to take complicated stuff and make it simple, and most are short sentences or words or a simple sequence of events. You took the pause idea and actually made it more complcated for me. Of course this is just my opinion.
The ocean heat content wrist / waist anaology above is very clever and maybe a better analogy, although its probably still more of a clever read, and preaching to the converted.
The seasons analogy above works much better for me, and takes a familiar and simple aspect of climate and builds on that.
I got plenty out of the rest of your article, and its bang on. The pause is a huge issue that has been discussed a lot, and the reasons for it seem quite complicated. As far as I can understand it is a lot to do with cyclical ocean processes, but with a low point in the sunspot cycle adding to that. Frankly I dont think its 100% understood, so that makes any analogy even harder.
But the pause is certainly at least 75% understood in my opinion.The el nino cycle can affect things for about ten years and is a powerful cycle. So hopefully people can understand that a long term warming trend from greenhouse gases will look sort of like like an upaward tilted sine wave graph as a result of el nino etc. There are other ocean cycles of about 20 years but they are a bit weaker. Theres a lot going on summed up as short term noise in the context of century long timescales. The denialists know this, but twist these issues to create as much doubt as possible
Driving by @5, yeah true. We work a lot in our daily lives on a combination of reason and a great deal of intuition or gut feelings. It would not be practical to deeply analyse everything especially if we are under threat and quick decisions are needed.
Gut feelings can be wrong of course, but its sometimes all we have.
However I was reading this a few weeks age from Science Daily. Gut feelings are more than just a hunch in terms of reactions to people. They are reliable in certain situations:
www.sciencedaily.com/releases/2008/03/080305144210.htm
It appears gut feelings are reliable or appropriate for some things and not others, which of course complicates the picture.
However even science often starts with little more than an intuition, which is sort of a gut feeling. The difference is science them rigorously tests those intuitions. This is where the general public (and politicians) get lazy they aren't prepared to rigourously logically test their gut feelings or intuitions.
nigelj@6. Thanks for your input. I am likely to leave the Christmas Dinner analogy as is, but will take your input into consideration to try to simplify future analogies. In other words, for each topic, there may be several analogies that need to be formulated, at different levels of detail, similar to the SkS method of writing Basic, Intermediate, and Advanced rebuttals. To reach the maximum number of people, we need multiple approaches, and I appreciate input about the point at which an analogy gets too long and complicated.
Evan @ 8, yeah I totally agree about a couple of different levels of analogies for people with different levels of interest in climate change. For example, the blanket analogy is a good simple greenhouse gas analogy, but there are more complex ones that can be illuminating as well. I suggest your articles could discuss both levels of analogy for whatever issue within the same article.
I know some people say analogies dont work, or don't convince, but I strongly feel they have a place. For example I recall reading a popular book on relativity and quantum physics using the bending or warping of space time analogy for general relativity. Frankly I didn't do enough advanced maths to fully understand these general relativity theories, and it can only really be decribed with maths ultimately, but how many people have the time to study that? So there is no alternative but an analogy! The terms bending or warping are as near as you can get to whats going on in a way that gives some level of insight.
After reading Rahmstorf, Foster, and Cahill (2017) link I wrote up a Monte Carlo program to look at the same GISS annual 1972-2000 data from a slightly different perspective: Given a trend and random variation around that trend, how many significant findings would one expect to see if one intentionally started (cherrypicked) at a start value within certain ranges from the trend line. All distributions are generated randomly using the parameters from the GISS data (trend=.017/yr, s.d.=.1033), it is only that this analysis binned and studied start value ranges individually (i.e. cherrypicked them) rather than allowing the start value to occur randomly and normally as standard regression assumptions would dictate. Series lengths of 14 to 20 years were examined.
The resulting graph looks as follows:
Nothing at all surprising in the results. The left hand column of values shows the significance probabilities resulting from using the whole distribution. Cherrypicking start values well below the trend line greatly increases the likelihood if seeing a significant result. Cherrypicking high start values greatly decreases the likelihood. Longer series are less subject to cherypicking the initial value than are shorter series. In particular, choosing a start value equal to the 1998 el Nino deviation showed that one would then expect to see findings of significance in a 17 year series about 84% of the time. That is, the denier claim that a period with no warming this long is a significant observation is false. It may be an interesting observation to explore further with ever more detailed models, but it in no way shows global warming has "stopped".
[RH] Fixed image width. Please keep images limited to 500px.
nigelj@9 said: "the... warping of space time analogy for general relativity..." I agree that analogies are useful ways to explain phenomena remote to one's personal experience. I have an analogy for Evan he might use in a future post: "A dedicated surfer finally pulled together the funding to take an epic surfing surfari all over the world. To save money, however, he was mostly roughing it. At a remote beach in South Australia, he pitched his tent just beyond the beach break and hurridly paddled out. It was everything he had imagined. After several hours, a local paddled out and mentioned that in the time our traveler had been out, the tide had raised the sea level by 1 foot. "One foot!," exclaims our tourist, "Why, that's nothing! You and I are going to be bobbing up and down by 20 feet in the next few minutes!" It's only after our surfer paddles back in, and observes the damage to his tent and supplies, that he appreciates the difference between 'seasonal change' and 'climate change'.
I thought up this analogy after an old surfing buddy of mine, who has since become an ardent climate skeptic, emailed me the 30' talk of Dr Ivar Giaever. There, Dr Giaever give his audience the claim that a 1 C change in global temperature, over a century, was 'nothing' compared to the seasonal change occuring in a singe year in his New England backyard.
Cherrypicking on top of cherrypicking is not uncommon in the skeptic universe. About 9' into his talk, Giaever reliably trots out the '17 years of no warming after 1998' myth that inspired Evan's analogy in this article. He excitedly points out the flat trendline that followed that enormous Christmas banquet. Look closely and you can see that cherrypicking his start date is only the second cherrypick needed to make his point. He has also cherrypicked his temperature survey to be RSS, the ONLY survey that will give him what he wants (no warming), because, all the others, apparently, were compiled by communists.
ubrew12, some good thoughts for analogies: wrist, waist, beach, waves, bobbing ... lots to work with.
What about the analogy that others have used where we note that our bodies can be exposed to temperatures that vary up and down by 10's of degrees, but if our body temperature rises by 1=2C, we are in trouble. It's not quite the same as comparing one physical situation to another (e.g., tide vs. wave height, or wrist to waist diameter), as much as it suggests that there are cases where a 1-2C temperature difference is huge, and for our body temperatures, a 4C rise means death. Again, it's not a 1:1 analogy in terms of physics, but it is an anology that suggests that how we interpret temperature changes is not as simple as what kind of daily weather extremes we can tolerate.
Thanks for the analogy fodder ubrew12. Comments help.
Evan@12: I've had occasion to think in terms of analogies, lately (trying to convince a non-technically-trained friend how to look differently at Giaever's many mistakes). For example Giaever claims that a 1 C change in global temperature over a century is just a 0.3% change, in absolute terms (Kelvin). To him that looks 'amazingly stable'. To my friend, all he really sees is 'Nobel Prize in Physics'. So I mentioned to my friend that a mere 1% wiggle, in absolute terms, takes Earth from the holocene optimum to the middle of the last ice age. I'm not sure that worked, however. So I'm thinking of trying this analogy: "Suppose you were walking near the Empire State Building and a chunk of concrete fell on your head. During the lawsuit, Empire's lawyers exclaim 'Little did you know, but we have a solid-state scale under the entire building, and when we look at the weight the day before your accident, and the day after, the change is only 0.0001%!! Aha, this number is so close to zero, it must be zero. Ergo, you were hit by some other building. QED!' "
ubrew12@13 Yes, I like the building analogy.
Go back to the Columbia Space Shuttle accident. The engineers knew that a chunk of foam hit the wings 2 days after lift-off, and it was estimated to be 2 lbs. They reasoned that it was like a piece of foam from a styrofoam cooler hitting a truck on the highway, and so they ignored it. (This is a case of an analogy being dangerous). They reasoned that the foam just bounces off and does not damage the truck. But when the physicists sad down and did a detailed calculation (the type done in high-school physics classes), they found that the chunk of supposedly inconsequential foam exerted a force of more than 1 ton of force. The devil is in the details, but unfortunately this calculation was not done until after the tragedy.
No, a temperature increase of 1C does not seem like a big deal, and most scientists agree that if we stopped at 1C we would probably be OK. 2C is where things really get interesting (and we have already locked in 2C), so we have already locked in a 0.6% increase. Suppose somebody makes an income of $50,000/yr, and with that they are just paying the bills and getting by. Pull out $300 and offer it to them. What kind of response will you get? Is $300 inconsequential to someone making $50,000/yr? The reason it is not inconsequential is that we do not compare to the magnitude of the gross income, but the comparison should be made to the magnitude of the net income. A person just getting by (i.e., in equilibrium), is delighted at a $300 gift, because it may represent their net savings for a year. So for a world that is in equilibrium, 1-2C is HUGE (sorry for yelling). It is not about the gross magnitude, but about the deviation from an equilibrium point.
Or take the Indianapolis 500. Take a care and magically increase its speed by 0.6%. Is that worth something? It means the race requires about 1 minute less if you could increase your spedd by 0.6%. Next time you watch a race, count how many cars go by in 1 minute and see if that kind of time difference represents an advantage. This is not a perfect analogy, but again illustrates the point that 2C, or 0.6% can mean a lot.
But I think the real point about this is that it is simply not intuitive that a 1-2C increase will be that bad, except when considering that ice at -0.5C does not melt and ice at 0.5C does melt.
But perhaps the real problem is the concept of distributions. 1C is the average temperature increase so far, and yet in the places where ice lives we know that the warming is closer to 3C. What will the temperature difference be at the poles when our locked-in 2C warming is finally manifested? I think that even Nobel Laureates know what a temperature increase does to ice.
And ice raises sea level.
And of course there is the other problem of ocean acidifcation. I'm sure that Nobel Laureates know that too much CO2 in the water is not good. At least that's what my mother told me many years ago.
Correction to my last post (Evan@14). I said,
"And ice raises sea level." What I meant to say, of course, is "And melting land ice raises sea level."
ubrew12@13. I though of another example where a minor change has a big effect. The numbers are not exact, but you will get the point. During the 2007 economic recession, gasoline consumption dropped by about 10% (I think it was lower, but don't want to exaggerate and can't find a good source), but this caused the price to drop from $4/gallon to a little over $1/gallon (at least in Minnesota in the US). Is it obvious that a 10% reduction of one thing should cause about a 300% reduction of another thing?
Ok here are a few analogies related to the article. First some background. As we know, global warming is a relentless long term process of increasing temperatures, driven by burning fossil fuels, but natural cycles make this an uneven process with temporary flat periods. But these are not enough to stop the underlying climate change process.
By analogy it is like watching television. From time to time you get loss of transmission or pixellation that blanks out the picture for a short period, but transmission then continues.The physical forces driving the television have not stopped.
And yes people ask how does such a small quantity of CO2 change the climate? There are tons of analogies:
1)Transistors amplify currents using a few atoms of certain substances added to the device that make it act sort of like a gate, and all it takes are a small number of atoms. (I'm a bit rusty on exactly how these things work but its along those lines)
2) Catalytic converters in cars reduce quite significant quantities of certain noxious gases using only small quantities of rare earth metals that act as catalysts.
I agree wuth Ubrew's comments critical of Giaever. This guy should know better that you cannot compare predictable and steady seasonal fluctuations that we have learned to live with against a relentless increase in long term temperatures with its implications. It's a rate of change problem really. He is being very cheeky.
"He is being very cheeky." That's being generous. I've looked over most of his 'points' and the level of cherry-picking, mathematical flimflammery, and outright obfuscation make it hard to conclude he 'accidentally' pied-pipered his way into this river with his enchanted flock behind him.
I keep being told by family and friends that 'current global warming is natural'. I finally decided to graph what these people mean by 'natural', since they can't be bothered to do so themselves. This distribution (temperature change in C per century, for the last 220 centuries) is based on 3 graphs you can find here on skeptical science or at realclimate. It was not my intent to be perfect, I just wanted to indicate to people what they mean by 'natural climate change', when they claim such of the current warming. The distribution is perfectly accurate for the last 20 centuries, a bit less accurate for the 100 centuries before that, and even less accurate for the 100 centuries before that. That's not important. This graphs purpose was simply to locate 'natural' for skeptics who can't seem to define it themselves.
ubrew12 @18, did you forget a link?
Here is another way to answer the likes of Giaever with facts.
Water freezes at 0C. So if the average global temperature is 15C, it matters not about the range from 0 down to -273 (absolute 0), if we are concerned about the strength of storms. After all, from absolute 0 up to 273K there is not enough vaporization to drive anything.
Nobody will dispute that water freezes at 0C, and it should not be too hard to educate people that the energy of storms is derived from water condensing (latent heat of vaporization/condensation). So forgetting that the Clausius-Clapeyron is an exponential function, an increase of 1C from an average temperature of 15C to 16C means a whopping 6.5% increase relative to 0C. And an increase of 2C means an enormous increase of 13%. These are not small numbers, especially when this refers to the jet fuel of storms. That is, I think most people understand that the warmer the water, the more water vapor it releases into the air. Think of a tea kettle. And by some coincidence, increasing global temperatures by 2C does increase the water vapor in the air by 14%. This is by pure chance, but you can point anyone to the Clausius-Clapeyron equation, and if a physicist cannot follow this line of reasoning, he should donate his Nobel prize to someone else.
Not everyone will follow this, but my guess is that most will, because it is the kind of science that is so basic and fundamental as to be transparent. I'm sure this can be cleaned up, but the point is that referencing all the way to absolute 0 is unreasonable, and referencing to the freezing point of water makes a nice reference to discuss what drives storms.
Ubrew @18, I didn't want to say anything really harsh, like "total idiot" and get told off for being personal by the moderator.
Yes he cherrypicks etc. I think RC did some article on this guy, and the consensus is he is getting old and past it. Or possibly he has some undisclosed agenda, or is an attention seeker. You will go nuts figuring it out, because humans often have mixed and complicated motives. It's definitely not good though.
Plenty of people tell me climate change is all " just natural". They are just grasping at anything to deny there is a problem. It's like an avalance of things.
I think you are right to point out the rate of change since 1900 is far higher than natural rates of change in the past, and of course the big problem is adaptation to fast rates of change. There have been previous extinctions due to climate change as species have struggled to dapat fast enough.
I suppose people assume technology will rescue us, but this is a very high risk solution.
I also point out that we know recent climate change is not natural because solar energy patterns should have cause a cooling trend over the last 50 years, and there have been atmospheric changes that can only really be caused by an increasing greenhouse effect. Trouble is it gets complicated, and peoples eyes glaze over a bit.
Maybe some people are fatalistic, and say "things changed before and so they will change again, regardless of causation".
But this is only because the climate problem seems distant, and if it was to hurt them badly tomorrow, they would probably have a different view. There's a lot of psychology going on with the climate issue.
I like Evans comments at 21. Many people can relate to that sort of science, while staring at the equations behind climate models would be incomprehensible to most people. Its certainly important to understand that smallish changes can lead to bigger impacts than we might anticipate, from a simple gut reaction only.
It's also about getting the message across about floods and sea level rise. We are all used to big floods occasionally maybe 1:100 years where the house is a total write off or seriously damaged. It wont take much for that to become 1 in 20 years, and this is worse than it sounds. These sorts of costs will therefore become onerous, and insurance will become a nightmare, due to both increasing severe weather and also the difficulty predicting just how this severity will worsen more over time. Insurance companies hate unpredictability hence they hate insuring against earthquakes.
Speaking of floods and sea level: "Climate change causes relocation of entire town in USA" as below
www.news.com.au/technology/environment/climate-change/climate-change-forces-relocation-of-entire-town-in-us-with-others-to-force/news-story/a5657b7da1834235913d07e869dfb4f4
nigelj@22 Thanks for your post about the town relocating. I have been pondering an analogy along these lines, and your link is perfect. If a city wants to build a road through a neighborhood where they need to remove a bunch of houses, if they set there sites 30 years into the future, they can buy the houses as they naturally go up for sale and cause little disruption of the residents. Move that time period up to 10 years, and they force people to move sooner than they want. Move that time period up to 1 year and they will probably have law suites from every homeowner. And if they give the residents just 2 weeks notice, well there is civil war and chaos. This is obviously related to the problem that animals have adjusting to rapid climate change. There is simply a natural time frame within which things can happen at a normal pace. The further we move from that natural time frame, the more pain, as in the article you posted.