Climate Science Glossary

Term Lookup

Enter a term in the search box to find its definition.

Settings

Use the controls in the far right panel to increase or decrease the number of terms automatically displayed (or to completely turn that feature off).

Term Lookup

Settings


All IPCC definitions taken from Climate Change 2007: The Physical Science Basis. Working Group I Contribution to the Fourth Assessment Report of the Intergovernmental Panel on Climate Change, Annex I, Glossary, pp. 941-954. Cambridge University Press.

Home Arguments Software Resources Comments The Consensus Project Translations About Support

Bluesky Facebook LinkedIn Mastodon MeWe

Twitter YouTube RSS Posts RSS Comments Email Subscribe


Climate's changed before
It's the sun
It's not bad
There is no consensus
It's cooling
Models are unreliable
Temp record is unreliable
Animals and plants can adapt
It hasn't warmed since 1998
Antarctica is gaining ice
View All Arguments...


Username
Password
New? Register here
Forgot your password?

Latest Posts

Archives

Working out climate sensitivity from satellite measurements

What the science says...

Lindzen's analysis has several flaws, such as only looking at data in the tropics. A number of independent studies using near-global satellite data find positive feedback and high climate sensitivity.

Climate Myth...

Lindzen and Choi find low climate sensitivity

Climate feedbacks are estimated from fluctuations in the outgoing radiation budget from the latest version of Earth Radiation Budget Experiment (ERBE) nonscanner data. It appears, for the entire tropics, the observed outgoing radiation fluxes increase with the increase in sea surface temperatures (SSTs). The observed behavior of radiation fluxes implies negative feedback processes associated with relatively low climate sensitivity. This is the opposite of the behavior of 11 atmospheric models forced by the same SSTs. (Lindzen & Choi 2009)

Climate sensitivity is a measure of how much our climate responds to an energy imbalance. The most common definition is the change in global temperature if the amount of atmospheric CO2 was doubled. If there were no feedbacks, climate sensitivity would be around 1°C. But we know there are a number of feedbacks, both positive and negative. So how do we determine the net feedback? An empirical solution is to observe how our climate responds to temperature change. We have satellite measurements of the radiation budget and surface measurements of temperature. Putting the two together should give us an indication of net feedback.

One paper that attempts to do this is On the determination of climate feedbacks from ERBE data (Lindzen & Choi 2009). It looks at sea surface temperature in the tropics (20° South to 20° North) from 1986 to 2000. Specifically, it looked at periods where the change in temperature was greater than 0.2°C, marked by red and blue colors (Figure 1).
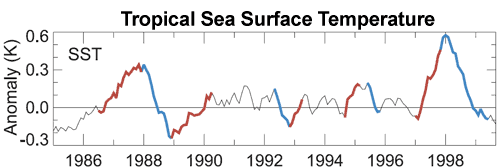

Figure 1: Monthly sea surface temperature for 20° South to 20° North. Periods of temperature change greater than 0.2°C marked by red and blue (Lindzen & Choi 2009).

Lindzen et al also analysed satellite measurements of outgoing radiation over these periods. As short-term tropical sea surface temperatures are largely driven by the El Nino Southern Oscillation, the change in outward radiation offers an insight into how climate responds to changing temperature. Their analysis found that when it gets warmer, there was more outgoing radiation escaping to space. They concluded that net feedback is negative and our planet has a low climate sensitivity of about 0.5°C.

Debunked by Trenberth

However, a response to this paper, Relationships between tropical sea surface temperature and top-of-atmosphere radiation (Trenberth et al 2010) revealed a number of flaws in Lindzen's analysis. It turns out the low climate sensitivity result is heavily dependent on the choice of start and end points in the periods they analyse. Small changes in their choice of dates entirely change the result. Essentially, one could tweak the start and end points to obtain any feedback one wishes.
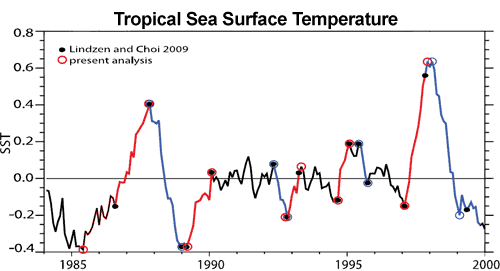

Figure 2: Warming (red) and cooling (blue) intervals of tropical SST (20°N – 20°S) used by Lindzen & Choi (2009) (solid circles) and an alternative selection proposed derived from an objective approach (open circles) (Trenberth et al 2010).

Debunked by Murphy

Another major flaw in Lindzen's analysis is that they attempt to calculate global climate sensitivity from tropical data. The tropics are not a closed system - a great deal of energy is exchanged between the tropics and subtropics. To properly calculate global climate sensitivity, global observations are required.

This is confirmed by another paper published in early May (Murphy 2010). This paper finds that small changes in the heat transport between the tropics and subtropics can swamp the tropical signal. They conclude that climate sensitivity must be calculated from global data.

Debunked by Chung

In addition, another paper reproduced the analysis from Lindzen & Choi (2009) and compared it to results using near-global data (Chung et al 2010). The near-global data find net positive feedback and the authors conclude that the tropical ocean is not an adequate region for determining global climate sensitivity.

Debunked by Dessler

Dessler (2011) found a number of errors in Lindzen and Choi (2009) (slightly revised as Lindzen & Choi (2011)).  First, Lindzen and Choi's mathematical formula  to calculate the Earth's energy budget may violate the laws of thermodynamics - allowing for the impossible situation where ocean warming is able to cause ocean warming.  Secondly, Dessler finds that the heating of the climate system through ocean heat transport is approximately 20 times larger than the change in top of the atmosphere (TOA) energy flux due to cloud cover changes.  Lindzen and Choi assumed the ratio was close to 2 - an order of magnitude too small.

Thirdly, Lindzen and Choi plot a time regression of change in TOA energy flux due to cloud cover changes vs. sea surface temperature changes.  They find larger negative slopes in their regression when cloud changes happen before surface temperature changes, vs. positive slopes when temperature changes happen first, and thus conclude that clouds must be causing global warming.

However, Dessler also plots climate model results and finds that they also simulate negative time regression slopes when cloud changes lead temperature changes.  Crucially, sea surface temperatures are specified by the models.  This means that in these models, clouds respond to sea surface temperature changes, but not vice-versa.  This suggests that the lagged result first found by Lindzen and Choi is actually a result of variations in atmospheric circulation driven by changes in sea surface temperature, and contrary to Lindzen's claims, is not evidence that clouds are causing climate change, because in the models which successfully replicate the cloud-temperature lag, temperatures cannot be driven by cloud changes.

2011 Repeat

Lindzen and Choi tried to address some of the criticisms of their 2009 paper in a new version which they submitted in 2011 (LC11), after Lindzen himself went as far as to admit that their 2009 paper contained "some stupid mistakes...It was just embarrassing."  However, LC11 did not address most of the main comments and contradictory results from their 2009 paper.

Lindzen and Choi first submitted LC11 to the Proceedings of the National Academy of Sciences (PNAS) after adding some data from the Clouds and the Earth’s Radiant Energy System (CERES).

PNAS editors sent LC11 out to four reviewers, who provided comments available here.  Two of the reviewers were selected by Lindzen, and two others by the PNAS Board.  All four reviewers were unanimous that while the subject matter of the paper was of sufficient general interest to warrant publication in PNAS, the paper was not of suitable quality, and its conclusions were not justified.  Only one of the four reviewers felt that the procedures in the paper were adequately described. 

As PNAS Reviewer 1 commented,

"The paper is based on...basic untested and fundamentally flawed assumptions about global climate sensitivity"

These remaining flaws in LC11 included:

  • Assuming that that correlations observed in the tropics reflect global climate feedbacks.
  • Focusing on short-term local tropical changes which might not be representative of equilibrium climate sensitivity, because for example the albedo feedback from melting ice at the poles is obviously not reflected in the tropics.
  • Inadequately explaining methodology in the paper in sufficient detail to reproduce their analysis and results.
  • Failing to explain the many contradictory results using the same or similar data (Trenberth, Chung, Murphy, and Dessler).
  • Treating clouds as an internal initiator of climate change, as opposed to treating cloud changes solely as a climate feedback (as most climate scientists do) without any real justification for doing so. 

As a result of these fundamental problems, PNAS rejected the paper, which Lindzen and Choi subsequently got published in a rather obscure Korean journal, the Asia-Pacific Journal of Atmospheric Science. 

Wholly Debunked

A full understanding of climate requires we take into account the full body of evidence. In the case of climate sensitivity and satellite data, it requires a global dataset, not just the tropics. Stepping back to take a broader view, a single paper must also be seen in the context of the full body of peer-reviewed research. A multitude of papers looking at different periods in Earth's history independently and empirically converge on a consistent answer - climate sensitivity is around 3°C implying net positive feedback.

Last updated on 6 July 2012 by dana1981. View Archives

Printable Version  |  Offline PDF Version  |  Link to this page

Argument Feedback

Please use this form to let us know about suggested updates to this rebuttal.

Further viewing

Andrew Dessler explains in relatively simple and short terms the results from his 2011 paper:

Comments

1  2  3  4  5  6  7  8  9  10  11  12  13  14  15  16  17  18  Next

Comments 1 to 25 out of 448:

  1. If the cloud feedbacks are indeed positive and inline with the IPCC model predictions of about a 3 C rise in temperature from a doubling of CO2 (a 3.7 W/m^2 gross increase in radiative forcing; 1.85 W/m^2 net), then why doesn’t the same proportional amount of positive feedback amplification lead to 16+ C rise in temperature when the net albedo adjusted incident solar power at perihelion is about 14 W/m^2 higher? Instead, average global temperatures are actually colder at perihelion in January then at aphelion in July. What is so special about 1 W/m^2 of additional power from CO2 that it’s at least 5 times more powerful than 1 W/m^2 of additional power from the Sun?
  2. RW1 I've no idea if your figures are correct (reference please?). However the answer to your question is that CO2 adds the heat all the time, year after year (think of a bathtub filling), whereas changes during a year cancel out over longer timescales (think of waves in the bathtub).
  3. Then how do you explain the relatively large and fast seasonal temperature changes that occur in each hemisphere every year? The seasonal hemispheric fluctuations in radiative forcing that occur are astronomically greater than the measly 1.85 W/m^2 that will come from a doubling of CO2. If what you’re saying is true, we wouldn’t see anywhere near the seasonal variability that occurs each year. (*The peak to peak difference in solar radiance between perihelion and aphelion is about 80 W/m^2. Divide by 4 to get the average of 20 W/m^2, then subtract out the albedo of about 0.3 and you get a net increase of about 14 W/m^2 at perihelion.
  4. #3: "difference in solar radiance between perihelion and aphelion" Are you suggesting that seasonal temperature changes are solely due to the difference in sun-earth distance at peri vs. api?
  5. Here is a summary of where I'm getting my figures: The average incident solar energy is about 340 W/m^2. If you subtract the effect of the earth’s albedo (about 30% or 0.3 = 102 W/m^2), you get a net incident solar energy of about 238 W/m^2 (340 – 102 = 238). (*The albedo is the amount of incoming short wave radiation from the sun that gets reflected back out to space off of clouds, snow, ice, etc., and cannot be absorbed by GHGs or contribute to the greenhouse effect, which is why it’s subtracted out). From this you take the surface power at the current average global temperature of 288K, which is about 390 W/m^2 (from Stefan Boltzman), and with it you can calculate the gain or the amount of surface warming as a result of the greenhouse effect in the atmosphere. To get this you divide the current surface power by the net incident solar power, which comes to about 1.6 (390/238 = 1.6). What this means is that for each 1 W/m^2 of solar input, you get 1.6 W/m^2 of power at the surface due to the presence of GHGs and clouds in the atmosphere – a boost of about 60%. A doubling of CO2 alone absorbs only about 4 W/m^2 of additional power. About half this is directed upward out to space and the other half is directed downward toward the surface, resulting in a net of about 2 W/m^2. If you then multiply this additional 2 W/m^2 of power by the same gain calculated for solar power (as a result of the greenhouse effect), you get an increase in the surface power of about 3.2 W/m^2 from a doubling of CO2 (2 x 1.6 = 3.2). Using Stefan Boltzman, an additional 3.2 W/m^2 will increase the surface temperature only about 0.6 degrees C (390 + 3.2 = 393.2 W/m^2 = 288.6K). This is much less than the 3 degrees C predicted by the IPCC. Even if you assume all of the 4 W/m^2 from a doubling of CO2 goes to the surface, the temperature increase would still only be 1.2 degrees C – significantly less than the low end of the IPCC’s claimed range of 2 – 4.5 C. To get the 3 degrees C claimed by the IPCC, an additional 16 W/m^2 would be needed. This requires a gain of 8 rather than 1.6 (or at least a gain of 4 instead of 1.6 if we assume all of the absorbed power is directed back to the surface). The bottom line is the actual response of atmosphere (from GHGs and clouds) relative to net incident solar power, measured in W/m^2, is far less than the response claimed by the IPCC from a doubling of CO2, which is also measured in W/m^2. A watt/meter squared of heat and power is watt/meter squared of heat and power, independent of where it originates from – whether it’s the Sun, or redirected back to the surface as a result of more CO2 in the atmosphere (*If this was not true, then power from the Sun and additional power from CO2 cannot both be expressed in W/m^2 as they are). Ultimately, the total power flux at the surface is directly tied to temperature via Stefan-Boltzman - there is no escaping this. In short, the surface gain factor of about 1.6 supports an upper limit of only about 0.6 C from a doubling of CO2 because there is no physical or logical reason why a small increase of less than 2 W/m^2 will behave radically differently than the original 99+ percent - i.e. a gain of 8 or more needed for a 3 C rise is simply way outside the bounds of empirically derived observations of how the system responds to changes in radiative forcing.
  6. muoncounter (RE: 4) "Are you suggesting that seasonal temperature changes are solely due to the difference in sun-earth distance at peri vs. api?" No, not at all.
  7. RW1@3 "Then how do you explain the relatively large and fast seasonal temperature changes that occur in each hemisphere every year?" They are the ripples on the bathtub. Effects of external forcing are additive to them. @5 you are putting forward a logical fallacy. The greenhouse effect is made up of forcings (largely CO2) and feedback (largely H2O). The overall effect on the heat balance is the sum of both. Let's put a bizarre analogy together. Celebrities (CO2) are stalked by paparazzi photographers (H2O feedback). Each celebrity attracts 2 paparazzi. With one celeb, how many people are on the pavement - 3 Add one more celeb - by your calculation we only get 4 people, a 33% increase. In reality, of course, we get 6, a 100% increase. And your arbitrary halving of the CO2 effect from 4 to 2 W/m2 is also incorrect.
  8. RW1 if you wish to (even roughly) calculate the result of an energy (im)balance you have to do it at the top of the atmosphere (TOA). You can not take two different pieces, at surface and at TOA, and mix them together.
  9. Very Tall Guy (Post # 7), You need to be more specific - I'm not sure what you're trying to say. The halving of the CO2 absorption is because the re-radiated energy goes out in all directions - meaning half is radiated upward in the same general direction it was already headed; thus it cannot contribute to additional warming.
  10. Riccardo (RE: Post 8), I'm not sure what you're trying to say either. Can you give me some specifics?
  11. #5: "from a doubling of CO2 ... an additional 3.2 W/m^2 will increase the surface temperature only about 0.6 degrees" We've already had more than 0.6C warming since ~1960, which only represents an increase of atmospheric CO2 from 317 to 388, nowhere near a doubling. So its clear your numbers are coming up short. But at least you agree that it's warming and that CO2 is part of the GHE, so that's a start. The general climate sensitivity question was dealt with on prior threads, notably here. You should check there for additional information.
  12. RW1 you first calculated a sort of energy balance at the earth surface to calculate the "amplification factor"; then you took the (net) energy imbalance at TOA, the 4 W/m2 for doubling CO2, and used the same "amplification factor" to calculate the extra energy received by the surface and the increase in temperature.
  13. Riccardo (RE: Post 12), All I did was apply the same gain factor for solar power to additional power from CO2.
  14. I'm asking the question because I think it's a significant hole in the AGW theory that I've yet to see adequately explained. What I'm trying to show is that the CO2 AGW theory is saying that the climate system is all of the sudden going to treat an additional 2 W/m^2 of power at the surface radically different than it does the original existing 99+ percent, and while I suppose that is theoretically possible, there is no physical, empirical or logical reason why it would, especially in a system that is constantly changing everywhere, by relatively large magnitude. Ultimately, what matters is the total infrared power at the surface, independent of where all the power orginates from - the the Sun, GHGs and/or clouds. Both 2 W/m^2 of additional infrared power from the Sun "forcing" the surface and 2 W/m^2 of additional infrared power from CO2 "forcing" the surface are the same - all the surface 'knows' is what the total power is, and the total power is directly tied to temperature via Stefan-Boltzman (*if this was not true, then power from the Sun and additional power from CO2 cannot both be expressed in W/m^2 as they are). The point I was making about the perihelion power increase of about 14 W/m^2 was that a much larger increase in radiative forcing above the average doesn't have anywhere near the proportionally predicted effect as the AGW warming theory says will happen with just a 2 W/m^2 increase in radiative forcing from a doubling of CO2. Now of course one can always say that it will be the 2 W/m^2 increase above the total cumulative average that will cause a much larger amount of warming by suddenly triggering very large positive feedbacks (that don't happen to exist or act on the original 99+%), but there really isn't any physical, logical, or empirical basis for that, especially given the total amount of radiative forcing is constantly changing spatially and in time...all the time (warming, cooling, etc). If the climate as a whole was a steady state and static system, it might be more plausible, but the climate system is incredibly dynamic instead. That the global climate doesn't even appear to be phased by a 14 W/m^2 increase in radiative forcing, suggests the net feedback operating on the system as a whole is strongly negative - not positive, and the tiny increase of only about 2 W/m^2 from a doubling of CO2 will be - if not infinitesimal, benignly small.
  15. RW1 there are a few pieces that got to be fixed. "All I did was apply the same gain factor for solar power to additional power from CO2." You did it wrong as I explained in my previous post, you're confusing surface and TOA. "Ultimately, what matters is the total infrared power at the surface" The energy balance of the planet is governed by what happen at TOA, not at the surface. What we see (measure) at the surface is the effect of the change at TOA. "The point I was making about the perihelion power increase of about 14 W/m^2 was that a much larger increase in radiative forcing above the average doesn't have anywhere near the proportionally predicted effect as the AGW warming theory says will happen with just a 2 W/m^2 increase in radiative forcing from a doubling of CO2." (emph. mine) You should not expect any proportionality, indeed. When you have a cyclic forcing, the effect depends of the response time of the system. If the response is slow you won't get the full effect of the forcing; you are comparing a forcing with a one year period with a response time of the order of decades. An extreme example is the diurnal cycle, where you have the forcing going from about 240 W/m2 to zero but the temperature doesn't change proportionally.
  16. Riccardo (RE: Post 15), How am I confusing the surface and the TOA? Are you saying that power from the Sun and additional power redirected from CO2 are not both "forcing" the surface? The energy balance is determined by the rate at which incoming power from the Sun is allowed to leave the planet (at the TOA): The incoming short wave infrared energy from the Sun is mostly transparent to the clear sky atmosphere. Cloudy sky is obviously different, as a lot of the energy is reflected off of and absorbed by the clouds - a much smaller amount makes it through. The short wave energy that hits the surface is re-radiated back up in the form of long wave infrared, which in certain wavelengths is absorbed and re-radiated by greenhouse gases and/or clouds. In effect, the presence of greenhouse gases and clouds delay the release of infrared heat energy by redirecting some of it back toward the surface, which makes the surface warmer than it would be otherwise. The albedo adjusted gain factor of about 1.6 means that due to the greenhouse effect, it takes about 1.6 W/m^2 of power at the surface for each 1 W/m^2 of power to leave the system, offsetting each 1 W/m^2 entering the system from the Sun. In other words, power in = power out. The albedo adjusted solar input of about 238 W/m^2 = 238 W/m^2 leaving the planet, and a power of 238 W/m^2 equates to a temperature of about 255K, which is the so-called effective temperature of the earth as seen from space. There is no difference between power sourced from the Sun and additional power re-directed back to the surface as a result of more CO2 being added to the atmosphere. Afterall, a watt/meter squared of energy and power is watt/meter squared of energy and power, independent of where it originates from. Put another way, the surface doesn't "know the difference" between heat or power sourced from the Sun or additional heat or power re-directed back down from GHGs and/or clouds - all it "knows" is what the total heat and power is at the surface; and the total power at the surface in W/m^2 is directly tied to temperature via Stefan-Boltzman because the surface of the earth is considered to be very close to a perfect black body radiator. At an average global temperature of 288K, the surface emits 390 W/m^2 of power. About 240 W/m^2 of this is from the Sun and the additional 150 W/m^2 is from GHGs and clouds in the atmosphere re-directing infrared power back down toward the surface. If the albedo adjusted power from the sun increases 2 W/m^2, the infrared power at the surface increases 2 W/m^2, plus about an additional 1.2 W/m^2 will be redirected back downward from the atmosphere (due to the presence of GHGs and clouds) for net increase of about 3.2 W/m^2 - raising the surface power total to about 393.2 W/m^2 (or a temperature of 288.6K). If instead, the albedo adjusted power from the Sun is unchanged, but an additional 2 W/m^2 of infrared power is redirected downward to the surface as a result of a doubling of CO2, the most additional power that can amplify (or in effect re-redirect down) the added 2 W/m^2 is only about the same 1.2 W/m^2 because there is no physical or logical reason why an additional 2 W/m^2 of infrared power at the surface will behave radically different from either the original 99+% or an additional 2 W/m^2 from the Sun.
  17. Riccardo (RE: Post 15) The hemispheric seasonal responses to large changes in radiative forcing are relatively quick – certainly not years or decades. If they were, we wouldn't see anywhere near the seasonal variability throughout each year. There is a delay or "seasonal lag", but it’s only about one month. This contradicts the notion that a tiny increase in radiative forcing of less than 2 W/m^2 from a doubling of CO2 gradually added to atmosphere over decades will take decades longer after to reach equilibrium. If anything, because CO2 is added incrementally and so slowly over such a long period of time, the response time is a non issue.
  18. #17: The two paragraphs in your comment don't seem to have any logical connection. Don't the oceans have thermal inertia? Is there any research regarding 'albedo adjusted gain', beyond this website?
  19. muoncounter (RE: post 18), Yes, the oceans have thermal inertia, as evidenced by the roughly one month of "seasonal lag", but the overall response is still relatively fast in each hemisphere every year. This contradicts the ocean thermal inertial taking decades to fully respond. The albedo adjusted gain is just an aggregate empirical measure of the system's response at the surface to incoming power from the Sun. As you can see from that site, it varies a little but is roughly about 1.6 on average.
  20. @RW1: that site (www.palisad.com) doesn't seem very credible. The best analogy that has been given is the tub filling in vs. ripples. Seasonal variations tend to cancel out over time, while the current warming we are seeing keeps going up. The whole isn't in AGW theory, it's in your understanding of the theory.
  21. RW1 the often quoted 4 W/m2 is the imbalance at TOA, i.e. the amount of energy not allowed to leave the planet after a doubling of CO2. Following your scheme, an equal amount is radiated back to the surface. In this way you get a 1.2 K increase in temperature; incidentally, this is equal to the so-called Plank sensitivity. To know the equilibrium temperature increase you still need to multiply it by the feedback factor, which is not included in the 4 W/m2.
  22. RW1 @9 The 4 W/m2 is total change in radiative forcing at the top of the atmosphere (TOA). 4W/m2 extra heat absorbed by the earth's system. That's the change in total heat balance at that point. You can't just halve it to suit your argument.
  23. Riccardo (RE: Post 21), The cumulative effect of all the feedbacks are already accounted for in the measured gain response of 1.6. This is why the total increase in temperature is greater than the intrinsic response.
  24. How do these statements, taken together, make any sense? #16: "The albedo adjusted gain factor of about 1.6 ..." #19: "... is just an aggregate empirical measure of the system's response at the surface ..." #23: "... cumulative effect of all the feedbacks are already accounted for in the measured gain response of 1.6. This is why the total increase in temperature is greater" If gain=1.6 and gain is an 'aggregate empirical measure', then 23 is contradicted. If the total increase in temperature is greater than you predict (and it is), then either 16 or 19 are incorrect. It appears that your numbers put you in line with the "ultra-conservative unrealistic low climate sensitivity scenario", which is addressed in a very thorough treatment here.
  25. VeryTallGuy (RE: Post 22), 4 W/m^2 would the total that affects the surface only if all the absorbed power is directed back toward the surface, but only about half of it does because GHG infrared absorption and re-radiation is in all directions - i.e. about half goes down and other half goes up out to space in the same general direction it was already headed.

1  2  3  4  5  6  7  8  9  10  11  12  13  14  15  16  17  18  Next

Post a Comment

Political, off-topic or ad hominem comments will be deleted. Comments Policy...

You need to be logged in to post a comment. Login via the left margin or if you're new, register here.

Link to this page


The Consensus Project Website

THE ESCALATOR

(free to republish)


© Copyright 2024 John Cook
Home | Translations | About Us | Privacy | Contact Us