Climate Science Glossary

Term Lookup

Enter a term in the search box to find its definition.

Settings

Use the controls in the far right panel to increase or decrease the number of terms automatically displayed (or to completely turn that feature off).

Term Lookup

Settings


All IPCC definitions taken from Climate Change 2007: The Physical Science Basis. Working Group I Contribution to the Fourth Assessment Report of the Intergovernmental Panel on Climate Change, Annex I, Glossary, pp. 941-954. Cambridge University Press.

Home Arguments Software Resources Comments The Consensus Project Translations About Support

Bluesky Facebook LinkedIn Mastodon MeWe

Twitter YouTube RSS Posts RSS Comments Email Subscribe


Climate's changed before
It's the sun
It's not bad
There is no consensus
It's cooling
Models are unreliable
Temp record is unreliable
Animals and plants can adapt
It hasn't warmed since 1998
Antarctica is gaining ice
View All Arguments...


Username
Password
New? Register here
Forgot your password?

Latest Posts

Archives

CO2 emissions change our atmosphere for centuries

What the science says...

Individual carbon dioxide molecules have a short life time of around 5 years in the atmosphere. However, when they leave the atmosphere, they're simply swapping places with carbon dioxide in the ocean. The final amount of extra CO2 that remains in the atmosphere stays there on a time scale of centuries.

Climate Myth...

CO2 has a short residence time

"[T]he overwhelming majority of peer-reviewed studies  [find] that CO2 in the atmosphere remained there a short time." (Lawrence Solomon)

The claim goes like this:

(A) Predictions for the Global Warming Potential (GWP) by the IPCC express the warming effect CO2 has over several time scales; 20, 100 and 500 years.
(B) But CO2 has only a 5 year life time in the atmosphere.
(C) Therefore CO2 cannot cause the long term warming predicted by the IPCC.

This claim is false. (A) is true. (B) is also true. But B is irrelevant and misleading so it does not follow that C is therefore true.

The claim hinges on what life time means. To understand this, we have to first understand what a box model is: In an environmental context, systems are often described by simplified box models. A simple example (from school days) of the water cycle would have just 3 boxes: clouds, rivers, and the ocean.

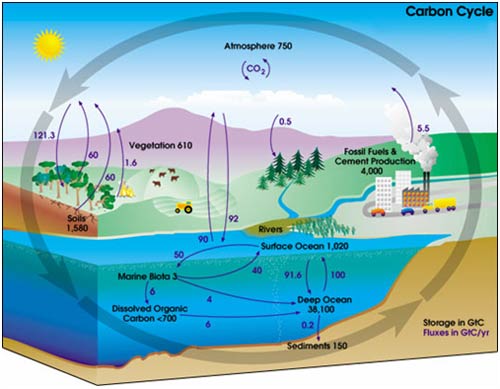
A representation of the carbon cycle (ignore the numbers for now) would look like this one from NASA.
In the IPCC 4th Assessment Report glossary, "lifetime" has several related meanings. The most relevant one is:

“Turnover time (T) (also called global atmospheric lifetime) is the ratio of the mass M of a reservoir (e.g., a gaseous compound in the atmosphere) and the total rate of removal S from the reservoir: T = M / S. For each removal process, separate turnover times can be defined. In soil carbon biology, this is referred to as Mean Residence Time.”

In other words, life time is the average time an individual particle spends in a given box. It is calculated as the size of box (reservoir) divided by the overall rate of flow into (or out of) a box. The IPCC Third Assessment Report 4.1.4 gives more details.

In the carbon cycle diagram above, there are two sets of numbers. The black numbers are the size, in gigatonnes of carbon (GtC), of the box. The purple numbers are the fluxes (or rate of flow) to and from a box in gigatonnes of carbon per year (Gt/y).

A little quick counting shows that about 200 Gt C leaves and enters the atmosphere each year. As a first approximation then, given the reservoir size of 750 Gt, we can work out that the residence time of a given molecule of CO2 is 750 Gt C / 200 Gt C y-1 = about 3-4 years. (However, careful counting up of the sources (supply) and sinks (removal) shows that there is a net imbalance; carbon in the atmosphere is increasing by about 3.3 Gt per year).

It is true that an individual molecule of CO2 has a short residence time in the atmosphere. However, in most cases when a molecule of CO2 leaves the atmosphere it is simply swapping places with one in the ocean. Thus, the warming potential of CO2 has very little to do with the residence time of individual CO2 molecules in the atmosphere.

What really governs the warming potential is how long the extra CO2 remains in the atmosphere. CO2 is essentially chemically inert in the atmosphere and is only removed by biological uptake and by dissolving into the ocean. Biological uptake (with the exception of fossil fuel formation) is carbon neutral: Every tree that grows will eventually die and decompose, thereby releasing CO2. (Yes, there are maybe some gains to be made from reforestation but they are probably minor compared to fossil fuel releases).

Dissolution of CO2 into the oceans is fast but the problem is that the top of the ocean is “getting full” and the bottleneck is thus the transfer of carbon from surface waters to the deep ocean. This transfer largely occurs by the slow ocean basin circulation and turn over (*3). This turnover takes 500-1000ish years. Therefore a time scale for CO2 warming potential out as far as 500 years is entirely reasonable (See IPCC 4th Assessment Report Section 2.10).

Intermediate rebuttal written by Doug Mackie


Update July 2015:

Here is the relevant lecture-video from Denial101x - Making Sense of Climate Science Denial

Last updated on 5 July 2015 by pattimer. View Archives

Printable Version  |  Offline PDF Version  |  Link to this page

Argument Feedback

Please use this form to let us know about suggested updates to this rebuttal.

Update

Updated 'the skeptic argument' on 02/05/2012 to correct formatting errors

Comments

1  2  3  4  5  Next

Comments 1 to 25 out of 113:

  1. Excellent post, Doug! If you can find the time, will you please comment on whether the iconic list and graphic that is touted so widely on the web, contains only studies about individual molecules' lifetimes? Many skeptics throw that on the table to counter explanations such as the one you've given.
  2. Thank you. Comment? Sure. Long version: The issue is the difference between residence time and lifetime.See the link above to the AR4 glossary and also the entry for lifetime in the TAR glossary . Residence time is the average time a given molecule with (if they had them) a given serial number stays in the atmosphere. CO2 is constantly undergoing exchange processes. That is, a plant takes up a molecule of CO2 and is removed from the atmosphere. At the same time an animal may be breathing out a molecule of CO2 produced by “burning” some plant matter. So long as total biomass is roughly balanced this causes no net change in atmospheric CO2. (Indeed, the sawtoothing in the Keeling curve shows what happens each Northern Hemisphere spring as the plants grow their leaves back and suck up CO2 released by their leaves rotting the previous autumn). It turns out that the average time a given molecule of CO2 spends in the atmosphere is only a few years. BUT residence time is meaningless in this concept. My bank manager does not care how much I spend so long as I have money coming in to cover outgoings. However, if INLifetime is how long before a molecule is removed permanently and not just exchanged. Some molecules are removed by undergoing change – methane is oxidised to CO2 for example. However, CO2 is (almost) chemically inert and so is only removed by an increase in total biomass or by dissolution in the oceans. The dissolution process has a bottleneck and it will be centuries before total CO2 in the atmosphere decreases. (Even then we will be in trouble as the oceans undergo acidification). See, also, the AR4 FAQ 10.3 :
  3. Thanks again, Doug. For a long time I've been wanting somebody to write what you did. Your original post was completely clear to me; I didn't mean to imply that it was unclear or that I was being "skeptical" of it. (Funny how that formerly perfectly innocent word now sticks in my craw!) The additional thing I think would help, is a specific counterpoint to that iconic list. There are so many references in that list that I'm sure it would take rather a long time to read them all thoroughly enough. I tried a few, but I lack the knowledge to evaluate them. Maybe the time-consuming review of that list would be a good project for somebody's chemistry grad students, or even undergrads! Again, the purpose of the review would be narrow--just to state decisively what definition of residence time or lifetime they really use. So anybody reading this who has a bunch of chemistry students in need of a project, please give it a go!
  4. Tom's comment #3 refers to lack of time and knowledge in pursuing an understanding of climate change, so I'll throw this out there, though it's a bit off topic. Regular readers of this blog come here often because we find the science fascinating, but I think that fascination can be a handicap when we're trying to communicate the central urgency of AGW to folks who may have a lot of other issues on their minds. If I were presented with the "iconic list" either in rebuttal or simple confusion, I would be tempted to simply by-pass it and say "Look, we KNOW (from direct and proxy measurements) that the planet's CO2 blanket is more than a third thicker than it was before the industrial revolution. We KNOW (through carbon isotope signatures) that we're the ones thickening it. We KNOW that CO2 traps infrared - we can measure the effect both in the lab and from satellites. And we KNOW that global (atmospheric and ocean) temperatures are rising." If anyone appreciates these basic facts, they'll GET global warming. Hockey-sticks, tropical troposphere hot-spots and ENSO variability are secondary issues that may or may not interest a general audience, but they are not critical to the basic narrative. It's important to address denialist arguments when they arise. But it's more important to be able convey - really well - the ESSENCE of the AGW threat. Widespread familiarity with, and repetition of, that central chain of evidence will be the most powerful antidote to whatever head-in-the-sand nonsense happens to be floating around.
  5. I agree with you in general, Hugh. It is best to avoid repeating misinformation even in the context of disproving it, because repeating the disinformation actually publicizes it. That's why I greatly appreciate Doug's approach in this post, of stating the facts. But there is also the problem of icons such as this sacred list of 36 previous studies. That list is used by deniers as evidence that 36 other experts disagree radically with Doug and "a few" other people. That tactic could be neatly parried by saying that all those studies were about residence time of an individual molecule rather than adjustment time. Such a simple statement inserted as a single sentence in Doug's description of residence time would help a lot, I think. But we'd have to be sure such a statement was completely accurate, which is where a student project would be helpful.
  6. With climate science as in astronomy when we are looking into past events, it is hard to distinguish between circumstantial evidence, theoretical conjectures, and thought experiments which supports a given hypothesis which may not be falsifiable (i.e., it cannot be refuted or replicated by experiments. Thus it is easy to mistake a correlation with cause and effect. Can you give some advice on how one can untangle this confusion? What repeatable experiments have been done or can be done in a high school lab to show that global warming is "caused" not "correlated" with a rise in CO2 and is due only to the onset of the industrial age and is not caused by something else? What does it take to transform a correlation into a cause? It only takes one valid counter example to demolish a hypothesis. Are all the proposed counter examples for the predominant cause of global warming proven to be invalid or cannot be proven by experiment. Is it possible to have two contradictory hypotheses about global warming which are not falsifiable. That is, they cannot be proven by experiment.
  7. N/A, we've "convicted" CO2 of causing warming for physical reasons, not just because of statistical correlations. In fact, Arrhenius predicted that CO2 would cause warming long before we had any of the data showing these correlations. Some of the reasons for believing that CO2 is responsible for the warming are discussed on the page How do we know CO2 is causing warming?.
  8. N/A, read Spencer Weart's book for a thorough background on this topic. To get directly to the point you raise, you might start with chapter two, The Carbon Dioxide Greenhouse Effect Long story short, we've got a robust set of reliable physics tools found amply predictive in a plethora of applications including this particular case coupled with extensive laboratory experiments and a record of field observations as well as models of climate behavior, all mutually consistent and all leading inexorably to the notion of additional C02 in the atmosphere causing an increased temperature of the part of the Earth we're concerned with. At this point, the onus is on folks choosing to disagree with all of the above to state a persuasive case of why and how all those things should fail in a way that does not upend much of what we think we understand of radiative physics, the ideal gas law and much else. That's a steep hill to climb, nobody's yet made it to the top.
  9. Doug, Nice article. I like all your points. I do agree with you that the fast removal of CO2 from the air is into the oceans by solution. Just as an additional process that removes CO2 from the atmosphere and eventually into sediments the rock weathering process should be mentioned. The calcium and to a lesser extent magnesium and other metals that form insoluble carbonates have cycles that play a part in CO2 draw down. In brief when rocks (particularly igneous rocks that have had any carbon removed by heat) weather, the soluble metals that can form insoluble carbonates are initially released by a combination of acidic rain water and the action of plants and their organic acids. Rain water is acidic from a combination of dilute sulphuric, nitric and carbonic acids. So the sulphur cycle, nitrogen cycle as well as the carbon cycle it's self are involved in the production of the acids that free the mostly calcium from the rocks. Once in solution the calcium remains soluble until it is either precipitated by high carbonate/ bicarbonate levels at higher pH or it is taken into aragonite and calcite forming marine shell fish and other marine creatures. It is then dropped into sediments at the end of the creatures life. As CO2 levels rise we can expect an increase in the weathering rate due to a drop in the pH of rain water. This rate is however too slow to helps up much. Paleo studies show the usual drop in CO2 takes millions of years. Also with higher CO2 in the oceans the rate of shell formation will slow as first aragonite then calcite forming creatures loose their ability to form shells due to ocean acidification. This is the very deep "do do" point of mass ocean life form extinctions from collapse of the ocean food chain that depends on the aragonite or calcite planktons. There is periods in the Paleo record at the past thermal maximums that ocean sediments show the absence of shell deposition. At the end of the thermal maximum the shells reappear and life slowly rebuilds.
  10. Doug Mackie wrote: "The final amount of extra CO2 that remains in the atmosphere stays there on a time scale of centuries." This conclusion does not follow from the presented arguments. It could be true if the bulk atmosphere is a nearly isolated reservoir. It is not. Since the CO2 is considered as "well mixed" gas, it will mix well with the atmospheric boundary layer as well, the layer which supplies the estimated source of 200GT/y. Therefore, the relaxation time of CO2 perturbation must be still the same as the turnover time, 4-5 years. This estimation of characteristic time is consistent with global observations after Pinatubo eruption.
  11. I take it the claims (from chemist Dr Klaus L. E. Kaiser & "leading Swedish" mathematics professor Claes Johnson) in the following link are a variation on this particular argument? Basically it seeks to undermine the Royal Society's latest report on climate change by claiming it's calculations are wrong. The Link
  12. Grim_Reaper, yes, it looks like the same (wrong) argument. Also, propagating one piece of misinformation apparently isn't enough, since they also throw in the canard about volcanoes as a source of the observed CO2 increase (briefly dealt with here).
  13. One need only look at records of air samples trapped in ice cores to see that over and over again it has taken ~90,000 years for a ~100 ppm increase in atmospheric CO2 to return to the previous level. Thus the Kaiser & Johnson contention that a similar change would now happen within 30 years flies in the face of reality. Both current observations and past records indicate a MUCH longer time period... fully in line with the royal society's findings.
  14. Isn't the NASA graphic a bit out-dated? 5.5 Gt carbon from anthropogenic emission? As for ATekhasski's comment, the fact remains that uptake rates in today's carbon cycle appear limited (thus the rapid accumulation). The article seems to hint that the relaxation time is a function of the excess uptake (beyond the natural exchange) vs. the amount of buildup. Don't know how up-to-date this is, but RC had some discussion of the ANTHROPOGENIC PERTURBATION lifetime: http://www.realclimate.org/index.php/archives/2005/03/how-long-will-global-warming-last/
  15. Here's a nice graphic to help visualize the "long tail" of atmospheric CO2 (the very long residence time): Kinda heightens the imperative to the danger excess CO2 carries: there is no quick fix. Temps that go up will, like the CO2 elevations, go down slowly. On the plus side, no ice ages in our immediate futures! The Yooper
  16. DB, thanks for those graphs. They seem to confirm something that I've been meaning to ask about. Specifically, we know that right now the oceans are absorbing about half the CO2 human industry releases each year. It would seem logical that if we stopped releasing all that CO2 the oceans would then start to absorb some of the excess we have built up... which would lead to an initial rapid decline in atmospheric CO2 level and then a long slow decline once equilibrium between the atmosphere and oceans was reached. This matches what is shown in the chart. Thus, while it would take tens of thousands of years to get back down to the historical level of ~280 ppm from where we are now there is still a lot to be gained from limiting emissions as quickly as possible... because that could allow us to drop back down to 350 ppm or lower within a few decades. The biggest problem is really our continuous CO2 emissions... our annual output is overwhelming what the natural sinks can 'sequester' (short term) each year and building up in the atmosphere. If we reduced emissions by about half there'd be no further atmospheric accumulation, and if we reduced emissions further than 50% atmospheric levels would start to drop.
  17. Skeptical Science's condensation doesn't match the original argument it attributes to Solomon. But then, Solomon's argument is too sketchy to be coherent with the IPCC AGW model. IPCC did not interpret its assignment to prove AGW. It converted its UN charter to do scientific research on the subject by first assuming that AGW exists, the AGW conjecture, then setting about to gather supporting evidence. Since the late '50s, the unparalleled CO2 record reduced from MLO measurements showed a bulge in CO2. That bulge was coincident with an increasing global temperature reduced from global measurements. What IPCC needed to establish was that the MLO record was global, not regional. For that, it relied on the long-lived conjecture, attributed to Henning Rodhe who in 1973 co-authored a paper on the subject with Bert Bolin, the first IPCC chairman from 1988 to 1997. Rodhe would become a Contributing Author on the TAR. As IPCC said, >> Because these gases are long lived, they become well mixed throughout the atmosphere much faster than they are removed and their global concentrations can be accurately estimated from data at a few locations. AR4, Technical Summary, pp. 23-24. By the way, Skeptical Science says correctly that by definition turnover time applies to the reservoir size and the rate of removal. Then it says incorrectly that the lifetime of an individual particle depends on the "flow into (or out of)" a reservoir. Not so! Replenishment is a separate phenomenon from residence time. With the well-mixed/long-lived assumption under its belt, IPCC could proceed to calibrate all CO2 measurement stations against MLO. See "identification" of other stations with the "seasonally adjusted CO2 concentration at Mauna Loa", Keeling, CD, et al., "Exchanges of Atmospheric CO2 and 13CO2 with the Terrestrial Biosphere and Oceans from 1978 to 2000; I. Global Aspects", SIO Reference No. 01-06, June 2001, ¶2.2, p. 6. Lest IPCC be accused of using correlation to establish cause and effect, it needed to show that the bulge in CO2 at MLO, now global, was caused by man. To do this, it sought to establish two human fingerprints. One was that the growth in atmospheric CO2 paralleled the decline in atmospheric O2. The other was that the isotopic fraction of CO2 measured at MLO declined in proportion to the emissions of the isotopically lighter fossil fuel emissions. IPCC accomplished both by deceptive graphics, absent any supporting computation. See re AR4, Figure 2.3, SGW, Part III, A, rocketscientistsjournal.com. As insurance, IPCC showed how CO2 emissions accumulate in the atmosphere, notwithstanding the solubility pump. The uptake by the ocean, IPCC claimed, was paced by the sequestration processes of the biological pumps. This was because IPCC adopted the model that the surface layer was in thermodynamic equilibrium, thus the stoichiometric equations with their attendant equilibrium coefficients applied. This assumption controls the ratio of molecular CO2 that can exist in the surface layer. It has the bonus effect that added atmospheric CO2 must acidify the ocean. This is, of course, scientific claptrap. The surface layer is in neither thermal equilibrium, nor mechanical equilibrium, nor chemical equilibrium, the three components of thermodynamic equilibrium. IPCC reaches back to Revelle & Suess's failed attempt in 1957 to show how the ocean buffered against CO2 uptake. A reasonable alternative is that thermodynamic equilibrium is not present, that Henry's Law applies, and consequently the on-going buffering is the surface layer holding excess CO2, not the atmosphere. By the way, when IPCC tried to measure the Revelle Buffer in the open ocean, it discovered Henry's Law! When questions arose about the evidence in the second draft review, IPCC deleted it "in order not to confuse the reader." See "On Why CO2 Is Known Not To Have Accumulated in the Atmosphere, … ", rocketscientistsjournal.com. And what happens to the natural flux of CO2? According to IPCC modeling, it proceeds at a rate about 30 times faster than anthropogenic CO2, balanced and unfazed by surface layer chemistry. In the AGW model, natural and manmade CO2 obey different laws. Normal scientific skepticism applied to the AGW model is well-rewarded. It exposes much more than error.
  18. drrocket@17 wrote: "it needed to show that the bulge in CO2 at MLO, now global, was caused by man." If you want to argue that man was not the cause of the observed rise in atmospheric CO2, you need to be able to explain why the annual rise in atmospheric CO2 has always been less than anthropogenic emissions for the last fifty years. Do the math, if nature is a net source of CO2, then the observed rise will be greater than anthropogenic emissions, as the annual rise is equal to total emissions minus total uptake. However, this is observed not to be the case, which rules out the possibility that the observed rise is natural as it proves the natural envrionment is a net carbon sink rather than a source.
  19. Marsupial at 11:08 AM 2/15/11, Your logic is peccable. First, nature is indeed a net source of CO2 in warming epochs, such as the last 50 years. That is Henry's Law, never mentioned by IPCC. Second, the observed rise could be anything. We don't have the powers of perfect observation. The problem is not trivial because MLO sits in the plume of Eastern Equatorial Pacific outgassing, where the CO2 concentration depends primarily on local temperature. Further, what is "observed" from MLO is a highly processed record, far from raw data. For example, >> Each CO2 concentration record, C (t) was decomposed into a seasonal function, consisting of four harmonics, and a seasonally detrended function, according to the relation [C(t) = C_seas(t) + C_annual(t)] (2.1) where [C_seas(t) = (1-γt) * sum((a_k*sin(ω_k*t) + b_k*cos(ω_k*t)), k = 1 to m] (2.2) >>In the second expression γ (a "gain factor") and the factors, a_k and b_k, denote constants obtained via a fit to the data; t denotes the time in years; ω_k the angular frequency, equal to 2πk; and m the number of harmonics, chosen to be 4. The seasonally adjusted function, C_annual, is expressed by a spline function in which the annual average of the integral of the squared second derivative is set to a predetermined value to provide a nearly uniform degree of smoothing of all of the records. The actual function is established in several steps involving intermediate functions (see Keeling et al. [1989a, p. 167 and pp. 218-227]) to assure stability in the calculation and to determine monthly averages that take into account the actual dates of each observation. The isotopic record, δ13C(t), is treated similarly. Keeling, CD, et al., "Exchanges of Atmospheric CO2 and 13CO2 with the Terrestrial Biosphere and Oceans from 1978 to 2000, I. Global Aspects, June, 2001, p. 5. "Predetermined"? "Nearly uniform"? "Smoothing"? "Intermediate functions"? "Assure stability"? Read how other stations were "identified" with MLO data, how data were adjusted according to "a long-term trend line proportional to industrial CO2 emissions". Id., p. 6. These "data [that] have iconic status in climate change science as evidence of the effect of human activities" [AR4, ¶1.3.1, "The Human Fingerprint on Greenhouse Gases", p. 100] are over-masticated, over-celebrated, and over-fraught with opportunities for subjective influences. Third, your claim that the "then the observed rise will be greater than anthropogenic emissions, as the annual rise is equal to total emissions minus total uptake" is false, if by your second use of the word emissions you are referring to your immediately preceding phrase, "anthropogenic emissions". The annual rise must be equal to the total inputs minus the total uptakes. Fourth, your ultimate claim that "the natural environment is a net carbon sink rather than a source" is false. Take a look at the Vostok Record, for example, a period in which man surely had no effect. Sometimes the natural environment is a net sink, sometimes a net source.
  20. drrocket, a warming ocean can be a net sink of CO2, see /Seawater-Equilibria.html
  21. drrocket: "not trivial because MLO sits in the plume of Eastern Equatorial Pacific outgassing" There's no discernible difference between the monthly MLO CO2 concentration and any station around the world at a comparable latitude -- island or landlocked, no difference. See the thread MLO is a volcano for further information and comments.
  22. Maybe someone can help me. I think I've figured this out, but I'm not sure. At NASA OCO , it is stated (within the first paragraph) that: "Measurements from a global network of surface stations indicate that atmospheric CO2 increased by 1% annually over the past 40 years -- i.e., from 326 ppmv in 1970 to 389 ppmv in 2010." If atmospheric CO2 increased annually by 1% between 1970 and 2010, and the CO2 concentration was 326 ppmv in 1970, then wouldn't the 2010 CO2 concentration be 326*(1.01**40)= 485 ppmv? OK, this is what I think is happening. In reality, the 1% increase is in emissions. But only 43% of that remains in the atmosphere on average. Thus, we would see an increase in atmospheric CO2 concentration of 326*(1.0043**40)=387 ppmv, which is consistent with the 2010 MLO CO2 concentration of 389.78 ppmv. I am trying to debate a GW skeptic and that person simply says that NASA is "lying." It's not clear what NASA would be lying about. Can someone help me out? Is my thinking correct?
  23. drrocket@19 wrote "First, nature is indeed a net source of CO2 in warming epochs, such as the last 50 years." No, that simply isn't true; if it were true, the annual rise in atmospheric carbon would be greater than anthropogenic emissions instead of less, becuase both man and nature were contributing to the rise. This is a simple bit of accounting, and the uncertainties involved are too small to have any bearing on the conclusion. While temperature does affect uptake of CO2 by the oceans, the fluxes also depend on the difference in partial pressure of CO2 between the atmosphere and surface waters, so if atmospheric CO2 rises, ocean uptake increases. This is known physics. "Third, your claim that the "then the observed rise will be greater than anthropogenic emissions, as the annual rise is equal to total emissions minus total uptake" is false, if by your second use of the word emissions you are referring to your immediately preceding phrase, "anthropogenic emissions"." No, by "total emissions", I meant total emissions, i.e. anthropogenic emissions plus natural emissions. "The annual rise must be equal to the total inputs minus the total uptakes. " yes, that is the very basis of the mass balance argument that proves that the rise is anthropogenic. "Fourth, your ultimate claim that "the natural environment is a net carbon sink rather than a source" is false. Take a look at the Vostok Record, for example, a period in which man surely had no effect. Sometimes the natural environment is a net sink, sometimes a net source." Irrelevant, I am stating what is observed to be happening now, not thousands of years ago. However, the paleoclimate data strongly suggests that the rise is not natural. In the Vostok data you only see a change in CO2 of 100ppmv in response to the sort of temperature change you see at the start of an interglacial (about 10 degrees C), whereas now we have seen a rise of 100ppmv with a temperature rise of less than a degree. So can you explain why the oceans are suddenly so much more temperature sensitive now than they have been for the last 800,000 years? There are parts of AGW theory that are uncertain; that the rise in CO2 is of anthropogenic origin simply isn't one of them.
  24. drrocket - "...nature is indeed a net source of CO2 in warming epochs, such as the last 50 years..." Not quite right. Warming decreases ocean solubility for CO2, and in the absence of other effects will outgas until the partial pressure of CO2 matches solubility and oceanic concentrations of CO2 complexes. However, if the partial pressure rises, as is the case with our emissions, then the ocean will absorb CO2. It's a race between decreasing solubility due to warming and partial atmospheric pressure, and atmospheric pressure is well in the lead right now. The oceans are a CO2 sink, sequestering ~45% of our emissions.
  25. @ koyaanisqatsi (22) Patience is a virtue (or so I'm told). Anyway: You're friend is nuts/wrong/misled/mistaken (your call which). Flask, in-situ, ice core: all datasets show increasing concentrations of a globally well-mixed gas. We can even see it from orbit: And over geologic time: Have a great day! The Yooper

1  2  3  4  5  Next

Post a Comment

Political, off-topic or ad hominem comments will be deleted. Comments Policy...

You need to be logged in to post a comment. Login via the left margin or if you're new, register here.

Link to this page


The Consensus Project Website

THE ESCALATOR

(free to republish)


© Copyright 2024 John Cook
Home | Translations | About Us | Privacy | Contact Us