Climate Science Glossary

Term Lookup

Enter a term in the search box to find its definition.

Settings

Use the controls in the far right panel to increase or decrease the number of terms automatically displayed (or to completely turn that feature off).

Term Lookup

Settings


All IPCC definitions taken from Climate Change 2007: The Physical Science Basis. Working Group I Contribution to the Fourth Assessment Report of the Intergovernmental Panel on Climate Change, Annex I, Glossary, pp. 941-954. Cambridge University Press.

Home Arguments Software Resources Comments The Consensus Project Translations About Support

Bluesky Facebook LinkedIn Mastodon MeWe

Twitter YouTube RSS Posts RSS Comments Email Subscribe


Climate's changed before
It's the sun
It's not bad
There is no consensus
It's cooling
Models are unreliable
Temp record is unreliable
Animals and plants can adapt
It hasn't warmed since 1998
Antarctica is gaining ice
View All Arguments...


Username
Password
New? Register here
Forgot your password?

Latest Posts

Archives

CO2 emissions change our atmosphere for centuries

What the science says...

Individual carbon dioxide molecules have a short life time of around 5 years in the atmosphere. However, when they leave the atmosphere, they're simply swapping places with carbon dioxide in the ocean. The final amount of extra CO2 that remains in the atmosphere stays there on a time scale of centuries.

Climate Myth...

CO2 has a short residence time

"[T]he overwhelming majority of peer-reviewed studies  [find] that CO2 in the atmosphere remained there a short time." (Lawrence Solomon)

The claim goes like this:

(A) Predictions for the Global Warming Potential (GWP) by the IPCC express the warming effect CO2 has over several time scales; 20, 100 and 500 years.
(B) But CO2 has only a 5 year life time in the atmosphere.
(C) Therefore CO2 cannot cause the long term warming predicted by the IPCC.

This claim is false. (A) is true. (B) is also true. But B is irrelevant and misleading so it does not follow that C is therefore true.

The claim hinges on what life time means. To understand this, we have to first understand what a box model is: In an environmental context, systems are often described by simplified box models. A simple example (from school days) of the water cycle would have just 3 boxes: clouds, rivers, and the ocean.

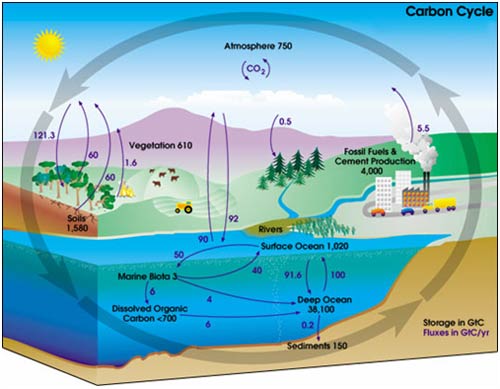
A representation of the carbon cycle (ignore the numbers for now) would look like this one from NASA.
In the IPCC 4th Assessment Report glossary, "lifetime" has several related meanings. The most relevant one is:

“Turnover time (T) (also called global atmospheric lifetime) is the ratio of the mass M of a reservoir (e.g., a gaseous compound in the atmosphere) and the total rate of removal S from the reservoir: T = M / S. For each removal process, separate turnover times can be defined. In soil carbon biology, this is referred to as Mean Residence Time.”

In other words, life time is the average time an individual particle spends in a given box. It is calculated as the size of box (reservoir) divided by the overall rate of flow into (or out of) a box. The IPCC Third Assessment Report 4.1.4 gives more details.

In the carbon cycle diagram above, there are two sets of numbers. The black numbers are the size, in gigatonnes of carbon (GtC), of the box. The purple numbers are the fluxes (or rate of flow) to and from a box in gigatonnes of carbon per year (Gt/y).

A little quick counting shows that about 200 Gt C leaves and enters the atmosphere each year. As a first approximation then, given the reservoir size of 750 Gt, we can work out that the residence time of a given molecule of CO2 is 750 Gt C / 200 Gt C y-1 = about 3-4 years. (However, careful counting up of the sources (supply) and sinks (removal) shows that there is a net imbalance; carbon in the atmosphere is increasing by about 3.3 Gt per year).

It is true that an individual molecule of CO2 has a short residence time in the atmosphere. However, in most cases when a molecule of CO2 leaves the atmosphere it is simply swapping places with one in the ocean. Thus, the warming potential of CO2 has very little to do with the residence time of individual CO2 molecules in the atmosphere.

What really governs the warming potential is how long the extra CO2 remains in the atmosphere. CO2 is essentially chemically inert in the atmosphere and is only removed by biological uptake and by dissolving into the ocean. Biological uptake (with the exception of fossil fuel formation) is carbon neutral: Every tree that grows will eventually die and decompose, thereby releasing CO2. (Yes, there are maybe some gains to be made from reforestation but they are probably minor compared to fossil fuel releases).

Dissolution of CO2 into the oceans is fast but the problem is that the top of the ocean is “getting full” and the bottleneck is thus the transfer of carbon from surface waters to the deep ocean. This transfer largely occurs by the slow ocean basin circulation and turn over (*3). This turnover takes 500-1000ish years. Therefore a time scale for CO2 warming potential out as far as 500 years is entirely reasonable (See IPCC 4th Assessment Report Section 2.10).

Intermediate rebuttal written by Doug Mackie


Update July 2015:

Here is the relevant lecture-video from Denial101x - Making Sense of Climate Science Denial

Last updated on 5 July 2015 by pattimer. View Archives

Printable Version  |  Offline PDF Version  |  Link to this page

Argument Feedback

Please use this form to let us know about suggested updates to this rebuttal.

Update

Updated 'the skeptic argument' on 02/05/2012 to correct formatting errors

Comments

Prev  1  2  3  4  

Comments 76 to 80 out of 80:

  1. Dikran Marsupial, 5/15/11, 02:32 AM, CO2 residence 1. Even IPCC, which capitalizes on the sequestration conjecture, would not set U_a = 0. With its full sequestration bottleneck in effect, IPCC makes U_a = 0.55 E_a. 2. Sequestration does not operate by the biological pumps being connected to the atmosphere as IPCC shows in its carbon pumps. AR4 Figure 7.10, The biological pumps of sequestration must draw from ionized CO2, not molecular CO2 in the air. Nor can pumps operate as IPCC expresses in its equation for the Bern Carbon cycle. AR4, Table 2.14, p. 213. See these reproduced and discussed discussed here as Figure 10 and Equation 30. The equation is a model in which each of the pumps has its own, independent reservoir. The solubility pump (IPCC calls the "solution pump") has access 18.6% of the atmosphere, the organic carbon pump has access to a separate 33.8% of the atmosphere, and the CaCO3 counter pump has access to 25.9% of the atmosphere, leaving 21.7% of atmosphere not connected to any pump. The ocean is not well-represented by that configuration. The solubility pump has access to 100% of the atmosphere, a volume of the dissolved CO2 greater than that at equilibrium remains in molecular form, or nearly so, to satisfy Henry's Law and to be ionized to feed the two biological pumps. Established physics cannot be relied on or ignored by replacing physical terms with new definitions peculiar to climatology. That requires special treatment for novel validation. Equilibrium cannot replace steady state to extend the validity of the Second Law of Thermodynamics. Replacing thermodynamic equilibrium with dynamic equilibrium invalidates equilibrium chemistry. Replacing residence time with a unique adjustment time invalidates the principles of math and physics that govern even a simple leaking pail.
  2. Eric (skeptic), 5/15/11, 21:10 PM, CO2 residence Where I said twice in 10.1 that the natural environment was a lagging source, I should have said, of course, that is a leading source. Sorry. The Vostok record, being from ice cores, is a heavily low-pass filtered version of what we measure with modern CO2 instrumentation, and it has a prolonged sample interval. The integration time in an ice core reportedly is as large as a millennium or two, compared to at most one minute in the manual mode for modern measurements. The sample time for Vostok is about 1,300 years compared to a minute or less for modern instrumentation. The confidence level for the Vostok record to detect an event like the half century surge at MLO is not the usual 90% or 95%; it is about 3%. Alternatively. if Vostok were to have included an MLO-like surge, it's standard deviation would have been attenuated by the square root of, say, 1000 years divided by 1 minute (5.26*10^8), or 23,000. The Vostok record is not directly comparable to, say, the MLO record. If you want to compare Vostok and MLO either in CO2 increase or the rate of CO2 per ºC, you want first to filter the MLO record with a low pass filter with a time constant between 30 and 2000 years. What do you get then?
  3. drrocket wrote: "1. Even IPCC, which capitalizes on the sequestration conjecture, would not set U_a = 0. With its full sequestration bottleneck in effect, IPCC makes U_a = 0.55 E_a." No, U_a does not represent the uptake of anthropogenically generated CO2 by the environment, it represents the removal of CO2 from the atmosphere due to human activities, i.e. it represents artificial carbon sequestration. The IPCC clearly would not say that we annually sequester (e.g. via carbon capture schemes) 55% of the carbon we emit. We annually sequester a fraction of a percent of out emissions, such a small amount that it isn't currently worth discussing. Note that I have already pointed out your misunderstanding in this post. The fact that you are continuing in the misunderstanding suggests you are not reading the responses to your arguments with sufficient diligence. To be clear, anything with a _n subscript represents fluxes into or out of the atmosphere as part of the natural carbon cycle, anything with a _a subscript represents anthropogenic emissions (fossil fuel use and land use changes) or artificial sequestration of carbon (e.g. burying carbon in mines or pumping it into aquifers etc, which is to all intents and purposes effectively zero). Your second point is irrelevant as it is due to your misunderstanding of what U_a represents. The oceanic solubility pump and organic carbon pumps are described by U_n, not U_a.
  4. Dikran Marsupial, 5/15/11, 21:08 PM, CO2 residence IPCC uses Figure 7.3 to convey to its target audience, the Policymakers, how it models climate. IPCC (1) computes the response of the climate to the natural cycles in balance, (2) computes separately the response to anthropogenic unbalanced forcings, and (3) adds the two. Aside: This additive treatment, coupled with IPCC's admission that climate as modeled is non-linear, violates a principle of system science: additive applies only to linear systems. The erroneous addition leads to nonsense. Regardless, had IPCC's strange model only resulted in a non-trivial prediction subsequently validated, it would have been scientifically acceptable. It didn't, and it isn't. IPCC uses its own version of system science, not even aware of this traditional and highly relevant system modeling specialty. James Hansen introduced climate feedback explicitly from system science (Bode) in 1984. By the time it got into IPCC Reports and models, it bore no resemblance to its definition in science or its use by Hansen. Once a signal internal to a system that alters the system inputs, IPCC turned it into correlation between system parameters, and, at other times, a computer parameter calculated at run time. Natural fluxes used in IPCC's model, IPCC shows in black in the figure, and anthropogenic fluxes in red. You may not change those assignments and have any claim to being rational or honest. You have arbitrarily and intentionally juggled the data, changing IPCC's message just so you could say I was incorrect. To be specific, in your list you have erroneously added four black items to two red ones. Previously, you demonstrated a willingness to replace residence time with a phony adjustment time. You have also denied the physics of the leaking pail. I suspect that you would be among those who change balance to equilibrium, and thermodynamic equilibrium to dynamic equilibrium, balance or steady state. Or change feedback signals into correlations. When an AGW supporter uses a word, it means just what he chooses it to mean, nothing more, nothing less. All this is not my pedantism; it is your equivocation. It may be consistent with IPCC Reports, its climatologists, and other AGW believers, but that's the kind of support you want to avoid. Equivocation is not just inconsistent with science, it is intolerable. Science is an exacting discipline; AGW climatology is not. Equivocation is illogical and irrational. It violates my candidate for the first axiom of science: its domain is in the rational. If you just do the basic accounting honestly, putting numbers in their proper columns, you will validate my posts on the subject.
  5. DrRocket wrote: "Natural fluxes used in IPCC's model, IPCC shows in black in the figure, and anthropogenic fluxes in red. You may not change those assignments and have any claim to being rational or honest." You obviously didn't read the caption, the black arrows represent the "pre-industrial ‘natural’ fluxes in black". In the section below the figure, it says "In Figure 7.3 the natural or unperturbed exchanges (estimated to be those prior to 1750) among oceans, atmosphere and land are shown by the black arrows." The red arrows show the anthropogenically induced post-industrial changes in those natural fluxes. These changes are partly due to increased temperature and partly due to increased atmospheric CO2. For example consider the red arrow labelled "land sink" - it represents the increase in GPP due to the additional "plant food" (CO2) in the atmosphere. Of course prior to 1750 the natural fluxes were in close balance, at that time atmospheric CO2 was essentially constant and anthropogenic emissions were negligible. That doesn't mean natural fluxes are exactly balanced now - nobody is claiming they are. The direct anthropogenic fluxes are the two labelled "fossil fuel" and "land use change". The other red arrows represent feedback responses of the natural carbon cycle to the anthropogenic emissions. That is why they are described as "anthropogenic", note the use of quotes in "and ‘anthropogenic’ fluxes in red".
  6. drrocket - I quoted what I saw, which appeared to be your words; my mistake. Rereading your post you were re-stating an earlier IPCC statement. However, what I was responding to was your apparent misunderstandings on CO2 sources/sinks and the mass balance issues. Preindustrially CO2 exchanges were in rough balance between sources and sinks. We've added ~29GT/year to the sources, and we're observing an atmospheric increase equal to ~13-14GT/year. Natural carbon sinks, primarily the ocean, are absorbing more than half of the excess, but we're still seeing rising atmospheric CO2. Without our CO2 contribution, given the observed rates, atmospheric levels would be declining at ~2ppm/year. Hence we are responsible for the rise in CO2. I'm also under the distinct impression that you are overemphasizing residence times for individual molecules of CO2 versus adjustment times for total concentrations - our primary concern is the adjustment time, which is hundreds of years at a minimum. Finally, you've made a great deal of the isotopic differences in carbon. Those isotopic differences make it possible to determine attribution of the CO2 present (source determination), but don't affect carbon sinks. Nobody claims (as you stated) that "Natural CO2 is far more soluble than anthropogenic CO2" - that's a complete strawman. You've made a number of strawman arguments, much discussion of detail while overlooking the big picture, all for what to me is a rather unclear claim that our CO2 emissions are not significant. I would disagree.
  7. Dikran Marsupial, 5/16/11, 2:28 AM, CO2 residence You took what IPCC wrote out of context to misconstrue it. Here's the full paragraph, with your extraction underscored: In Figure 7.3 the natural or unperturbed exchanges (estimated to be those prior to 1750) among oceans, atmosphere and land are shown by the black arrows. The gross natural fluxes between the terrestrial biosphere and the atmosphere and between the oceans and the atmosphere are (circa 1995) about 120 and 90 GtC yr^–1, respectively. Just under 1 GtC yr^–1 of carbon is transported from the land to the oceans via rivers either dissolved or as suspended particles (e.g., Richey, 2004). While these fluxes vary from year to year, they are approximately in balance when averaged over longer time periods. Additional small natural fluxes that are important on longer geological time scales include conversion of labile organic matter from terrestrial plants into inert organic carbon in soils, rock weathering and sediment accumulation (‘reverse weathering’), and release from volcanic activity. The net fluxes in the 10 kyr prior to 1750, when averaged over decades or longer, are assumed to have been less than about 0.1 GtC yr^–1. For more background on the carbon cycle, see Prentice et al. (2001), Field and Raupach (2004) and Sarmiento and Gruber (2006). Bold added, AR4, ¶7.2.1.1 The Natural Carbon Cycle, p. 514. 1. The natural flux estimates are updated as of 1995. 2. The 120 GtC/yr, above, equals GPP on Figure 7.3, but the gross natural flux of 90 GtC/yr is awkwardly not confirmed there. IPCC seems to have arbitrarily and pointlessly converted ± 20 GtC/yr of natural air-sea flux into ACO2. If you wanted to change the red-black assignment, I would have no objection to you converting this ± 20 GtC back from red to black. That would be harmless and would not change the natural balance, nor for that matter, the absolute anthropogenic imbalance. Best of all, that conversion would support the 90 GtC/yr figure from ¶7.2.1.1. 3. You might misread "these fluxes" in the fourth sentence, but, being plural, it is a reference to the gross natural fluxes in the second sentence plus (reasonably and without loss of generality) the Richey flux. This assignment follows since the Richey flux immediately preceding in the third sentence is not only inconsequential, but singular and not plural, confirmed in Figure 7.3 at 0.8 GtC/yr. 4. The gross natural fluxes are approximately in balance when averaged over longer time periods than year to year. 5. Because natural fluxes are approximately in balance over periods of longer than one year, IPCC justifiably modeled them as in balance going back to 1750, the nominal start of the industrial era. 6. Therefore the natural fluxes in Figure 7.3 are as of 1750, revised in 1995, and are still valid "as of end 1994" (caption, Figure 7.3). The natural fluxes are not, as you suggest, just preindustrial values, but fluxes for all seasons. 7. IPCC used color to distinguish between natural and anthropogenic CO2 and CO2 fluxes, and not, as you imagine, to distinguish between 1750 and modern CO2. Figure 7.3 is not an illustration of carbon cycle change during the industrial era. It is a diagram to teach Policymakers how IPCC models climate.
  8. drrocket wrote: "2. The 120 GtC/yr, above, equals GPP on Figure 7.3, but the gross natural flux of 90 GtC/yr is awkwardly not confirmed there." No, actually the figure does confirm the 90GtC/yr figure, add the 70GtC/yr pre-industrial flux into the surface oceans and the 22 GtC/yr post-industrial change, you get something "about 90 GtC/yr" "IPCC seems to have arbitrarily and pointlessly converted ± 20 GtC/yr of natural air-sea flux into ACO2." Yes, it would indeed be arbitrary and pointless. For most people that would be an indication that perhaps that is not what the IPCC has done and that perhaps they had misinterpreted something somewhere. As it happens it is not what they have done. "7. IPCC used color to distinguish between natural and anthropogenic CO2 and CO2 fluxes, and not, as you imagine, to distinguish between 1750 and modern CO2" My interpretation is consistent with the caption of the figure that explicitly states the black arrows represent the pre-industrial natural fluxes. "The global carbon cycle for the 1990s, showing the main annual fluxes in GtC yr–1: pre-industrial ‘natural’ fluxes in black" Your interpretation is inconsistent with the figure caption. That suggests to me that your interpretation is incorrect. My interpretation also gives figures for the 1995 fluxes that are consistent with those given in the papers referenced by the IPCC. Your doesn't. Again that suggests my interpretation is correct and yours is incorrect. However, it is clearly pointless discussing this any further, as you appear to know better than the IPCC and more than virtually all of the skeptic climatologists, of whom only Segalstad appears to believe the rise in CO2 is not anthropogenic. That should tell you something.
  9. O.K. Drrocket, lets try and make some progress and try again to go through this step by step. Conservation of mass suggests that any carbon emitted into the atmosphere that isn't taken up by the environment will stay in the atmosphere and cause atmospheric concentrations to increase. More specifically dC = E_a + E_n - U_a - U_n where: dC is the annual change in atmospheric CO2 in GtC/yr E_a is anthropogenic CO2 emissions, from land use changes and fossil fuel use U_a is anthropogenic uptake. This is not the amount of anthropogenic CO2 removed from the atmosphere each year. It is the amount of CO2 (from whatever source) removed from the atmosphere as a result of human activity. This means things like carbon capture and storage. Please pay particular attention to that point as you have already misinterpreted it twice. U_a is effectively 0GtC/yr. Our efforts at carbon capture and storage so far have been negligible compared with our emissions. E_n is natural emissions from the carbon cycle, in other words respiration, volcanic emissions, emissions from the surface ocean. U_n is natural uptake as part of the natural carbon cycle, in other words CO2 removed from the atmosphere as a results of chemical weathering, gross primary production, and absorption by the surface ocean (organic pump + solubility pump). Now please, no long rambling list of points, just give a direct answer do you agree with the carbon mass balance equation I have given in this post?
  10. Dikran Marsupial, 5/16/11, 6:13 AM, CO2 residence No one but you, now, said "about 90 GtC/yr", and about 90 does not mean 90. What you can support off Figure 7.3 is 92.2. That's the sum of 70 nCO2 plus an arbitrary 20 deduced to be ACO2 formerly nCO2, plus a critically important 2.2 ACO2. You can't just round off these numbers because that scraps a critical 27.5% of the total ACO2 flux. My fluxes are fully consistent with IPCC's fluxes. I do not rely on competing data sets, competing means of data reduction, or competing climate models, except to fill an IPCC void. I rely on nothing to contradict IPCC but the following: ( -Long rambling list of points snipped- ) ( -Long rambling discourse on ethics snipped- ). ( -Allegations of impropriety snipped- ). ( -Inflammatory snipped- ).
    Response:

    [DB] Please follow Dikran's lead; a better compliance with the Comments Policy is also requested.  Gish Gallop's normally get deleted en toto.

  11. Dikran Marsupial, 5/16/11, 6:23 AM, CO2 residence OK. Good approach. Answer: No. I disagree with your definition and evaluation of U_a. U_a are those particular molecules of ACO2, whether from fossil fuel combustion or land use, that end up in the surface reservoirs per year. I agree that man's sequestration of CO2 is negligible, limited, for example, to the manufacture of dry ice and tankage of CO2. So we don't have to worry about the apportionment of that sequestered CO2 between ACO2 and nCO2. But U_a must include the processes implied in Figure 7.3, i.e., the land-sink and dissolution in the surface waters. It wouldn't matter that U_a is inferred, and not directly measurable. That's true of all thermodynamic macroparameters, and we still deal with Global Average Surface Temperature and Global Average Albedos. Your move.
  12. drrocket - The appropriate term for your last post with a large list of items is a Gish Gallop; a long list of untruths, misconceptions, and errors. I will not attempt to answer each of these, but I will note that if you look at the Most Used Skeptic Arguments list on the upper left, you will find that most of these items have been addressed in the appropriate threads.
  13. drrocket - Why are you referring to particular molecules of anthropogenic CO2 in that equation, when Dikran specifically defined it as the total CO2 of whatever origin sequestered by mankind? If you insist on such a term, you will be required to add an additional term for natural origin CO2 also sequestered, or the equation will not contain all the sums. And Dikran has already done that by using a single term.
  14. drrocket... "Your move." So are you implying that this is just a chess game to you and not a rational discussion of the data and its meaning? Perhaps that is why you never seem to address the nub of the question. I still don't see how you intend to explain the persistent post industrial increase in CO2 with a natural net source given that... 1. The increase in atmospheric CO2 is less than predicted if all CO2 released by human activities remained in the atmosphere. 2. The change in stable isotopic composition of that CO2 indicates a source that is plant matter in origin. 3. The reduction in atmospheric O2 and the acidification of the ocean indicates that the ocean can't be the source and is instead a sink. 4. The change in terrestrial pools hasn't been nearly large enough to explain the increase in atmospheric CO2 5. The changes to terrestrial pools that have occured are due to human activities anyway.
  15. drrocket wrote: "Answer: No. I disagree with your definition and evaluation of U_a ... U_a are those particular molecules of ACO2, whether from fossil fuel combustion or land use, that end up in the surface reservoirs per year." Sorry drrocket, you are just being absurd now. I set out the mass balance equation and defined exactly what the terms mean. The question is, do you agree with the mass balance equation with the terms having the meanings I defined. If you do not, your position is absurd as it means that you don't agree that the annual increase in CO2 is the difference between total emissions (E_a + E_n) and total uptake (U_a + U_n which is approximately just U_n as U_a is essentially zero). Which is blindingly obvious to anyone capable of balancing a bank account. I suspect your attempt to change the meanings of the terms is just an attempt to avoid properly engaging in a line of discussion that will rapidly prove you wrong. It happens a lot in discussions with "skeptics". So, give a direct answer the question as posed and prove that you are not just trying to evade a line of discussion that will prove you wrong.
  16. drrocket (#77) you said "...you want first to filter the MLO record with a low pass filter with a time constant between 30 and 2000 years. What do you get then?" My concluding sentence in #75 would still stand (any excess over 10 ppm is man-made since the ice core change is about 10 ppm per degree C).
  17. I noticed this thread was referenced in the new "CO2 rising faster than PETM" thread. I wrote a spreadsheet that I just made publicly accessible (forgot to do that above). I used the published figures for CO2 added the atmosphere 1750-2008. Then I assumed an expoential decay. Nature absorbs about 1/2 of our added amount each year and since that is a consistent result year after year, an exponential decay back to preindustrial is a reasonable assumption. Based on the rise to 2008, the lambda is 4.25 (I also assume lambda is constant when it seems likely to rise with CO2 concentration). The half life of CO2 (time to return 1/2 way back to preindustrial) is 48 years. An argument that the "lifetime" of CO2 is 500 years or more is ill-defined and somewhat spurious. Yes, it would take that long to get all the way back to preindustrial, but getting half way back in 50 years is more meaningful. The document link is here: http://public.iwork.com/document/?a=p1415598010&d=CO2growth.numbers
  18. Eric (skeptic) The constant airborne fraction (45%) is essentially due to the fact that anthropogenic emissions are rising approximately exponentially. This result is easily reproduced by a one-box model of the carbon cycle (I am working on an article on this topic). That means if anthropogenic emissions are cut then the airborne fraction will be no longer constant. IIRC a simple one-box model of the carbon cycle gives an adjustment of about 74 years once you take that into account. There is nothing spurious about the 500+ year time scale. The carbon cycle can only be approximated very roughly by simple models such as yours. There are other reasonably well understood physical reasons (e.g. slow transfer of carbon between the surface and deep ocean) that make the simple model give unrealistically low estimates. If you want to look more deeply into these issues, I can recommend David Archer's primer on the carbon cycle, reviewed here However, your calculation is still much more accurate that Essenhigh's, as you obviously understand the difference between residence time and adjustment time. Also, CO2 levels falling about halfway back to pre-indiustrial levels in about 50 years is pretty much the mainstream view (posted by Daniel earlier in the thread)
  19. Thanks for the feedback. Yes, I understand impulse response times from engineering, but in engineering one does not generally black box the system being studied and just measure current and voltage. However the CO2 system should be treatable as a passive system to a point (extreme warming may turn it into an active system)
  20. Eric (skeptic) An engineer (I started out as an electronic engineer myself) ought to approve of the kind of models used in carbon cycle modelling (lots of differential equations). They are really "white box" models rather than "black box". They are called box models only because each carbon reservoir is modelled as a box with fluxes between boxes defined by the known physics. The "one box" I mentioned earlier is the simplest, with just one box representing the atmosphere, but to get a more realistic estimate of the adjustment time you need to model the other reservoirs (and their feedbacks) in detail (which leads to the long tail on the adjustment). Fascinating subject.
  21. michael, yes my spreadsheet is completely academic since I stopped CO2 in 2008 (I only had CO2 data through 2007) and we are current increasing worldwide, not stopping. Yes, I will take your suggestion and redo it with a somewhat plausible scenario and a BAU for comparison. The back of envelope calculation that supports my estimate is this: the environment is said to absorb 1/2 of our new CO2 each year. But it does not and can not possibly do that. Instead it absorbs about 2% of our total remaining excess over preindustrial (818,000-597,000). Even that is very oversimplified. If it were linear it would be removed in 100 years, or half in 50 years. It clearly is not for the reasons you point out. I would add that warming since the end of the LIA would have increased CO2 by 5-10 ppm had man done nothing at all. But I think an exponential decay to preindustrial is a reasonable estimate until we have more evidence for permafrost melting, etc (those are extremely slow processes).
  22. Eric (skeptic) @96, what the environment does is restore equilibrium between the partial pressure of CO2 in the atmosphere and the partial pressure of CO2 in the upper layer of the ocean. That is a rapid process, sufficiently rapid that even temperature fluctuations of 0.2 degrees C globally averaged can significantly affect the rate of absorption. That would not be the case if the surface and atmosphere where far from equilibrium. Consequently, the idea that the environment absorbs ~50% of annual emissions is much closer to the truth than that it absorbs 2% of the difference between current and pre-industrial CO2 levels. I can make the same point from a different direction. The fact is that ~50% of CO2 emissions have been absorbed annually since the industrial revolution. The rate of absorption is a function of the level of disequilibrium. Given that the rate of absorption has scaled with annual emissions rather than with cumulative emissions since 1850, it follows that the level of disequilibrium correlates with annual emissions rather than cumulative emissions. From that it follows that equilibrium is reached in a time scale close to one year. In the long term, CO2 levels will reduce despite this, because partial pressures of CO2 in the deep ocean and surface will equalize, gradually drawing down atmospheric CO2 to between 25% and 30% above peak values. After that the CO2 is only drawn down by geological processes, ie, over thousands of years. So, to conclude, your spreadsheet is based on a clearly false assumption. Again I refer you to Archer 2008. Or perhaps you will be content with Archer's rule of thumb (now considered optimistic), that CO2 will reduce to 25% increase over pre-industrial levels over a century, and that the remainder is there forever on human time scales. (I refer you to the charts posted by Dikran Marsupial @23.)
  23. Thanks Tom for explaining the rapid equilibrium with the upper ocean layer. If we posed the hypothetical question, what if mankind doubled or halved his contribution from one year to the next, would the upper layer of the ocean still absorb roughly 50%? Fortunately we can answer that question since nature performs this experiment every year. In the NH fall, the biosphere injects about 7 Pg net C into the atmosphere from (I added the NH amounts in table 3 in Randerson et al.: Trends in Seasonal Cycle of Atmospheric CO2 in Global Biogeochemical Cycles, vol. 11, no. 4, pages 535-560, December 1997). These estimates come from measurements of CO2 released and absorbed by various forest types times their area so are mainly empirical data. The comparable empirical data are the 750 Pg C in the atmosphere, the 390 ppm total and the 7 ppm annual cycle (peak to peak or 3.5 trough to peak). That works out to 6.75 Pg of fluctuation versus 7 Pg from the biosphere (net). There are some caveats, the oceans in the SH have a somewhat complementary cycle when they warm in the NH winter and consequently absorb less CO2 a bit after the the NH biosphere is releasing its annually stored CO2. Irregardless, it is clear that comparing the 6.75 to the 7 means that the top layer ocean in general (although mostly NH) absorbs very little of the CO2 released by the biosphere annually. That means that top layer ocean also does not absorb 50% of man's annual output or anything close to that. A much better numerical match is the 2% of man's total excess as I stated above. Another caveat is that the CO2 annual release doesn't mix worldwide in the atmosphere that quickly, but neither does the fossil CO2 in your scenario (it is also mostly NH). Briefly looking at Archer 2008, he and I agree when he states "Of the 9 Gton C/year carbon release from fossil fuels and deforestation from the year 2000 to 2006, 5 Gton C/year is taken up naturally, half by the ocean and half into the terrestrial biosphere (Canadell et al. 2007). One might conclude from these numbers that the uptake time for CO2 must be only a few years, but this would be a misconception. The rate of natural CO2 uptake in any given year is not determined by the CO2 emissions in that particular year, but rather by the excess of CO2 in the atmosphere that has accumulated over the past century. " Other than that, we aren't talking about the same processes since I am referring to the response of the top layer ocean with reasonable turnover to the deep ocean (I have explained on other threads why the deep ocean turnover is so high, it is the reason that the observed warming lags the theoretical warming). His paper discusses an active ocean and other active GHG production made active by AGW. My spreadsheet assumes (and matches the reality to the current day) that the system is passive.
  24. Eric@98 I do not think the conclusion in the third paragraph of your post is supportable. Just because the oceans do not rapidly take up half of the seasonal variation (which is mainly due to changes in the terrestrial biosphere) does not mean that the ocean is not absorbing half of anthropogenic emissions on an annual to decadal scale. The pre-industrial approximate equilibrium means that fluxes between the terrestrial biosphere and oceans must be in approximate balance (otherwise one or the other would be depleted). So it is very unlikely that the surface oceans were mopping up half of the excess forming the seasonal cycle, unless it were giving it back again in the oposite phase of the cycle. If you look at the annual ratio of the increase in atmospheric CO2 to anthropogenic emissions for that year, you will find it is very noisy and only averages out to about 45% over the course of a number of years. Weather noise is so great that you can't get a reasonable estimate of where the carbon goes on a year-to-year time-scale, without the use of physical models.
  25. Dikran, when you say "So it is very unlikely that the surface oceans were mopping up half of the excess forming the seasonal cycle, unless it were giving it back again in the oposite phase of the cycle." I assume you mean preindustrial? Then I am in violent agreement. Why would it be any different from today, except for the year over year increase from fossil fuels? The total fluxes are much larger than the net fluxes from seasonal vegetation (I routinely read 100 Pg of C). However, where I think we differ, is that there is no evidence that the oceans are mopping up any more than a very small portion (a few percent) of the seasonal excess. I noticed the weather noise in the papers and that does argue the opposite of my conclusion, that the top layer ocean is very actively sequestering and releasing CO2 essentially based on ENSO. The problem is that worldwide averages such as average SSTs are quite useless in this situation since the sequestration and release of CO2 from that top layer is very nonlinear. So like you say, we can't do it without a model and that model has to be girdded with some detail.

Prev  1  2  3  4  

Post a Comment

Political, off-topic or ad hominem comments will be deleted. Comments Policy...

You need to be logged in to post a comment. Login via the left margin or if you're new, register here.

Link to this page


The Consensus Project Website

THE ESCALATOR

(free to republish)


© Copyright 2024 John Cook
Home | Translations | About Us | Privacy | Contact Us