


 Arguments


Understanding the significance of the tropospheric hot spot
What the science says...
| Select a level... |
 Intermediate
|
 Advanced
| |||
|
Satellite measurements match model results apart from in the tropics. There is uncertainty with the tropic data due to how various teams correct for satellite drift. The U.S. Climate Change Science Program conclude the discrepancy is most likely due to data errors. |
|||||
Climate Myth...
There's no tropospheric hot spot
The IPCC confirms that computer modeling predicts the existence of a tropical, mid-troposphere “hot spot” about 10km above the Earth’s surface. Yet in the observed record of the Hadley Centre’s radiosondes, the predicted “hot-spot” signature of anthropogenic greenhouse warming is entirely absent (source: Christopher Monckton)
The tropospheric hot spot is due to changes in the lapse rate (Bengtsson & Hodges 2009, Trenberth & Smith 2006, Ramaswamy 2006). As you get higher into the atmosphere, it gets colder. The rate of cooling is called the lapse rate. When the air cools enough for water vapor to condense, latent heat is released. The more moisture in the air, the more heat is released. As it's more moist in the tropics, the air cools at a slower rate compared to the poles. For example, it cools at around 4°C per kilometre at the equator but a much larger 8 to 9°C per kilometre at the subtropics.
When the surface warms, there's more evaporation and more moisture in the air. This decreases the lapse rate - there's less cooling aloft. This means warming aloft is greater than warming at the surface. This amplified trend is the hot spot. It's all to do with changes in the lapse rate, regardless of what's causing the warming. If the warming was caused by a brightening sun or reduced sulphate pollution, you'd still see a hot spot.
There's a figure in the IPCC 4th Assessment report that shows the "temperature signature" expected from the various forcings that drive climate. This figure is frequently misinterpreted. Let's have a close look:
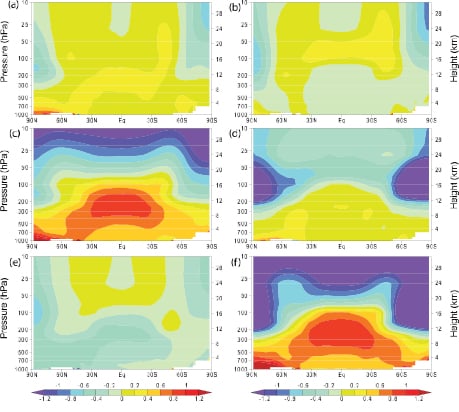
Figure 1: Atmospheric temperature change from 1890 to 1990 from (a) solar forcing, (b) volcanoes, (c) greenhouse gases, (d) ozone, (e) sulfate aerosols and (f) sum of all forcing (IPCC AR4).
The source of the confusion is box c, showing the modelled temperature change from greenhouse gases. Note the strong hot spot. Does this mean the greenhouse effect causes the hot spot? Not directly. Greenhouse gases cause surface warming which changes the lapse rate leading to the hot spot. The reason the hot spot in box c is so strong is because greenhouse warming is so strong compared to the other forcings.
The hot spot is not a unique greenhouse signature and finding the hot spot doesn't prove that humans are causing global warming. Observing the hot spot would tell us we have a good understanding of how the lapse rate changes. As the hot spot is well observed over short timescales (Trenberth & Smith 2006, Santer et al. 2005), this increases our confidence that we're on track. That leaves the question of the long-term trend.
What does the full body of evidence tell us? We have satellite data plus weather balloon measurements of temperature and wind strength. The three satellite records from UAH, RSS and UWA give varied results. UAH show tropospheric trends less than surface warming, RSS are roughly the same and UWA show a hot spot. The difference between the three is how they adjust for effects like decaying satellite orbits. The conclusion from the U.S. Climate Change Science Program (co-authored by UAH's John Christy) is the most likely explanation for the discrepancy between model and satellite observations is measurement uncertainty.
Weather balloon measurements are influenced by effects like the daytime heating of the balloons. When these effects are adjusted for, the weather balloon data is broadly consistent with models (Titchner et al. 2009, Sherwood et al. 2008, Haimberger et al. 2008). Lastly, there is measurements of wind strength from weather balloons. The direct relationship between temperature and wind shear allows us to empirically obtain a temperature profile of the atmosphere. This method finds a hot spot (Allen & Sherwood 2008).
Looking at all this evidence, the conclusion is, well, a little unsatisfying - there is still much uncertainty in the long-term trend. It's hard when the short-term variability is nearly an order of magnitude greater than the long-term trend. Weather balloons and satellites do a good job of measuring short-term changes and indeed find a hot spot over monthly timescales. There is some evidence of a hot spot over timeframes of decades but there's still much work to be done in this department. Conversely, the data isn't conclusive enough to unequivocally say there is no hot spot.
The take-home message is that you first need to understand what's causing the hot spot. "Changes in the lapse rate" is not as sexy or intuitive as a greenhouse signature but that's the physical reality. Once you properly understand the cause, you can put the whole issue in proper context. As the hot spot is due to changes in the lapse rate, we expect to see a short-term hot spot. We do.
What about a long-term hot spot? With short-term observations confirming our understanding of the lapse rate, that leaves spurious long-term biases as the most likely culprit. However, as observations improve, if it turns out the long-term hot spot is not as strong as expected, the main question will be why do we see a short-term hot spot but not a long-term hot spot?
Intermediate rebuttal written by John Cook
Update July 2015:
Here is a related lecture-video from Denial101x - Making Sense of Climate Science Denial
Last updated on 13 November 2016 by pattimer. View Archives


I meant to add the caption for the above figure. 'Temperature trend 1960–2012 versus latitude and pressure. The value for each latitude and pressure is the medians of the trends at individual stations in that (10°) latitude bin. Units are °C per decade'
Message for the mods. Several figures, apparently hosted at tinypic, seem to be no longer available.
VictorVenema @27
Thanks for the heads-up, Victor! I was able to fix a few of the missing graphics two of which were sourced from IPCC-reports where "www." had to be replaced by "archive.", but still have to hunt down two of three tinypic replacements.
In the past, I've pulled out the missing versions from previous versions of the posts from archived copies found on the Wayback Machine on the Internet Archive. Then just upload them to the server and re-link the images.
Hello again. I hope this is a reasonable place to post a potential new myth or misunderstanding related to the upper atmosphere, which I read in a pamphlet by a noted contrarian (brother of a UK politician; a PDF is online and an earlier version found on a Reading University student debating blog). The confusing tract is almost entirely myths already covered on SkS, confusions of carbon stocks and flows, graphs of Antarctic CO₂ lag, faulty logic of causation, a proposal that increases in atmospheric CO₂ are a reaction to the MWP and coming from the oceans, and an incomprehensible suggestion that back radiation doesn't conserve energy. Then it mentions lapse rate and emission layer displacement but that 'this model also says that with more CO₂ the upper atmosphere at a certain level will get warmer ... the hotspot turned out to be a coldspot!'
Now it's not clear how the auithor made that connection; maybe it was the both emission layer displacement and 'hotspot' involve temperature lapse rate. I understand, as explained on the intermediate page here, that the negative lapse rate feedback is due to increased evaporation and latent heat transport from warming oceans, not directly related to CO₂. The pamphlet then ventures three reasons for the alleged inconsistency of model with experiment, never mind that it's actually consistent: these include changes in lapse rate curve (actually the basis of the hotspot), that 'transpiration cooling by plants... increases with CO₂' (the reverse is true, surely?), and then something that I can't verify one way or the other:
So translating into my terminology, the idea is that diurnal temperature range at the top of atmosphere increases with CO₂ and contributes to temperature heterogeneity, total outgoing flux and negative Planck feedback. As GHG concentration increases, the effective top of atmosphere rises to less dense air, correct? (Which means daytime air might lose a similar amount of energy initially, but cool faster but then need mixing from lower layers to continue the same radiative flux to space. Or something.) So could it be a valid interpretation? My reponse would be that any such effect is covered in GCM models, but it would be quite difficult to pull it out and quantify it as a separate effect. It seems it might be a small negative feedback on the first-order effect, but is the logic of the speculation sound? Diurnal temperature variation at the surface will decrease with CO₂: will it decrease or increase or stay the same at height? Thanks for any references or insight.
Cedders @30,
You don't provide a link to the PDF of this pamphlet, assuming it is on-line somewhere. Given the quotes you provide, the pamphlet does appear to be verging on the incoherent, so the actual argument presented may not make a lot of sense and may easily be entirely unfounded.
Indeed, I would guess that any talk of a CO2 IR mechanism is nonsense. Certainly I do not see any mention in the literature (eg Gristey et al (2018) 'Insights into the diurnal cycle of global Earth outgoing radiation using a numerical weather prediction model')
Considering the logic of it, the addition of CO2 to the "real atmosphere" does mean there are more photons flying about in the 15 micron waveband, but because there is more CO2, their 'flightpath' is commensurately shorter as there is more absorbing CO2 as well as more emitting CO2. O2 & N2 simply do not emit/absorb any IR themselves but do transfer energy to/from CO2 through collision which is a temperature thing.
The altitude where IR is shooting off to space will have the same volumetric concentration of CO2 and this altitude will rise upward as CO2 is added. Being thinner (less O2 & N2 but same CO2), it would presumably have a lower specific heat capacity, so for the same IR flux it would cool quicker, but being at a higher/colder altitude it would be shooting off less cooling IR. So I don't imagine a simple process worked out on the back of a denialist's fag packet.
And in the literature I haven't heard of any consideration of the diurnal range up in the upper troposphere beyond cloud formation which suggests if there is some effect, it is all rather obscure.
And as you say, the surface diurnal temperature range reduces with an increasing greenhouse effect. The diurnal range is much smaller through most of the troposphere (see Seidel et al (2005) 'Diurnal cycle of upper-air temperature estimated from radiosondes') but the same principle (of increased insulation reducing nighttime cooling & thus the diurnal range at altitude) presumably still carries.
So without sight of that PDF, this effect would likely be very small if it does exist, and given the rarified atmosphere up there in the upper troposphere, don't hold your breath.
MA Rodger beat me to it. My quick Google search produced the same two papers that he has linked to and discussed.
The term "upper atmosphere" is vague. In the stratosphere, temperature increases with altitude, and increasing CO2 is expected to cause cooling, not warming. . In the upper troposphere, diurnal temperature range is small, and warming due to CO2 is also small.
The Seidel et al paper that MAR references says that upper troposphere diurnal range is <1K.
The Gristey et al paper indicates that factors such as cloud variations, humidity variations, and convective dynamics are dominant.
And I agree that the selected quote is largely incoherent. As for the author being related to a UK politician - that points to some obvious candidates with long records of obfuscation and poor science.
Thanks to you both for trawling through this. I was wary that linking to the document might boost its search engine ranking, but here it is via archive.org (16 of the 24 pages in the printed version). It doesn't have the professional gloss of a Heartland publication, but any documentation with one or two specious arguments helps some members of the public justify their preferred position.
Both papers look useful in understanding important features of atmospheric physics before thinking about how greenhouse forcings affect them. I'm not sure why search engines didn't find them for me; or maybe I was looking specifically for greenhouse effects. I find Seidel et al the easier of the two to read and providing the simplest rebuttal: there really isn't much diurnal temperature variation to influence OLR in any case. Gristey et al confirms 'diurnal temperature range becomes negligible at around 100 m altitude' (above surface), suggesting it's surface temperature that is most important in their Sahara example, followed by clouds and convection.
Gristey et al also suggests to me that the effect of increases in LLGHGs and specific humidity will reduce transmittance, so also reducing OLR coupling to surface 'hotspots' and further reducing what small diurnal range there is at, say, the tropopause. I am a bit confused why the OLR varies proportionately more over the day than the temperature at 500 hPa (Seidel fig 3), but suppose the atmospheric window (IR emitted from the surface that never interacts with atmosphere) is important.
On the logic of rising emission layers: 'Being thinner (less O2 & N2 but same CO2), it would presumably have a lower specific heat capacity, so for the same IR flux it would cool quicker,' - well put, that is where I thought there might be some merit in the new argument - 'but being at a higher/colder altitude it would be shooting off less cooling IR.' I wasn't convinced by that caveat, because shouldn't the OLR/cooling IR at the TOA remain what you expect at 255 K? So 'upper atmosphere adjusting quicker' might have a grain of truth in it, but adjusting to what (space mostly?), and doesn't it imply regressing to diurnal mean more quickly? In any case, there's no empirical support for increased diurnal range.
'And in the literature I haven't heard of any consideration of the diurnal range up in the upper troposphere beyond cloud formation which suggests if there is some effect, it is all rather obscure.'
Very obscure, but that doesn't mean it doesn't serve the contrarian's purpose. I probably would never have thought about the 'hotspot' itself, not being prone to expeditions in high-altitude balloons or worried about that part of the atmosphere, were it not for various contrarians using the very lack of empirical data to argue for a flaw in established theory. These arguments are about fine details, emphasising them as if they were important, to distract from a central point that someone wants to avoid.
Cedders @33,
On boosting search rankings, the promotion from page 1,000 up to page 900 because a URL is used a single timesomewhere on the inerweb in my view is not very significant. If you want to give your webpage a proper boost, you'd use other means. But saying that, I do get criticised occasionally for using denialist URLs and thus boosting their rankings (and I am no expert in the matter). You can apparently make such a use without any boost whatever using the 'nofollow' extention in the HTML of a URL (but I'm not sure how you'd use that in the SkS URL inserter).
On the URL content, I haven't looked down that URL yet. And it is useful to take the whole argument thus presented (so I 'look forward' to all 24 pages of it) as one approach to dismissing a difficult bit of debunking is to point to all the obvious nonsense argued alongside the difficult debunking. This is of course an ad homenem logical argument but without the difficulty being resolved (one way or the other) it is not in any way a logical fallacy.
On atmospheric cooling from CO2, the equilibrium in the energy balance will be restored following a CO2 forcing. This would result in the troposphere warming by +1ºC per 2xCO2 increase (without feedbacks) which will act over the whole blackbody emissions spectrum of 7.5 to 100 microns, this balancing the +3.7Wm^-2 forcing from the CO2.
When it comes to the CO2 forcing itself, CO2 emissions only acts over a small part of the global emissions spectrum. See fig 5b3 of that useful paper Zhong & Haig (2013) 'The greenhouse effect and carbon dioxide' which shows the spectrum of a CO2 increase 389ppm to 878ppm (2xCO2 from 2013) and how the central micron of the emissions are already past the tropopause and thus cooling the planet rather than warming it. Thus the 3.7Wm^-2 CO2 forcing comes from a rather narrow part of the spectrum 13¼ micron to 16¾ micron (less that central 14½ to 15½ now operating to cool the planet). To make this narrow band have such a big effect, it has to result from a cooling of the emissions altitude, a cooling far bigger than the average that would be required over the full blackbody spectrum. So that emissions altitude increases on average enough to perhaps give you 10ºC drop in temperature.
Do note that the CO2 emissions will be reaching space from vastly different altitudes. The central part of the emissions are up in the stratosphere while the edges of the emissions will be low down in the troposphere. The bits inbetween the edge and the centre will thus stretch all the way up. So this effect will apply to the whole troposphere.
So the emissions altitudes post forcing will rise and thus become cooler by a far bigger amount than the compensating warming of the troposphere to reach post-forcing equilibrium. And that cooling will drop the emissions into space. So any diural temperature variation due to loss of daytime solar warming will be less due to this cooling/drop of IR emissions.
On the significance of this cooling. Meanwhile, because the emissions altitude is higher, there will be a drop in the pressure of the emissions altitude although only for the O2 & N2. The extra CO2 will presumably mean CO2 will be effectively constant. And this drop in pressure will mean a drop in the air's Specific Heat Capacity. (The temperature effect on SHC will be pretty flat.) And this drop in SHC will mean that for a constant loss of energy through the night, any diurnal cooling will be larger. This then operates in the opposite direction to the reduction in IR caused by the cooler emissions altitudes which will lower the energy loss and thus reduce the diurnal range.
And so the question is which effect is the larger? Indeed, are they of a significantly similar size? And given that, is the effect significant for the diurnal temperature range?
Given the proposal comes from this denialist URL, that is perhaps the first place to look for answers. So I will be looking at those 24 pages (although prior to that my own very cursory work on the first two of those questions suggests the pressure/SHC is the larger effect with a ration of 3:1).
I hope all that makes sense.
Cedders @33,
And having had a read of that PDF...
Cedders @33,
Having examined the PDF (16 pages not 24), it is quite evident that it is a pile of utter nonsense, a "welcome to the lunatic asylum" message and not anything in any way scientifically-based.
The author is Piers Corbyn, a well-kown denialist and an elder brother of Jeremy Corbyn (a long-serving left-wing Labour MP who bizarrely gained the heady position of Leader of the Labour Party for 4½ years).
Piers Corbyn is described in Wikithing as "an English weather forecaster, businessman, anti-vaxxer and conspiracy theorist" and does feature here at SkS being (1) Cited within a spot of denialism of 2015 in the Daily Express tabloid/comic, (2) The main source of a pile of climate nonsense of 2013 from the then Mayor of London Alexander Boris von Pfiffle Johnson, a man now renowned throughout the known world for not being particularly truthful, (3) Listed here at SkS as a denialsit with zero peer-reviewed writings.
The 16 page thesis linked up-thread @33 is a 2019 thesis presented to the Reading University Debating Journal and sitting at the top of a list of 24 such theses posted 2018-19, top of the list because it is the most recent (the journal lasted less than a year), a list which addresses such important topics as 'Why Self-Service Checkouts are the Invention of the Devil' and 'The Great University of Reading Catering Con: Man Shall Not Live off Sandwiches Alone' and an anonymous piece 'Why I Support the Conservatives: The Most Successful Party in British History'.
The Piers Corbyn thesis begins by citing David Legates' dismissal of the 97% AGW consensus before dismissing that because "it is about facts; and no Global-Warming Inquisition is going to prevent me exposing their nonsensical theories."
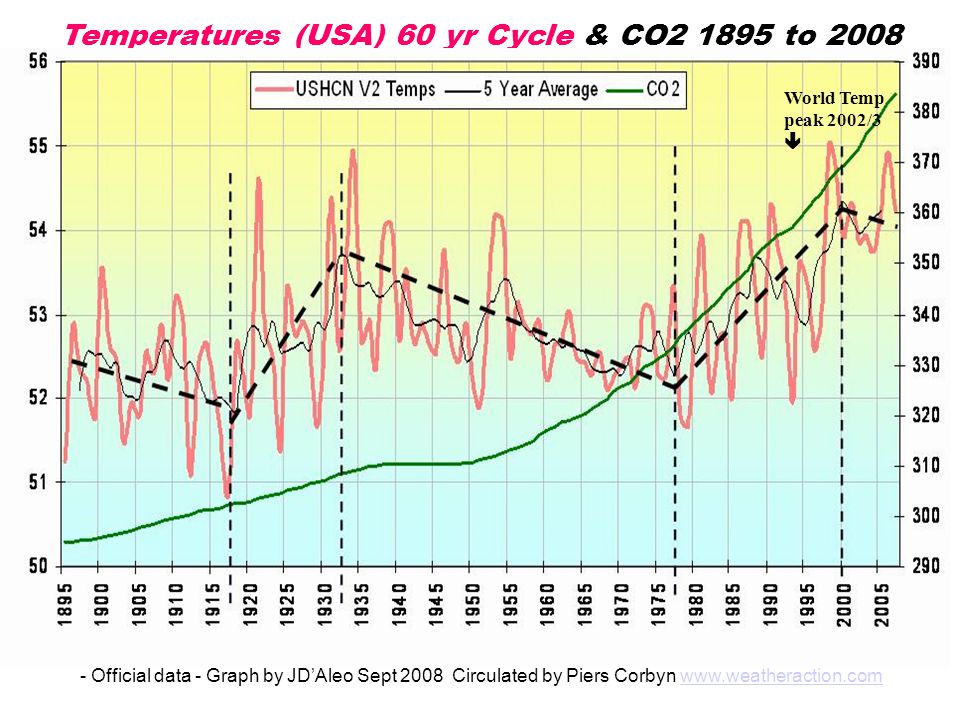
Corbyn then kicks off by asserting anthropogenic CO2 comprises 4% of atmospheric CO2 (thus confusing FF carbon with naturally-cycled carbon) and that CO2 is not the main controller of global temperature (here presenting a graphic which confuses the US temperature with global temperature - shown below in this comment).
A further assertion is then presented, that CO2 is the result of warming oceans with six references/notes provided in support which seem to all point back to crazy denialist Murry Salby.
So, a la Salby, the present rise in CO2 is claimed to result from the good old Medieval Warm Period. A graphic is presented comparing a denialist 1,000y temperature record (based on the schematic FAR Fig 7c) with the much-confirmed scientifically-based Hockey Stick graph.
This brings us to the halfway page of Corbyn's denialist rant.
The thesis continues with pageful of misunderstanding of how the GH-effect works, ending with accusations that this misunderstood 'theory' breaks the 2nd Law of Thermodynamics (or it does if you misinterpret the 2nd Law of Thermodynamics).
Happily, this misunderstanding is considered to be not supported by "better scientists" who consider the lapse rate. And this indeed is a 'better' consideration. But here Corbyn perhaps confuses the tropical 'hot spot' (which is caused by increased tropical rainfall transporting more latent up into the troposphere) with some CO2 effect. (The 'hot spot' results from a warmer tropics and not per se any enhanced GH-effect.) And he fails to address the reasons why there is difficulty detecting this tropical 'hot spot'. Indeed he brands it as a 'coldspot' that he seems to say is caused by "more CO2 & other GHGs" which cause a diurnal fluctuation in the IR "heat-exit height" to become greater and, due to the 4th-power in the SB equation, this causes cooling. Whether such a phenomenon extends beyond the tropics (thus globally more-than negating the 'hot spot') is not properly explained but, due to the lapse rate this phenomenon can apparently also negate "the original expected surface warming."
A first graphic box is presented with three unsubstantiated bullet points explaining "Why CO2 theory does not work" alongside two similar "apart from"s.
A second graphic box also titled "Why CO2 theory does not work" states:-
This is a fundamentally different explanation from the previous fluctuation in IR "heat-exit height" explanation described earlier, and it is still wrong.
(A packet of air with X concentrations of CO2 will both emit and absorb an IR photons of quantity P. With absorb=emit, it is thus in equilibrium. Add CO2 so the concentration is doubled to 2X, and the emitting photons will double to 2P and the absorbed photons will also double to 2P so absorb=emit and the same equilibrium is maintained. The main result is that twice the level if IR emission has half the pathlength before absorption so at any point the IR flux remains unchanged. And CO2 does not "gain & lose heat easier than N₂ & O₂" when it remains thermally coupled to the N₂ & O₂. )
The remainder of this second graphic box on PDF page 9 is a little too confused to rebut with any confidence. A diurnal range of "about 5 or 6 deg" is given which is apparently a temperature range yet whatever “deg” means (presumably Kelvin), the bulk of the troposphere has a far smaller diurnal range than even 5ºF. The mechanism for the enhanced cooling from the "heat-exit height" is presented as due to a fluctuating temperature losing more heat (by radiating IR) than a constant temperature (which is true). A rather dodgy-looking equation is followed by the note "Detail subject under research" but no reference is given and three-years-on there is no sign of such "research."
And a third graphic box is shown on the next page also titled "Why CO2 theory does not work," this third such graphic mainly presenting a pair of images from Australian denialist David M. W. Evans who has his own SkS page of climate misinformation.
The thesis then turns to the proposition that it is not CO2 but solar forces that "rules climate temperature" with the dotted line on the graphic below described as such a ruling influence. It apparently shows how the "9.3yr lunar-nodal crossing & the full 22yr solar magnetic cycle" allegedly shift the jet stream and "many circulation patterns." The graphic's 60-yr periodicity is less than convincing,being fitted to US rather than global temperature which, when extended beyond the 1895-2008 period shows itself to be simple curve-fitting (eg the Berkeley Earth US temperature record 1820-2020 does not show it, even to a blind man). The graphic was presented by Corbyn at the Heartland Institute's 2009 conflab in NY in which Corbyn [audio] insists other findings demonstrate “something is going on” but why it is this graphic being reused in this 2019 thesis is not clear – perhaps the forecast of world temperature dropping to 1970s levels by 2030 is too evident on other slides he used in that Heartland presentation.
To support his thesis Corbyn mentions an alleged cover-up by the likes of the BBC in reporting only global warming when the 'true' data shows cooling, the reported support for all this Piers Corbyn craziness from oil companies who shy away only because they want to use AGW to "make higher profits" and how these AGW-inspired mitigation agendas are already directly responsible for needlessly killing "millions" annually.
The thesis ends with a challenge:-
So I interpret the thesis as a "welcome to the lunatic asylum" message from Piers Corbyn.
MA Rodger @35 , many thanks for your self-sacrifice in undertaking a summarization of the Piers Corbyn effusions at that Reading Uni. site.
Hardened as I am by years of scanning through the denialist blogsite WUWT , nevertheless Corbyn gave me a leaden feeling after even a few paragraphs of his stuff. Further skimming did not give indications of any likely intellectual benefit ~ unlike with WUWT , where sometimes a spoonful of wheat can be found amongst the chaff.
Another denialist blogsite, Dr Judith Curry's ClimateEtc , can be crossed off the list of interesting denialist websites. It had always been a more genteel version of WUWT , in lacking WUWT's vitriol ~ but in recent months it has developed a dreariness, owing to the gradual disappearance of that small band of sane commenters who are capable of lifting the average. A month or so ago, there were a few comments by "Dikran Marsupial" (a worthy scientific commenter at SkS in earlier years) . . . but that has been the only point of light in the recent darkness.