


 Arguments


How reliable are climate models?
What the science says...
| Select a level... |
 Basic
Basic
|
 Intermediate
| |||
|
Models successfully reproduce temperatures since 1900 globally, by land, in the air and the ocean. |
|||||
Models are unreliable
"[Models] are full of fudge factors that are fitted to the existing climate, so the models more or less agree with the observed data. But there is no reason to believe that the same fudge factors would give the right behaviour in a world with different chemistry, for example in a world with increased CO2 in the atmosphere." (Freeman Dyson)
At a glance
So, what are computer models? Computer modelling is the simulation and study of complex physical systems using mathematics and computer science. Models can be used to explore the effects of changes to any or all of the system components. Such techniques have a wide range of applications. For example, engineering makes a lot of use of computer models, from aircraft design to dam construction and everything in between. Many aspects of our modern lives depend, one way and another, on computer modelling. If you don't trust computer models but like flying, you might want to think about that.
Computer models can be as simple or as complicated as required. It depends on what part of a system you're looking at and its complexity. A simple model might consist of a few equations on a spreadsheet. Complex models, on the other hand, can run to millions of lines of code. Designing them involves intensive collaboration between multiple specialist scientists, mathematicians and top-end coders working as a team.
Modelling of the planet's climate system dates back to the late 1960s. Climate modelling involves incorporating all the equations that describe the interactions between all the components of our climate system. Climate modelling is especially maths-heavy, requiring phenomenal computer power to run vast numbers of equations at the same time.
Climate models are designed to estimate trends rather than events. For example, a fairly simple climate model can readily tell you it will be colder in winter. However, it can’t tell you what the temperature will be on a specific day – that’s weather forecasting. Weather forecast-models rarely extend to even a fortnight ahead. Big difference. Climate trends deal with things such as temperature or sea-level changes, over multiple decades. Trends are important because they eliminate or 'smooth out' single events that may be extreme but uncommon. In other words, trends tell you which way the system's heading.
All climate models must be tested to find out if they work before they are deployed. That can be done by using the past. We know what happened back then either because we made observations or since evidence is preserved in the geological record. If a model can correctly simulate trends from a starting point somewhere in the past through to the present day, it has passed that test. We can therefore expect it to simulate what might happen in the future. And that's exactly what has happened. From early on, climate models predicted future global warming. Multiple lines of hard physical evidence now confirm the prediction was correct.
Finally, all models, weather or climate, have uncertainties associated with them. This doesn't mean scientists don't know anything - far from it. If you work in science, uncertainty is an everyday word and is to be expected. Sources of uncertainty can be identified, isolated and worked upon. As a consequence, a model's performance improves. In this way, science is a self-correcting process over time. This is quite different from climate science denial, whose practitioners speak confidently and with certainty about something they do not work on day in and day out. They don't need to fully understand the topic, since spreading confusion and doubt is their task.
Climate models are not perfect. Nothing is. But they are phenomenally useful.
Please use this form to provide feedback about this new "At a glance" section. Read a more technical version below or dig deeper via the tabs above!
Further details
Climate models are mathematical representations of the interactions between the atmosphere, oceans, land surface, ice – and the sun. This is clearly a very complex task, so models are built to estimate trends rather than events. For example, a climate model can tell you it will be cold in winter, but it can’t tell you what the temperature will be on a specific day – that’s weather forecasting. Climate trends are weather, averaged out over time - usually 30 years. Trends are important because they eliminate - or "smooth out" - single events that may be extreme, but quite rare.
Climate models have to be tested to find out if they work. We can’t wait for 30 years to see if a model is any good or not; models are tested against the past, against what we know happened. If a model can correctly predict trends from a starting point somewhere in the past, we could expect it to predict with reasonable certainty what might happen in the future.
So all models are first tested in a process called Hindcasting. The models used to predict future global warming can accurately map past climate changes. If they get the past right, there is no reason to think their predictions would be wrong. Testing models against the existing instrumental record suggested CO2 must cause global warming, because the models could not simulate what had already happened unless the extra CO2 was added to the model. All other known forcings are adequate in explaining temperature variations prior to the rise in temperature over the last thirty years, while none of them are capable of explaining the rise in the past thirty years. CO2 does explain that rise, and explains it completely without any need for additional, as yet unknown forcings.
Where models have been running for sufficient time, they have also been shown to make accurate predictions. For example, the eruption of Mt. Pinatubo allowed modellers to test the accuracy of models by feeding in the data about the eruption. The models successfully predicted the climatic response after the eruption. Models also correctly predicted other effects subsequently confirmed by observation, including greater warming in the Arctic and over land, greater warming at night, and stratospheric cooling.
The climate models, far from being melodramatic, may be conservative in the predictions they produce. Sea level rise is a good example (fig. 1).

Fig. 1: Observed sea level rise since 1970 from tide gauge data (red) and satellite measurements (blue) compared to model projections for 1990-2010 from the IPCC Third Assessment Report (grey band). (Source: The Copenhagen Diagnosis, 2009)
Here, the models have understated the problem. In reality, observed sea level is tracking at the upper range of the model projections. There are other examples of models being too conservative, rather than alarmist as some portray them. All models have limits - uncertainties - for they are modelling complex systems. However, all models improve over time, and with increasing sources of real-world information such as satellites, the output of climate models can be constantly refined to increase their power and usefulness.
Climate models have already predicted many of the phenomena for which we now have empirical evidence. A 2019 study led by Zeke Hausfather (Hausfather et al. 2019) evaluated 17 global surface temperature projections from climate models in studies published between 1970 and 2007. The authors found "14 out of the 17 model projections indistinguishable from what actually occurred."
Talking of empirical evidence, you may be surprised to know that huge fossil fuels corporation Exxon's own scientists knew all about climate change, all along. A recent study of their own modelling (Supran et al. 2023 - open access) found it to be just as skillful as that developed within academia (fig. 2). We had a blog-post about this important study around the time of its publication. However, the way the corporate world's PR machine subsequently handled this information left a great deal to be desired, to put it mildly. The paper's damning final paragraph is worthy of part-quotation:
"Here, it has enabled us to conclude with precision that, decades ago, ExxonMobil understood as much about climate change as did academic and government scientists. Our analysis shows that, in private and academic circles since the late 1970s and early 1980s, ExxonMobil scientists:
(i) accurately projected and skillfully modelled global warming due to fossil fuel burning;
(ii) correctly dismissed the possibility of a coming ice age;
(iii) accurately predicted when human-caused global warming would first be detected;
(iv) reasonably estimated how much CO2 would lead to dangerous warming.
Yet, whereas academic and government scientists worked to communicate what they knew to the public, ExxonMobil worked to deny it."
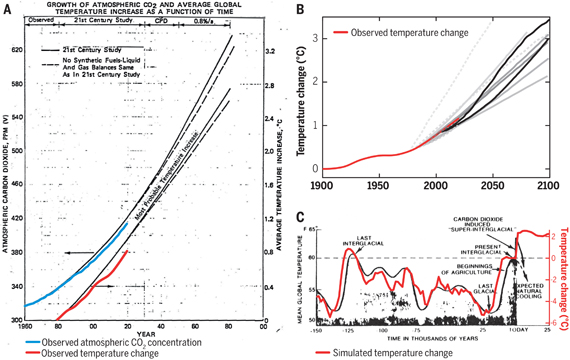
Fig. 2: Historically observed temperature change (red) and atmospheric carbon dioxide concentration (blue) over time, compared against global warming projections reported by ExxonMobil scientists. (A) “Proprietary” 1982 Exxon-modeled projections. (B) Summary of projections in seven internal company memos and five peer-reviewed publications between 1977 and 2003 (gray lines). (C) A 1977 internally reported graph of the global warming “effect of CO2 on an interglacial scale.” (A) and (B) display averaged historical temperature observations, whereas the historical temperature record in (C) is a smoothed Earth system model simulation of the last 150,000 years. From Supran et al. 2023.
Updated 30th May 2024 to include Supran et al extract.
Various global temperature projections by mainstream climate scientists and models, and by climate contrarians, compared to observations by NASA GISS. Created by Dana Nuccitelli.
Last updated on 30 May 2024 by John Mason. View Archives


Climate Myth...