


 Arguments


Greenhouse warming 100 times greater than waste heat
What the science says...
| Select a level... |
 Basic
Basic
|
 Intermediate
| |||
|
Greenhouse warming is adding 100 times more heat to the climate than waste heat. |
|||||
Climate Myth...
It's waste heat
"Global warming is mostly due to heat production by human industry since the 1800s, from nuclear power and fossil fuels, better termed hydrocarbons, – coal, oil, natural gas. Greenhouse gases such as carbon dioxide (CO2 play a minor role even though they are widely claimed the cause." (Morton Skorodin)
At a glance
There are various kinds of climate science deniers out there, but one grouping can usefully be classified under the acronym ABCD - Anything But Carbon Dioxide. These people appear to accept the climate is heating up. Flailing around to try and identify something other than CO2 causing the heating, they will seize upon all sorts of candidate causes. This is one of them. There are many others.
All the energy we use dissipates into the environment post-use, be it a driftwood fire on the beach or the heart of a busy metropolis, on the go 24-7. So it should come as no surprise that 'waste' heat does have a role - a minor one - in heating the planet. Humans have always been fond of fire since they learned to ignite things and there's nothing better than sitting round a blaze of a night with a few friends. No need to feel guilty about that. It's harmless in the overall scheme of things.
Waste heat is of course a much studied subject. After all, more sophisticated heating systems, compared to that fire on the beach, are energy-intensive and that translates as expensive. Ways to minimise heat loss and thereby improve efficiency form an active research topic. In that sense, a number of studies have looked at the bigger picture: just how much waste heat is there?
Unsurprisingly, cities, where huge numbers of people work, rest and play, are megacentres of heat wastage. The term, 'Urban Heat Island', acknowledges this. But the planet is a big old place and cities occupy relatively small parts of it. To find the warming contribution of waste heat, you need to have two figures: the total energy lost and the surface area of the planet. Doing the maths you can then derive the amount, expressed in watts per square metre. You can then compare it to other heat sources.
All studies of waste heat have arrived at a similar conclusion. There's a lot of waste heat over cities but the total, global amount, expressed as watts per square metre of the planetary surface, is a tiny fraction of the heating caused by the greenhouse gases. So while it's highly desirable to find better efficiencies in energy use and conservation, thereby saving money, when it comes to temperature it's greenhouse gas emissions we have to hold firmly in our focus. ABCD indeed. Next.
Please use this form to provide feedback about this new "At a glance" section. Read a more technical version below or dig deeper via the tabs above!
Further details
Heat is released to the atmosphere as a result of human activities, many of which involve combustion of fuels, directly or indirectly. Sources of this 'anthropogenic heat' include industrial plants, heating of buildings, air-conditioning, vehicle exhausts and many more. In cities, anthropogenic heat typically contributes 15–50 W/m2 to the local heat balance, and several hundred W/m2 can be reached in the centres of large cities in colder climates.
This heat doesn't just disappear - it dissipates into our environment. How much does waste heat contribute to global warming? There have been several studies over the years, widely-cited examples being Flanner (2009) (if you want to read the full paper, access details are posted here), Dong et al. (2017) and Varquez et al. (2021). All have come up with similar numbers despite differences in methodology: the core message is that while waste heat is an issue and is self-evidently undesirable, its contribution to global warming is a tiny fraction of that brought about by CO2.
Flanner concluded that the contribution of waste heat to the global climate was 0.028 W/m2. That was with respect to the mid 2000s. In contrast, the contribution from human-emitted greenhouse gases at the time was 2.9 W/m2 (fig. 1). So in the mid 2000s, waste heat amounted to about 1% of the total warming, with greenhouse gases making up much of the rest. The above numbers refer to radiative forcing, the change in energy flux at the top of the atmosphere. Or putting it in plain English, the amount of heat being added to our climate.
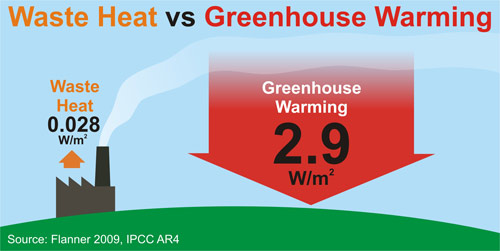
Fig. 1: the relative radiative forcings due to waste heat and CO2 in the mid 2000s, from the numbers presented by Flanner (2009).
Since that time, both greenhouse gases and energy use have gone up (fig. 2), so it should come as no surprise to see increases in radiative forcing in both cases. Future projections have largely been focussed on recovery of the waste heat, such as that by Firth et al. (2019). An important conclusion of theirs is that, "full recovery of the theoretical potential is found to lead to a 10–12% reduction in the combined forcing of CO2 and waste heat over this period, mainly due to a reduction in CO2 emissions."
An important point to consider here is that the warming from thermal energy production occurs when a fossil fuel undergoes combustion. Whoomph! and that's that - the energy is produced in a single pulse then dissipates away. In contrast, warming from the emitted CO2 continues for the lifetime of CO2 in the atmosphere - potentially thousands of years (Zhang & Caldeira 2015). Zhang and Caldeira showed that "the energy released from the combustion of fossil fuels is now about 1.71% of the radiative forcing from CO2 that has accumulated in the atmosphere as a consequence of historical fossil fuel combustion." Again a small fraction of the CO2 radiative forcing, and emphasising the issue of the cumulative build-up of CO2 due to its relatively long atmospheric residence time.
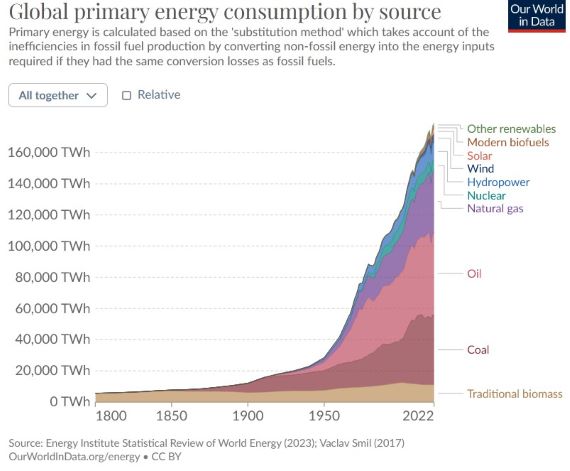
Fig. 2: total energy use on Earth, 1800-2023.
To conclude, greenhouse warming is currently adding some 60-100 times more heat to our climate than waste heat. That's not to say we should not be bothered about waste heat though, There are many sound reasons, including economic, for reducing heat wastage. It makes no sense at all to tolerate systems that for various reasons are grossly inefficient. But that needs to be considered as a separate entity from the huge problem of human CO2 emissions.
Last updated on 7 January 2024 by John Mason. View Archives


Bob Loblaw @200,
The craziness engendered in this thesis set out in both Bian (2019) 'The Nature of Climate Change-equivalent Climate Change Model’s Application in Decoding the Root Cause of Global Warming' and Bian (2020) 'Waste heat: the dominating root cause of current global warming' is profound. Other than having access to more recent data, the second account sets out nothing new that I can see, and there is little point in spending much time examining such madness.
I note the citations made by the second account (which are quite sparce) include two to SkS webpages, this one and 'What does past climate change tell us about global warming?'.
So from this SkS webpage the author does appreciate that the global primary energy use amounts to just 1% of the positive forcings from AGW. Indeed, this disparity he considered too small as, in the universe inhabited by Qinghan Bian the energy employed in "useful work" is somehow swept from the planetary climate system and will not contribute to a planetary energy imbalance. Given the "perspective of thermodynamics" invoked at this point in the narrative, the blundersome efforts of Qinghan Bian seem to know no bounds.
You point to the climate being modelled as having a pond-depth of ocean and a similar height of atmosphere. Adopting such nonsense allows temperature increases to be equated to global Primary Energy Use (bar the 20% that magically disappears in "useful work").
The earlier account gives annual values for the energy employed heating the various components of the planet. Thus in 2017 there is 1,500Kj x 10^14 warming the ocean surface layer. The OHC measurements give the 0-2,000m warming for 2017 as a little low relative to earlier years, averaging out at 7.8Zj annual. So in Bian-money, that is 78,000Kj x 10^14.
Some may consider this comparison a little unfair given ΔOHC is usually seen as being perhaps 80% of the heating resulting from AGW. This would put the total planetary on-going warming at some 100,000Kj x 10^14 which would compate with the 4,000Kj x 10^14 of Bian but only if the global temperature rise so far is ignored. The +1ºC extra planetary temperature which requires maintaining. If this AGW-delivered-so-far is also factored in, the extra energy flux out into space would be balancing 3.7Wm^-2 of forcing/feedback (and presumably with a ration of perhaps 1:2) giving a figure for the global forcing (20Zj balanced forcing+ 10Zj imbalanced forcing still heating) at 300,000Kj x 10^14. So very roughly the 1% value of [Primary Energy Use]/[AGW] appears again.
MA Rodger:
You dug further than I had the time to do. I did look at the web page for the 2019 article, and I saw that is has information on the review. I did not take the time to examine the article or the reviews, but it may be entertaining to do so.
I did look at the editorial board for Environmental Systems Research and did not see a single name I recognized, so it's hard to know what their background is.
The International Journal of Environment and Climate Change is also an unkown entity. Searching Beall's List of Predatory Journals there are 690 hits for "International Journal of" and 4 hits for "International Journal of Environment", but "International Journal of Environment and Climate Change" is not on it. BIan's article from 2019 is listed as being in volume 9, and the journal seems to go back to 2011. The publisher (Science Domain International) is on Beall's list, though.
https://beallslist.net/
https://beallslist.net/standalone-journals/
Bob Loblaw @202,
There is, of course, the old SkS favourite when debunking nonsense like this - the identification of curve fitting. The grand modelling exercise carried out by Bian runs 1965-2018 and shows a pretty constant increase in FF+nuclear Primary Energy and also in surface temperature.
Look more closely and, of course are we are familiar with this, the surface temperature was flat for the first few years of this period and indeed was effectively flat 1940-1970. But FF+Nuclear Primary Energy was rising at a costant rate from 1950 with a far slower rise prior to that. So pre-1965 Bian's curve-fitting would be looking a lot less than a good fit.
Yes. Another give-away is the use of the term "equivalent climate change..." in front of each "boundary layer" term in the text I quoted.
Equivalent to what?
Equivalent to Finnegan's Finnagling Factor, or Cook's Constant, or less formally, the Fudge Factor - the ratio between what he really got and what he wanted to get.
"If I put these totally unrealstic coefficients into my model and label them like something real, I can fit global temperatures."
Tamino's blog is full of take-downs of this sort of curve-fitting.
Of course, we true curve fitters know that the real explanation is Pirates.
Please note: a new basic version of this rebuttal was published on January 6, 2024 and now includes an "at a glance“ section at the top. To learn more about these updates and how you can help with evaluating their effectiveness, please check out the accompanying blog post @ https://sks.to/at-a-glance