


 Arguments


Climate choice: stable or disrupted climate
What the science says...
Continued greenhouse gas emissions at or above current rates would cause further warming and induce many changes in the global climate system during the 21st century that would very likely be larger than those observed during the 20th century. (source: IPCC 2007)
Climate Myth...
CO2 limits won't cool the planet
"[CO2 limits] will not make a difference for 1000 years. So this is a government which is proposing to put at risk our manufacturing industry, to penalise struggling families, to make a tough situation worse for millions of households right around Australia. And for what? To make not a scrap of difference to the environment any time in the next 1000 years." (Tony Abbott)
Skeptics have argued that if reductions in CO2 will not cool the planet for hundreds of years, then it is not prudent to cut emissions and put any burden on a fossil-fuel-driven economy. But does this make sense?
A choice between sustained temperature increase and doing nothing is not, unfortunately, the choice we are facing. The real choice we face is between decreasing CO2 emissions (in which case temperatures will still warm a bit more and then stabilize), and letting CO2 emissions go and and on (in which case temperatures will continue to rise and rise). In the future, when technologically and economically feasible, it may be possible to withdraw carbon from the atmosphere, perhaps with increasing tree growth or chemical "scrubbing". But this is just a goal for the future.
According the IPCC, from the Summary for Policy Makers:
- Continued greenhouse gas emissions at or above current rates would cause further warming and induce many changes in the global climate system during the 21st century that would very likely be larger than those observed during the 20th century.
- Anthropogenic warming and sea level rise would continue for centuries due to the time scales associated with climate processes and feedbacks, even if greenhouse gas concentrations were to be stabilised.
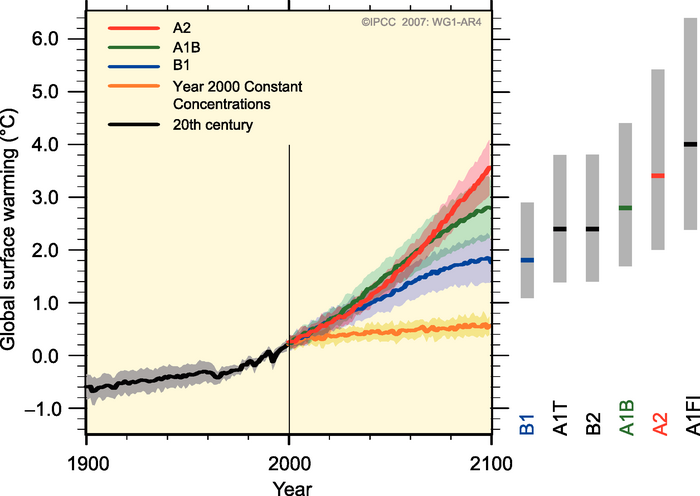
Figure: Global surface temperature projections for IPCC Scenarios. Shading denotes the ±1 standard deviation range of individual model annual averages. The orange line is constant CO2 concentrations at year 2000 values. The grey bars at right indicate the best estimate (solid line within each bar) and the likely range. (Source: IPCC). Emissions scenarios
This is one skeptic argument where one must wonder if some of those who wish to prevent action on climate change really understand what the argument is about.
Basic rebuttal written by grypo
Update July 2015:
Here is a related lecture-video from Denial101x - Making Sense of Climate Science Denial
Last updated on 19 July 2015 by MichaelK. View Archives


Of course CO2 limits won't cool the planet. You even admit that yourself. The problem however is stated in the form of a false dichotomy. Mitigation in order to work needs every little bit from every possible technology available. The largest of course, by many orders of magnitude, is the soil sink potential. Next comes alternative energy and then conservation. Tree growth and chemical scrubbing are barely a blip on the screen. Not saying we shouldn't try them too, but the net effects are minimal. Soil on the other hand is depleted of carbon, more carbon than is in excess in the air. The technologies to get that carbon back in the soil are very well established agricultural science methodologies and already beginning to be practised in the field by ordinary farmers and ranchers. We just have get serious and do it.
https://www.youtube.com/watch?v=9yPjoh9YJMk
I know that's just a Youtube vid, but that speaker is one of several USDA NRCS case studies.
Somehow my previous comment was lost. Aaron Davis is suggesting that our current understanding would be that CO2 is responsible for all, or even most, of Earth' atmosphere IR backradiation. That is a whopper of a straw man, truly in the laughable category. The fact that water vapor is responsible for the majority of it has been well known from early on in the study of atmospheric physics. See all the Iacono and Clough works. Water vapor is readily precipitable and can not force changes in energy budget on its own; the water vapor content is a direct function of temperature, not the other way around. In contrast, CO2 stays for a very long time, that is why it is known as the biggest control knob. If Aaron thinks he's got a better handle on atmospheric radiative physics than the makers of MODTRAN and HITRAN (now showing 320 molecular species), he should go hack it in the litterature.
Perhaps the reluctance of the current administration to engage in the red team/blue team BS was spurred by the perspective of having some clueless think tank ideologue throwing around calculations like the ones above and thinking they've got everybody foiled while the poor scientists caught in their "team" will shake their heads in despair...
While this post does not fit into the Taxonomy of Arguments I hope it will help.
Facts:
Conclusion:
What will be effective? Enhanced Nighttime Radiant Cooling.
This figure shows Radiant Flux vs temperature for various relative humidity. A 50 W m-2 improvement can be achieved by increasing the temperature difference during polar winter and decreasing RH at lower latitudes by weather modification.
[img]https://i.imgur.com/O7G1EJo.png[/img]
https://imgur.com/O7G1EJo
Philippe Chantreau "Water vapor is readily precipitable and can not force changes in energy budget on its own; the water vapor content is a direct function of temperature, not the other way around."
I've heard this argument before but can't understand it's relavance. The Modified Swinbank model adequately predicts the drop in overnight temperature of water on a circular aluminum disk without the need for ozone or CO2 contributions. I believe Hitran and Motran are descriptive models, not predictive. They maybe are helpful in Navier Stokes storm track predictions, but are not appropriate in predicting nighttime radiant cooling. The reference for Nighttime Radiant Cooling comes from an astronomy tutorial: http://www.asterism.org/tutorials/tut37%20Radiative%20Cooling.pdf which has been demonstrated (not just modeled, or inspected but actually verified in archetectural applications. True, the application here to climate-engineering is my humble contribution. But, I think you should be embarressed to tag it as "laughable". Shame on you.
"In contrast, CO2 stays for a very long time, that is why it is known as the biggest control knob". I've also heard this argument before. Even at 40x the concentration CO2's persistence in the Martian atmosphere does not appear to be a very big knob. Why would you think it would be a big knob on Earth? I think you might be misquoting someone else.
Now on Venus which has 4000x the CO2 concentration as earth. But, it's its thick hydrogen sulfide reflective layer that probably runs the temperature up to 460 oF. Kind of suggest we don't use sulfur to do Solar Radiation Management, eh?
CO2 emmissions is at best a proxy for quantifying heat loading from fossil fuel use, which I agree is what causes increase in water vapor which is what clogs up the earths natural nighttime radiant cooling mechanism. CO2 itself is not a significant factor.
I also noticed my comment was missing. It would really be sad if failure to rebut means you get blocked.
Mods; I'm having problems losing comments when using the link insert function, hence the non embedded links at the end.
Aaron: Your Mars/Earth trick ignores the facts that Mars does have some GH effect that raises its average temp by approximately 5 deg K compared to no GH effect at all. Mars remains cold because of the very low atmospheric mass, the lack of other GH gases in sufficient quantity, the low solar irradiance and low outgoing IR radiation to be captured. You did not mention any of these facts, and your little mars/Earth comparison is irrelevant to the point of being misleading. The shame is on you for that.
MODTRAN and HITRAN are sophisticated models using physics. I'm not sure what you are trying to say with the predictive/descriptive thing. The values predicted by HI/MODTRAN have been verified for many conditions and show close agreement with observations. This was especially important from early on when developing the model and was the subject of abundant research. There is an entire body of litterature on this aspect of validation. These models superseded simple models such as the Swinbank many years ago, and allow for far more accurate and refined representations of atmospheric radiative processes. The tutorial that you linked only claims to be useful for cloudless vs cloudy night comparisons. It states to be valid for a surface "isolated from its environment."
The reason why CO2 receives emphasis in IPCC works is because all the research compiled continues to point to it as the forcing responsible for the changes observed. No other forcing fits the bill, no matter how hard we look. Furthermore, paleo evidence also points to CO2 as the major control knob. That is why it is necessary to accomplish a carbon free energy transition, then decarbonize as much of the World economy as possible. I do not advocate for geo-engineering, but if it comes to that, large scale carbon capture is likely the least risky option. Not only it will just reverse the recent trend, but it will also mimic what has happened naturally in the past.
In contrast, the geo-engineering schemes that you propose are among the least realistic I've ever seen. Paleo evidence suggests that the closing of the Panama isthmus was associated with the onset of the glaciation/deglaciation cycles. Forcing large amounts of sea water to do anything could lead to the mother of all unintended consequences and would require to transform the entire planet in some sort of gigantic engineering project.
As of now, airplanes emit CO2, H2O and various particulates. Although the altitude of release poses its own problems, the quantities involved make them far less of a priority than coal fueled electricity production. Recruiting commercial air traffic for the purpose you suggest would imply that they're equipped with carbon/water free propulsion, and then loaded with equipment decreasing their payload, while they already have the problem of energy density to contend with. That is nowhere near realistic.
Your remark on moving thermal and nuclear plants seem to allude to waste heat. This has been discussed on this site and shown to be an order of magnitude too small to be a significant factor. In addition, large industrial facilities of any kind can not be "moved." They would have to be dismantled (expensive process) then rebuilt somehwere else (even more expensive). In the case of electricity producing facilities, relocating far away from consumption sites also carries innumerable other problems.
I don't see that you've shown to understand atmospheric radiative processes anywhere near as well as you claim, and certainly not in a way to turn current understanding by experts on its head; it would be a euphemism to call your geo-engineering ideas far fecthed.
About Mars:
http://marsnews.com/the-planet-mars
One (among many) relatively recent MODTRAN validation study:
https://www.ncbi.nlm.nih.gov/pubmed/22614400
About moving sea water:
http://www.sciencedirect.com/science/article/pii/S0012821X05004048
[JH] Links activated.
And that last piece about Swinbank vs MODTRAN. Note that the Swinbank model dates back to 1963.
https://www.sciencedirect.com/science/article/pii/0038092X9500117A
Excerpt: "Besides, the formulae of Swinbank (1963) and of Czeplak and Kasten (1987), which both express the emittance as a quadratic function of dry bulb temperature, turned out to reflect the radiation physics of “normally” stratified not too dry atmospheres."
Interestingly, it turns out that MODTRAN in fact validated the Swinbank model under the somewhat narrow circumstances described above. Swinbank came up with a good way to estimate things that were later derived much more precisely from radiative physics. That's how science works. I don't see how anyone would prefer to use Swinbank over MODTRAN or HITRAN at this point in time, except for the simplicity of use, but computers mostly solve that problem.
http://www.realclimate.org/index.php/archives/2017/08/sensible-questions-on-climate-sensitivity/https://skepticalscience.com/global-warming-on-mars.htmPhilippe,
Thank you for your patience. I believe you and I are both serious about finding a solution to achieving a stable climate in time to make a difference.
First a comment on the super computer models: I do not have access to an array of super computers and all the configurations of climate models out there. However, I can see from Equilibrium Climate Sensitivity calculations that the variations in results are higher than the effect that it intends to discern. As the variability fails to converge with increasing trials this suggests they are not efficient estimators and may be being pushed in resolution far beyond their capacity. It is comforting that the Swinbank model has been confirmed, but for broad conclusions Swinbank may be as accurate as we need. https://en.wikipedia.org/wiki/Climate_sensitivity.
The last 15 years shows the total annual accumulated energy of about 12.5 ZJ/year and accelerating, (mostly in the oceans and cryosphere, not the atmosphere). This is about 20x the human consumption of energy (nearly all from fossil fuels). It appears this factor of 5% factor could be stable. Therefore, before arguing about CO2 why don't Climate Scientists first try to factor-in the heat loading caused by heating from human's non-renewable energy consumption. As non-renewable human energy consumption is mostly from fossil fuels it would correlate well with CO2 accumulation. However, looking to CO2 first may be confounding the conclusion that CO2 as a principle source.
We know that nuclear energy is associated with harmful thermal pollution. So the notion that simply switching to non GHG nuclear would fix global warming is as preposterous as the notion that CO2 is big knob it's made out to be.
Can we agree therefore that to achieve thermal control while humans continue to add to the heat load we could improve nighttime radiant cooling?
You don't need an array of super computers to be convinced that only decreasing the downward flux of nighttime insulting layers, (clouds, humidity, and sea ice) will radiate enough energy to space to stabilize the climate. The near absolute zero temperature of space should be sufficient to stabilize earth's climate regardless of what happens with the sun, or the currents or CO2 concentrations. Recall that the shady regions of the poles on Mars maintains solid water ice.
If we agree with this, then perhaps we can move on to implementing a solution.
To be honest, I understand your mocking tone, Alfred Wegner's ideas about plate tectonics were mocked by fellow geologist for 45 years (from 1915 to 1960) before finally being accepted. Unfortunately, we don't have that much time to solve the global warming problem. I contend that CO2 is an unnecessary distraction and opens the community up to unnecessary charges of bias and ulterior motivations.
Here is additional information on the partial pressure of CO2 on Mars that supports the premise that reducing CO2 concentrations is irrelevant to achieving global thermal control:
The 4% of gases that are not CO2 include 1.9% argon, 1.9% nitrogen, and traces of oxygen, carbon monoxide, water, and methane. The partial pressure of CO2 on Mars is about 6 millibars, which corresponds to 6,000 ppm were it all transported to Earth.
Thinking about Mars: 3. Air | LinkedIn
http://www.answers.com/.../What_is_the_partial_pressure...
[TD] You wrote "Therefore, before arguing about CO2 why don't Climate Scientists first try to factor-in the heat loading caused by heating from human's non-renewable energy consumption." That has been done. Waste heat is insignificant compared to heating from greenhouse gas increases. Please read the post devoted to that topic, and put further comments on that topic there, not here.
You wrote "only decreasing the downward flux of nighttime insulting layers, (clouds, humidity, and sea ice) will radiate enough energy to space to stabilize the climate." All insulating layers operate not just at night but during the day. There is no special leverage from reducing insulation at night rather than in day. Greenhouse gases are part of that insulation, and human-caused increases in greenhouse gases are forcings. Humidity (water vapor) is a feedback not a forcing. Likewise clouds. Sea ice, too.
Please read the post about Mars.
There are plenty of opportunities for you to learn about climate sensitivity. Here is one on SkepticalScience. And Then There's Physics has a recent post that links to others you should read for background. RealClimate has a similarly useful recent post.
errata -
Recall that the shady regions of the poles on Mercury maintains solid water ice.
https://skepticalscience.com/Second-law-of-thermodynamics-greenhouse-theory.htmhttp://rabett.blogspot.com/2017/10/an-evergreen-of-denial-is-that-colder.htmlThank you for the quick response. Please repeat the link to "Waste Heat"
Regarding insulating layers during the day. Your comment messes with my understanding of the 2nd law of thermodynamics. My understanding is that heat flows from hot to cold, not the other way, so unless the incomming radiation from the sun (5000+ oC) is less than the surface (maybe a lava flow would be an example) then I dont see how reducing insulating layers during the day rejects more heat to space. In general 9am to 3pm the earth absorbes radiant energy. The other 15 hours the earth rejects energy. More energy would be rejected if water vapor and cloud cover were removed at night. More energy would be absorbed if they were removed during the day.
"the 2nd law of thermodynamics - heat flows spontaneously from a hot to a cold body" http://theory.uwinnipeg.ca/mod_tech/node79.html
[TD] Sorry, I fixed the waste heat link now. You can also use the Search box at the top left of every page to find relevant pages on many topics.
The 2nd Law of Thermodynamics says that net flow of energy between two bodies is in the direction of the higher energy body to the lower energy body. (The word "heat" is used loosely both by the lay public and physicists, so it's better to talk about "energy" when getting technical.) See the Skeptical Science post; read the Basic tabbed pane, then the Intermediate one. Then watch this video by izen. Then read The Green Plate Effect by Eli Rabbett, which prompted Izen to make his video.
I was able to find the Waste Heat Article. I will comment there. thanks
Is it true that GHG delays energy flow from sun to earth proportional to solar intensity during the day, and delays energy flow from earth to space at night? If so, I don't understand your claim "no special leverage from reducing insulation at night rather than in day." In fact this leverage is exquistly controlable and substantially more effective than reducing GHG both at night and day.
[TD] The wavelengths of radiation that greenhouse gases absorb are only a small portion of the radiation from the Sun, but a large portion of the radiation emitted by the Earth. Please read Global Warming in a Nutshell.
Yes, and water vapor and cloud cover are controlable on an hourly time frame using airborne weather modification methods, as demonstrated during the Beijing Olympic Games. http://www.businessinsider.com/china-sets-aside-millions-to-control-the-rain-2016-7
Let's step back and consider global warming as just another rate process and use a water tank as an analogy. Rate is proportional to the driving force - pressure in the tank, and temperature in heat flow. It also is proportional to the cross section of the conduit - valve in the tank and emissivity in radiant heat flow. Rate is inversely proportional to the path - tube length in the tank and slant path through the atmosphere for global warming. The tank fills on a cosine profile during the day through a valve controlled principly by cloud cover, and water vapor valves. In comparison the CO2 and ozone are tiny valve, but useful on a decade or century scale, while the main players effect is felt immediatly causing changes in temperature - water level - in 10s of degrees, as much as 50 W m-2, while CO2, which changes every season in the Arctic by 15 ppm, hardly registers when compared to the same Antarctic latitudes where CO2 concentration changes from summer to winter is much less.
The output of the tank is also controlled principly by the moisture and cloud cover factors as well. Human energy consumption from non-renewable nuclear and fossil fuels acts like a burner under the tank. Moving heavy industry to thin, dry desert environment can provide them their own wider output valve. Moving sea ice off the Polar Winter sea increases the driving force - temperature difference - increasing the rate.
What we're shooting for is a Global Active Thermal Control System. I'm not saying the Passive Thermal Control (CO2) - analogous to the shell of the spacecraft is not important, just that it's insufficient to maintain a stable climate.
[TD] It appears you are not reading any of the material I've pointed you to, not even attempting to understand it, because you are not even arguing specifically against any of that material. Instead you are merely repeating your wildly incorrect claims. That is called "sloganeering" and is prohibited on this site. If you'd like to engage in commenting on this site, address the specific topics on the specific threads addressing them. You might start with your incorrect belief that CO2 blocks as much energy coming from the Sun as it blocks leaving the Earth; discuss that on the "Nutshell" post I gave you. Then address your incorrect understanding of the 2nd Law of Thermodynamics, on that thread. Then actually read the publication linked in the Waste Heat thread (preferably the one I linked for you, not the secondary one you commented on). Then make your claim about the ability to control global humidity on the water vapor thread I pointed you to; for that one you must demonstrate that the dependence of humidity on temperature can be overcome on a global scale. Finally, if you want to make claims specifically about geoengineering, find an appropriate thread for that, such as Scientists Debate Geoengineering.
Thank you again for your patience and quick response, and your suggestion that I comment on other articles you suggest is good.
If you could, please help me correct my post on the "secondary waste heat" article since I appear to have flipped the division at the end. Heat loading from inefficiency of human consumption of heat energy (50% at best per Carnot's Law) is only 4% of the earth's reported heat accumulation not 20x. Please delete that post, I will repost to the linked discussion.
Also please send me the link to instructions on posting images. The graph of power flux vs temperature and humidity I posted to IMGUR, and linked here apparently was not effective.
I sincerely appreciate your "sloganeering" policy. But, what is the term for stating flatly a concept "wildly incorrect", and subsequently miss-quoting a contributor?
Using your perfectly acceptable car analogy, would have people believe that it is the glass that generates heat (analogous to CO2) rather than the cars inside surfaces. As I've tried to explain, a better analogy is that GHGs act as a valve, not a heat source like the solar radiation, or surface temperature or waste heat from a heat engine. To me, push the concept that CO2 is a forcing factor is more "sloganering" than accepting that GHG has a better analogy as a valve in a Rate Process illustration.
Also, I believe you miss-quoted me "CO2 blocks as much energy coming from the Sun as it blocks leaving the Earth". What I said was that emissivity is a multiplying factor for black body radiaton. Downward solar and upward earth radiation have different spectras, but in both cases humidity and clouds (a reflective component) are principle effects felt on the day to day cycle, while CO2, methane are minor compnents felt on decade/century scales. On a seasonal basis, even a 15 ppm seasonal variation of CO2, caused by the gowth/decay cycle of the Boreal Forest is not a perceptible contributor to Arctic temperatures relative to the Antarctic at similar latitudes, but without the levels of CO2 variation on a seasonal time frame. If this is not the main point of this argument [CO2 limits won't {this century} cool the planet] please excuse me.
Mr. [TD], it may not be your fault that you cannot accept my claims. You may not have the background to do much more that than point to articles that may or may not support your position. That's okay. I've been told that without dozens of peer reviewed Journal articles, even well trained scientists will back off of their stongly held beliefs. It seems the smarter one is, the better they are capable of rebutting serious challenges, even if they're wrong.
[DB] Inflammatory snipped.
Please note that posting comments here at SkS is a privilege, not a right. This privilege can be rescinded if the posting individual treats adherence to the Comments Policy as optional, rather than the mandatory condition of participating in this online forum.
Please take the time to review the policy and ensure future comments are in full compliance with it. Thanks for your understanding and compliance in this matter.
Also please note that the burden-of-proof is on you to support your claims with citations (preferably in the form of linked citations) to credible sources. Just saying "nuh-uh" is not sufficient to overcome being disproved by another commentator or another moderator.
[TD] See if the SkS Analogy 3 helps you understand. Then read SkS Analogy 9. Then SkS Analogy 6. Then SkS Analogy 10.
Aaron Davis,
This is a scientific blog. Posters are expected to support their posts with links to the peer reviewed literature. Since you never link any supportive data and you make many basic mathmatical errors in your calculations, your arguments hold no weight. Since you have not supported your arguments, and they show no knowledge of physics, they can be dismissed as "wildly incorrect" by an informed reader.
When you have to ask to have a previous post removed due to gross errors you have no standing to slander the moderator who is trying to help you learn the basics. You cannot claim you are an expert when you have to ask to have a post removed in the same breath. Your claims demonstrate a basic lack of understanding of physics and also reek of the Dunning-Kruger effect.
Please try to raise your game. You must cite the peer reviewed literature if you want to be taken seriously. If you contradict the literature without any support (for example stating the CO2 is not the primary temperature control) you are not convincing.
Pick the issue that you want to learn about. I suggest the fact that CO2 is the primary control knob of temperature. Focus on that until you understand why you are currently wrong. Until you understand the basics you will never understand more complex issues. Hint: if scientists agree on a point and you disagree it is not the scientists who are wrong.
Aaron Davis @3,
Whilst being off topic, it is probably appropriate to address here the deficiencies in your "facts" analysis.
The level of CO2 in the terrestrial atmosphere is today about 620 ppm by weight or 0.062%. Martian CO2 levels are perhaps 98% by weight. These are the figures that should be used if you wish to calculate kg of CO2, rather than your ppm-by-volume values. With the Martian atmosphere 0.6% the pressure of the terrestrial atmosphere and gravity 38%, the number of CO2 molecules a photon has to negotiate within the Martian atmosphere, relative to the terrestrian one, is thus about 25 times, or there abouts.
However, the direct comparison of Martial temperatures with terrestrial ones is dependent on more than just the presence of GHGs. As a first approximation, Mars is 151% further from the sun than Earth but has 82% of the albedo, so Earth absorbs 1.51^2 x 0.82 = 187% (1/53%) more warming. If we accept the widely quoted average terrestrial temperture of 288 K and GHG effect of 33 K, the non-GHG temperatures would be 255 K for Earth and 218 K for Mars.
The comparison of noon-day equatorial temperatures on Earth & Mars is a poor measure of global temperature given the terrestrial diurnal range is perhaps 10 K (or less at Manta )while the Martial equivalent diurnal range has been measured at 125 K. Even in the middle of the Sahara Desert, far from the moderating effect of oceans and with H20 and cloud greatly reduced, the terrestrial dirurnal range is shown as 15 K, a level of magnitude smaller than for Mars.
A fuller account is perhaps required. The actual average Martian temperature is still not accurately measured. Results from modelling variously quote values roughly 218 K suggesting a minimal Martian GHG effect, and even the surface temperature lower than the effective radiative temperature (Covey et al 2012), although only when simplistically calculated (Haberle 2012). The 25 times Martian CO2 levels should not be seen as providing a large GHG effect.
A simplisitc calculation for the direct CO2 impact on terrestrial climate CO2 levels increased 25 times today's would suggest (from 4.5 doublings) a direct temperature increase of 4.5 K to which should be added the CO2 contribution from today's CO2 levels. Today's full GHG effect is widely quoted as 33K and CO2 has been calculated would provide 26% of this in the absence of other GHGs (as the situation on Mars). Thus the 25x CO2 effect would total 4.5 + 8.6 = 13.1 K from a total of 58Wm^-2 forcing.
At first glance, this 13.1 K/58Wm^-2 GHG effect for the terrestrial atmosphere on Mars appears entirely absent. (The 218 K Martian temperature as a black body would roughly radiate equal to the Martian solar warming of 53% terrestrial as set out above.) However there are three adjustments required for such a finding.
Firstly, the effect occurs in a cooler climate with less radiation flying about. This reduces the warming to 12 K with 31Wm^-2 forcing when the total radiative spectrum is considered pro rata. There is further reduction as the radiation in the region impacted by CO2 is less significant overall at such temperatures. Thus the full less-radiation-about adjustemnt results in roughly 10 K with 26Wm^-2 forcing.
Secondly, the effectiveness of the GHG effect on Mars will not be equally efficient as on Earth. Indeed more serious calculations (eg Clive Best) suggest the thin and cold Martian atmosphere would be warmed by perhaps just 12 Wm^-2 of foring which calculates as just 4 k additional to a 218 K planet. (I assume the 2 K value set out by Clive Best is a a mistake.)
Thirdly, with no oceans and only a thin whispy atmosphere, a warming Mars has naff-all to heat up except the rocks (just like on the moon). So not only is there very little thermal mass in the atmosphere (1% of the terrestrial atmospheric thermal mass), Mars also lacks having two-thirds of the planet kept at a constant temperature throughout the diurnal cycle due to 4km-deep oceans. As a result, Martian day-time temperatures skyrocket and leak significant energy away as a result. And come night-time, temperatures plummet. The full night-time atmospheric temperature drop experienced in Earth over 12-hour is equalled in just 8 minutes on Mars. This is thus large diurnal range and is significant for the global average temperature as maintaining a constant temperature is radiatively more efficient than having big diurnal temperture ranges. The moon's diurnal range, for instance (although an extreme example with zero GHGs & month-long days) has an average temperature 50 K lower than the temperature that could be maintained as a black body with the same radiative losses (this calculated using the data presented in Williams et al (2017) Fig 9a ). On Mars, such 'radiative inefficiency' is much less but still bigger than the GHG effect of 4 K (seemingly) calculated by Clive Best.
Subject to any mistakes of my own, this accounts fully for the lack of GHG effect warming Mars apparent from simplistic analysis.
[TD] Other moderators: Perhaps this comment could be part of the yet-unpublished counter to the argument that Mars should be warmer?
Yes, thank you and I’m sorry you seem to take my skepticism personally. And you are correct that I should try to improve the quality of the posts. I would however suggest that, as moderator you could be a bit more charitable. There is a principle in rational discussions that we should try to put counter arguments in the best possible light. With that in mind please consider this preliminary result.
Would you agree that the “fact that CO2 is the primary control knob of temperature” needs a little qualification? It’s obvious that over a 12 hour period, the primary control knob for global warming is certainly not CO2 concentration. However, over a season there are credible reports of significant variations of about 15 ppm in the high Northern latitudes while similar environments in the southern latitudes do not show this level of seasonal variation. See https://www.esrl.noaa.gov/gmd/ccgg/mbl/mbl.html. Another quote from Boston University confirms the statement.
2.2.C. Recent Anomalies in the Global Carbon Cycle
The CO2 record exhibits a seasonal cycle, with small peak-to-trough amplitude (about 1 ppmv) in the Southern Hemisphere, but increasing northward to about 15 ppmv in the boreal forest zone (55-65 degrees North). This cycle is caused by the seasonal uptake of atmospheric CO2 by terrestrial ecosystems. http://cybele.bu.edu/courses/gg312fall01/chap02/chap02.html#one
Using another reference, let’s see if we can detect the effect of this 15 ppm seasonal variation in Arctic Temperature records caused by the decrease in CO2 levels begining every year in May https://scripps.ucsd.edu/programs/keelingcurve/2013/05/07/why-are-seasonal-co2-fluctuations-strongest-in-northern-latitudes/
For the data I refer you please see “RSS MSU global monthly lower troposphere temperatures since January 1979” http://data.remss.com/msu/monthly_time_series/RSS_Monthly_MSU_AMSU_Channel_TLT_Anomalies_Land_and_Ocean_v04_0.txt
To quantify the effect of CO2 we can examine the differences in temperature between the warm Arctic August/September when plants have removed 15 ppm CO2 concentrations and the same seasonally warm months in the Antarctica (February/ March). The effect we are looking for is a consistent reduction in relative temperature in response to a 15 ppm reduction in CO2 relative to the Antarctic however there may be other effects. To get a handle on these effect we take another difference. Specifically, the difference between stable CO2 concentrations in the cold Antarctic season (August/September) and the cold Arctic seasons (February/March) before the reduction of CO2 concentrations in the Northern latitudes. This 2nd difference provides a baseline.
• T_ant_FM – T_arc_AS = other effects + 15 ppm less CO2
• T_ant_AS - T_arc_FM = other effects
• 15 ppm less CO2 =
• (T_ant_FM – T_arc_AS)_lowCO2inArc –
• (T_ant_AS - T_arc_FM)_highCO2inArc
Where:
• T_ant_FM is Average Temperature in the Antarctic over February and March.
• T_ant_AS is Average Temperature in the Antarctic over August and September.
• T_arc_FM is Average Temperature in the Arctic over February and March.
• T_arc_AS is Average Temperature in the Arctic over August and September.
As expected the effect of 15 ppm less CO2 in the Arctic in calculated over the 39 year data set shows an average decrease of temperature (negative 0.10oC). However the Standard Deviation of the 39 year series is 0.79oC. On a decade or century scale the effect of CO2 may well be more significant but the average over first 10 years of this sequence (1979-1988) is positive 0.29oC, which alone could denying the significance of 15 ppm seasonal decrease in CO2 during the 1979-1989.
In this reference the raw dataset is plotted about 1/4th down the page. www.climate4you.com/Polar%20temperatures.htm . A clear jump and continuous rise in Arctic Temperature Anomaly starting in 1994 is not seen in the Antarctic. What could have happened starting in 1994? https://commons.wikimedia.org/wiki/File:Bp_world_energy_consumption_2016.gif
For one thing Coal took off like crazy, mostly in China producing haze all over the Northern hemisphere including the Arctic. An increase in temperature over the affected area confirms my hypothesis that barriers to both nighttime and daytime radiant cooling is counterproductive.
I would be delighted to read serious challenges to this analysis. Sorry for not referencing other skeptical science articles. My search showed no articles or arguments using “15 ppm”. This argument "CO2 limits won't cool the planet" still seems most appropriate.
Best regards.
[TD] Read Does CO2 Always Correlate With Temperature?--the Basic tabbed pane, then watch the video. Then read the Intermediate tabbed pane.
Then read How CO2 Warming Is Driving Climate.
Then read CO2 Is the Main Driver of Climate Change--the Basic tabbed pane, then watch the video. Then read the Intermediate tabbed pane.
Then read How Do We Know CO2 Is Causing Warming?--first the Basic tabbed pane, then watch the video there. Then read the Intermediate tabbed pane, then the Advanced one.
Then watch climatologist Richard Alley's lecture The Biggest Control Knob.
Aaron Davis @16,
Always happy to bring delight.
You attempt to calculate the effect of a polar GHG effect resulting from a seasonal 15ppm decrease in atmospheric CO2 concentrations over the arctic in summer. You attempt this by comparing the variation of arctic temperature summer and winter with the same variation in antarctic temperatures. The serious errors in your grand analysis are::-
(1) You fail to consider the potential magnitude of such a CO2 effect. Are you asking the impossible of your method - trying to use a microscope to measure the distance to the moon or a twelve inch ruler to measure the width of a human hair? If there were a signal to detect, it would perhaps be a fraction of the global response to a 15ppm decrease in CO2 over the preceeding three month period, something less than 0.001ºC perhaps?
(2) The climate of the arctic & antarctic are greatly different so their annual temperature ranges are going to be vastly dissimilar.
(3) You appear to be using not temperatures by temperature anomalies over a period in which the 15ppm cycle has operated throughout and thus the effect will be entirely absent within any anomaly.
(4) You fail to mention the 1ppm sinusoidal antarctic CO2 cycle which would reduce your raw 15ppm by 1ppm.
(5) The results are expressed incoherently. As described the result I obtain does show a non-statistically-significant downward trend but beyond that nothing that could be interpreted as "an average decrease of temperature (negative 0.10oC)" or "the Standard Deviation of the 39 year series is 0.79oC".
(6 The "raw dataset" referred to is not the data used in analysis but a broader dataset for the full year. The "clear jump" etc are not evident within the data analysed.
The serious errors in your grand analysis are::- MAYBE NOT SO SERIOUS but thanks anyway.
(1) You fail to consider the potential magnitude of such a CO2 effect. Are you asking the impossible of your method - trying to use a microscope to measure the distance to the moon or a twelve inch ruler to measure the width of a human hair? If there were a signal to detect, it would perhaps be a fraction of the global response to a 15ppm decrease in CO2 over the preceeding three month period, something less than 0.001ºC perhaps?
a. The potential magnitude of such a CO2 effect can be discerned from the Equilibrium Climate Sensitivity. Here a 100% increase in CO2 concentrations should result in a mean change in temperature between 2oC and 7oC. A decline of 3.5% (-14/400 ppm) should be between -0.07 and -0.245oC. While the 39 year slope is -0.1oC per cycle, the initial 10 year average of 0.24oC is way out of bounds. The standard deviation is 0.79oC, rather than 0.175oC - or 4.5x the expected range. https://en.wikipedia.org/wiki/Climate_sensitivity
(2) The climate of the arctic & Antarctic are greatly different so their annual temperature ranges are going to be vastly dissimilar.
a. I feel this is an excellent comparison since the slant path sun angle, which are predominant effects are normalized. Proximity in time (6 months) removes the year to year variation. Geophysics is a science of removing confounding effects. While the test fails at 15 ppm, I’m careful not to conclude CO2 significance fails at longer time frames of centuries, but at these longer timeframes any hope of affecting an effective Active Thermal Control by moderating CO2 is not feasible.
(3) You appear to be using not temperatures by temperature anomalies over a period in which the 15ppm cycle has operated throughout and thus the effect will be entirely absent within any anomaly.
a. The term anomaly refers to removing a reference temperature to both sequences and has no effect on the results.
(4) You fail to mention the 1ppm sinusoidal Antarctic CO2 cycle which would reduce your raw 15ppm by 1ppm.
a. I agree, for calculations I will refer to a 14 ppm variation in baseline CO2 concentrations (see response 1a).
(5) The results are expressed incoherently. As described the result I obtain does show a non-statistically-significant downward trend but beyond that nothing that could be interpreted as "an average decrease of temperature (negative 0.10oC)" or "the Standard Deviation of the 39 year series is 0.79oC".
a. Yes, I agree the conclusion could be expressed better, but I think you have the main points okay. The negative slope may be in response to an increase in seasonal CO2 variations in later years beyond the 14 ppm swing.
b. I would appreciate it if someone could give me instructions on posting an image. I believe that if Ptolemy had seen what Galileo saw he would have come to the same conclusions.
(6) The "raw dataset" referred to is not the data used in analysis but a broader dataset for the full year. The "clear jump" etc are not evident within the data analysed.
a. The chart I refer to appears ¼ of the way down on the website http://www.climate4you.com/Polar%20temperatures.htm#Recent . Temperature changes in the two Polar Regions shows the jump in Arctic Temperature relative to Antarctic Temperature starting around year 1994. The caption on the figure starts with “Global monthly average lower troposphere temperature since 1979 for the northern (60-82.5N) and southern (60-70S) polar regions, according to Remote Sensing Systems (RSS).”
b. A serious engineer would place more emphasis on the 1.25oC rise in Arctic temperatures from 1994-2017 over what appears to be a modest effect of CO2 over this 23 year time frame.
Best regards.
[TD] Your use of equilibrium climate sensitivity is completely inappropriate. ECS is estimated only for the entire planet, and is defined to be after equilibration of the entire planetary climate system with the new, now stable, level of CO2. Equilibration takes hundreds to thousands of years. For just some background, see GFDL's post on equilibrium and transient climate sensitivity.
Aaron Davis @18,
Not only are you seriously in error throughout you grand analysis, you are too stupid to understand when these errors are pointed out to you.
Perhaps we should consider the most egregious error you make. This is the inability to understand that an anomaly will take away any sign of temperature variation if such a variation resulted from an annual dip in CO2 over tha arctic. Consider this. The graph below is the RSS TLT data for arctic & antarctic, the graph you cite up-thread. It plots anomalies. Note the maximum variation is just +/-a handful of degrees centigrade from zero.
So what happened to the annual variation in polar temperature? This would give an annual cycle of 30ºC peak-to-peak but it has been disappeared. This disappearance is achieved "...by subtracting the a mean monthly value determined by averaging 1979 through 1998 data ... for each month." So the stonking big annual 30ºC cycle is entirely disappeared and any other annual cycle (like for instance a possible teeny weeny drop in temperature due to CO2 levels dropping by a few ppm every year for a handful of months) will also be disappeared with it. Was this teeny weeny cycle there during the period 1979-98 which provided the data for the anomaly base?
It appears it was! So it too would be disappeared from the anomaly.
Arron Davis, if you cannot comprehend this basic property of anomalies, you don't really have a place comment about anomalies on this thread.
[TD] Snipped insult.
https://www.youtube.com/watch?v=BgiBcycZ1Ek&t=9s
Work by Khilyuk has shown that only 11% of heat transfers in the troposphere is carried by radiation;
Khilyuk, L. (2003). Global warming: are we confusing cause and effect? Energy Sources, 25(4), 357-370.
Expect to see a complete re-write of the theory of global warming. With this new model I hope to see the development of an Active Thermal Control System for the Earth providing a stable climate for our posterity, Good job Ned!
[TD] If you really want to push such nonsense despite its violation of all empirical evidence and centuries of physics, at least do it on a more appropriate thread.
MA Rodger - Yes, I see that I missed the definition of the anomoly. I was incorrect in assuming the anomoly was the annual rather than monthly. Thank you for pointing that out.
[TD] You really need to take that as a lesson that you really, really need to read and deeply consider the replies to you, and the material that you are being pointed to, instead of ignoring it all and merrily continuing to post your self-generated notions that violate fundamental physics, mathematics, and even logic.
Aaron Davis @21,
And you may need to reconsider your opinion that latitude (north or south) provides an "excellent comparison since the slant path sun angle, which are predominant effects are normalized."
The arctic is ocean surrounded by land. The antarctic is land surrounded by ocean. Does that make a difference?
Here are two locations with identical "slant path sun angles" for your consideration. The FM and AS averages are marked.
Ooops!! There appears to be a "predomenant effect" or two that are not in any way "normalised."
The average monthly values over all latitudes between 60-70oN should smooth out the differences. Irkutsk at 52.3N and 51.5N is not especially relevant to the question. When I find the monthly averages without the correction you identified I will try it again.
Just to be clear, is your claim that a 3.5% change in CO2 is not perceptable or that it is perceptable but my comparison with Antarctic temperatures will not support that conclusion since "Other Effeect" are not consistent enough within the same year to be cancelled out of the difference equations @16? It appears that you are arguing the latter, but without sufficient, acceptable and relevant evidence for me to rebut.
Please be so kind as to accept the burden of proof in this regard. Or simply wait for me to arrive at this conclusion on my own once more data is identified.
Best regards,
Aaron Davis @23,
I am failing to grasp what you say in your first paragraph.
One point that can be cleared up by me. The Latitude quoted in my graphic @22 should of course be 52N and not 54N. Interestingly, BEST give data with an identical latitude of 52.24N for both Irkutsk and London although in the latter case, this latitude is representitive of a UK value which they substitute for a London value. (My intention at first was to graph BEST data rather than the Wikithing stuff.)
However directly addressing your first paragraph, I am not sure what you mean by your 'smoothed out differences,' why locations at 52.3N or 51.5N or there-abouts would 'not be especially relevant,' or what you meant by "correction you identified." (Perhaps I should also mention here your use of RSS that involves significantly different latitude ranges for the two poles.)
Concerning the rest of your comment @23, I set out @17 six serious errors in your grand analysis, factors you suggested @18 were "maybe not so serious" and you now @23 ask for clarity in what I "claim."
Of the six serious errors set ou @17, four address your method and of these three as existential in argumentation terms. That is, there are three reasons why no signal of the phenomenon you seek will be identified within the data you use. Using the numbering @17 for reference, these are (3) The data you use are anomalies and thus have had the signal you look for removed, as explained @19. (2) The differences between the regions being analysed will provide noise that will entirely swamp any signal were it present, an exemplar demonstration of this provided @22. (1) The signal would be minute and smaller than the measurement accuracy of the data you use. I suggested @17 "less than 0.001ºC, perhaps". The 'perhaps' was me wondering if it were better another zero would be added. Your misuse @18 of ECS (with values 2 to 7) yielding your estimate of "should be between -0.07 and -0.245oC" was flagged in the Response @18. If ECS were used to give a ball-park figure for this a phenomenon, it should be noted that perhaps 4% of the warming involved in ECS occurs in the first year of a forcing, and that the 15ppm cycle is effectively operating for just 2 months prior to the measurement period. So for ECS=3, the response would be 3 x 0.0375 x 0.04 /6 = 0.00075ºC.
Perhaps we can put this 15ppm dip in context by considering the size of the forcing and its impact prior to the measurement period. Such a dip in CO2 over +70N (the Arctic Ocean) would provide 9e18j. Over this same period the Arctic Sea Ice Volume experiences a melt of ice requiring 4,500e18j (+/-600e18j to 2sd) - the melt values from PIOMAS 1979-2017. Or simply in terms of heating an isolated atmosphere, the 9e18j would provide a 0.06ºC increase but with losses to space, to the surface and to lower latitudes due to atmospheric circulation, you would need another zero or two.
I have written the following email to support@remss.com. Perhaps by next week I can resolve this issue. I thank you for your interest.
Greetings,
I am trying to quantify the effect of the 3.5% swing in CO2 concentrations in high Northern latitudes relative to high Southern latitudes. The data I have access to are monthly anomaly data where apparently the effect I am seeking: monthly temperature swings have been removed.
Unfortunately, I do not have access to the referenced ftp site. Could you please provide the average monthly (12 data points) temperature for both the 60/82.5 band and the -70/-60 latitude bands. This would be 24 data points, one for each month in the two bands.
Very sincerely yours,
Aaron Davis
The set of 12 month means for 1979 to 1998 are included in the netCDF files available on the ftp server (ftp.remss.com/msu).