


 Arguments


Recent Comments
Prev 92 93 94 95 96 97 98 99 100 101 102 103 104 105 106 107 Next
Comments 4951 to 5000:
-
nigelj at 07:26 AM on 20 August 2021Is Western U.S. experiencing a ‘megadrought’?
I was curious what caused these megadrougts in the past, and found this: "Civilization-Collapsing Megadroughts of Medieval Times Could Be in Store for a Warming Earth".
-
ilfark2 at 02:39 AM on 20 August 2021The new IPCC Report includes – get this, good news
thanks very much
-
swampfoxh at 16:42 PM on 19 August 2021Is Western U.S. experiencing a ‘megadrought’?
William DeBuys...that pesky speller, sorry
-
swampfoxh at 16:25 PM on 19 August 2021Is Western U.S. experiencing a ‘megadrought’?
A shorcut to understanding Western drought cycles can be found in William DeButs book "A Great Aridness", Oxford U., 2011. I think he reminds us that those cycles have been repeating about every 1,000 years since the end of the last ice age. The last "bad one" was around 1050 CE
-
MA Rodger at 02:58 AM on 19 August 2021The new IPCC Report includes – get this, good news
ilfatk2 @4,
I assume you are asking how additional warming will be constrained to keep us under +1.5ºC if we are already at +1.1ºC. Thus what you describe being "as we go back down the CO2 curve over the next 80 years" concerns our reduction in CO2 emissions in coming decades.
The processes that will determine whether we will keep warming under +1.5ºC are detailed and complex but I am assuming you are happy with the idea that when we do at last reduce CO2 enissions to zero, the global temperature rise will effectively stop.
(If you are not entirely clear on the reason for this 'stopping', it is because the "earth system" is not actually absorbing half our emissions. It is absorbing annually a level of CO2 that happens to be equal to roughly half our annual emissions. In rough numbers, we emit into the atmosphere 10Gt(C) per year while the planet sucks 5Gt(C) out of the atmosphere in the year. Very little of this 5Gt(C) 'in the year' is due to our emissions 'in the year'. If we didn't emit any CO2 next year our rough absorption number would only drop by something like 0.3Gt(C) because what is being absorbed is the accumulation of our CO2 emissions thrugh the years.)
So if AGW effectively stops when we achieve zero emissions and 2050, in three decades time, is often given as a lacklustre target date consider the rate of AGW is today running at something like +0.25ºC per decade. So at that rate we would see +0.75ºC additional warming by 2050.
But we hopefully will not be mad enough to run up to 2050 without large cuts running through those three decades 2021-50. So that +0.25ºC/ per decade will drop with successive decades, perhaps halving that post-2021 warming, say +0.20ºC+0.15ºC+0.5ºC=+0.40ºC, and allowing AGW to be restricted to +1.5ºC.
I hope that makes sense of the basics of the situation.
It will require deep cuts and even then note the negative emissions factored-in post-2050 to achieve +1.5ºC.
Sadly I am not entirely convinced that politicians (& I speak here for UK which is where I am) are truly understanding of the deep deep do-do we are facing and why deep deep cuts in emissions are essential and essential quickly. Instead the process seems to be drowning in greenwash.
I note your comment on tipping points and the link to the Lenton biog. My understanding is that the likes of Lenton are calling for the +1.5ºC limit to be taken seriously (as per Lenton et al (2020) 'Climate tipping points — too risky to bet against'). I am not aware of stronger scientific messaging although I would say that +1.5ºC is not without risks and is a level of warming that should be avoided rather than be seen as some target.
-
citizenschallenge at 02:08 AM on 19 August 2021Science and its Pretenders: Pseudoscience and Science Denial
Another excellent summary by Melanie Trecek-King.
All I might add is,
Unidirectional Skepticism, Equals Denial.
-
Philippe Chantreau at 03:32 AM on 18 August 2021Thinking is Power: The problem with “doing your own research”
I'm not sure the comparison is valid Graydrake. What you are describing is like delving in the cloud feedback litterature and finding a detail that will allow to refine regional forecasts. What is seen in the so-called "doing my own research" crowd when it comes to climate science is more like: "all these scientists have had it wrong but I know where the truth is, look at this YouTube video." Or someone trumpets that there is no GH effect when they clearly have no understanding of the radiative properties of the gases involved.
Medicine is indeed art and science, and there is a big difference between medical practice and medical research. However, you wouldn't give credence to anyone questioning the fact that we are made of cells or that sterile technique must be used to prevent surgical infections.
It is an already well known problem for practitioners that the quantity of new research findings coming out in a constant stream is impossible to keep up with. It would be convenient if there was an IPCC-like body for every specialty, that would synthesize the findings and come up with a "summary for practitioners." There is no such thing, unfortunately, and practitioners who have many patients to manage must rely on practice guidelines established by their specialty's associations and other bodies. These try to keep up but it always takes time to form guidelines, so they appear often years after research has been confirmed.
Doing no harm is the ultimate guiding principle; that often translates into simply doing less, or waiting until there is more scientific evidence. Every medical action or intervention, including diagnostic, carries risks; every medication can have adverse effects. Information obtained from tests and diagnostic procedures is only worth obtaining if it is truly useful and actionable, and the benefits from said action outweighs the risks of both the action and the diagnostic.
It sounds like you're alluding to recent guidelines recommending the use of Metformin outside of the range for which it is approved by the FDA. That may be advisable in some cases but any practitioner faced with that choice must weigh the risks and benefits and make an educated guess of how they will play out for a specific individual. Using a medication off label (i.e. Metformin for someone whose A1C falls below the range of FDA approved use) also carries liability risks for the practitioner. Metformin is not a benign drug. It sounds like you already had a good A1C and low enough blood glucose, what benefit did you obtain from using the medication?
Humans are the ultimate complex system, with a brain that can create therapeutic effects, side effects and even severe adverse effects when given placebos, whether they are placebo drugs or placebo procedures. Devising effective therapies for humans is a constant struggle because of that, and because of the level of refinement that has been attained by medical science. Practitioners also have to contend with people showing all sorts of dysfunctional relations to health and health care: high anxiety, hypocondriacs, Munchausen, and everything in between on the spectrum. You did not expand on your back pain MRI but, from the practitioner's point of view, if there is a well identified cause for it visible on the scan, trying to treat another possible cause is difficult to justify. In fact, practitioners can be questioned by insurance companies and ethics boards if they do that.
The positive outcomes you claim still fall under the "anecdotal" category. Practitioners are obligated to rely on well established evidence before recommending anything to their patients. Of course, we know that's not always the case, and that shooting in the dark can give results, nothing is perfect.
-
sfkeppler at 02:35 AM on 18 August 2021Is Western U.S. experiencing a ‘megadrought’?
You should investigate your usual origin of humidity. Isn't it the Amazon? The tremendous destruction of the Amazon hinders water vapor escape to the north and the south, causing drought and fire. A hot evapotranspirating Amazon brings rain and lower temperatures from the higher layers of the troposphere. This year, the Amazon is cool itself and has no energy for maintaining the convectional water-export in the right height.
Moderator Response:[DB] This post is about megadroughts in the western US, not the Amazon. For background on the effects of water vapor in the atmosphere (a feedback to temperature changes, not a driver of them), read both versions of this post and the comments section. Please stay on-topic.
-
ilfark2 at 01:54 AM on 18 August 2021The new IPCC Report includes – get this, good news
Ok, so there's still something I don't get (maybe it's a dumb question and feel free to ignore it).
So at 280 ppm CO2 (and whatever other GHGs at the time), the earth was at a given avg temp. Climbing up to 410 ppm CO2 (plus other GHGs), Anthro forcing brought the temp up at least 1.1 degrees C.
Over 150 years (using 1850 as baseline).
So, as we go back down the CO2 curve over the next 80 years, it seems hard to believe we won't increase the temperature by more than .5 C.
And this assumes the earth system continues to absorb over half of human emissions.
Odd they suggest there is "no tipping points temperature" since there is evidence we might have crossed it already:
https://geography.exeter.ac.uk/staff/index.php?web_id=Timothy_Lenton
-
Graydrake at 12:40 PM on 17 August 2021Thinking is Power: The problem with “doing your own research”
I am not a doctor, I have never taken a medical course and I am not a health nut. The following three issues, however, define the reason the concept of this thread is crucially important in creating a better tomorrow.
I read a brief article on an interesting non-invasive cardiac test, but my cardiologist recommended against it because conclusions were not always scientifically viable. I told him, as an engineer, more information never resulted in a worse decision, and we went forward with the test. Following the results, the cardiologist said, “I am not sure why you pressed for this test, but the results have identified a previously unknown condition, and I am going to change your treatment regimen.”
I abandoned one sporting activity after another over 50 years with chronic back problems. I ran across a piriformis muscle treatment in a university journal, and during a particularly painful episode suggested it to my orthopedic physician. He replied, the piriformis is not your problem based on my MRI and test data, but again I persuaded the doctor to perform the treatment. In two days my pain subsided and I have used this treatment successfully multiple times since.
Finally, I have type 2 diabetes. With my stable A1 C and glucose levels, my internist indicated for a couple of years I was not at a level that required medication. A non-scientific article suggested the newest opinion on diabetes management offered medication was now being recommended beneath my AI C and blood glucose levels. I am now taking medication to control blood sugar, a medication that has been around for over two decades.
These events certainly do not intend to detract from the contribution being made by medical science, however, they speak to decisions made by scientists on the continuum from art to science on complex issues. On every complex subject, quality conclusions combine proven science and artful judgment. The quality of the scientist's conclusion on the human body and climate management, it seems, is heavily based on his rational acknowledgment of where his database stands on the continuously moving science/art continuum – 60/40, 80/20, 95/5……… -
MA Rodger at 19:26 PM on 15 August 2021The new IPCC Report includes – get this, good news
anticorncob6 @1,
The CO2 budgets quickly become very complicated and comparing them takes a little spade-work. Here is my simplistic take on it.
That 2013 Carbon Budget you link to is quite a generous one, even though it is for +2ºC AGW. Its 1,000Gt(C) emissions budget or 3,664Gt(CO2) with an Airborne Fraction of 45% would yield [1,000 x 0.45 / 2.13 + 275ppm=] 486ppm atmospheric CO2 by 2090 (followed by negative emissions). Other Carbon Budgets, for instance the IPCC SR1.5 budget from 2018 set a budget at 432ppm for a 66% chance of avoiding +1.5ºC AGW, this with large negative emissions to follow the reaching of zero. (My assessment here using the simplistic Af=45%.) The AR6 SSP1-2.6 with its 2% annual reductions for a +2ºC AGW, again followed by negative emissions post 2075, I'd assess at something like 285Gt(C) post-2020 so 474ppm, not greatly less than that 2013 Budget you linked to @1. Mind the real wake-up numbers come from AR5 which put the 66% +1.5ºC AGW at 417ppm.
You mention the "positive feedbacks" and perhaps nigelj @2 should have added that land ice will continue melting away unless global temperatures are reduced, the worry being that Greenland will melt down (taking millennia) with warming somewhere between +1.0ºC & +2.0ºC AGW and with nothing to stop it once its summit drops down to warmer altitudes. And the stability of the West Antarctic ice is potentially even more sensitive to warming.
Specific to being "positive feedbacks" (which melted ice fields are not unless they entirely disappear & so reduce albedo), the melting tundra is also a process which will continue for centuries without a return to a chillier climate. The size of such the feedback from melting tundra will depend on how hot we make it.
Keeping the ice sheets intact and the tundra frozen is one of the more obvious reasons why limiting AGW to +1.5ºC is a sensible policy.
-
nigelj at 09:11 AM on 15 August 2021The new IPCC Report includes – get this, good news
anticorncob6. My understanding from what I've read is if we stop emissions by for example 2050 temperatures will stop increasing quite soon after that, and the the arctic will stop melting fairly quickly, and acting as a positive feedback to warming, provided it hasn't crossed a tipping point where melting has become self reinforcing. This scenario makes sense to me.
It's not certain just when the arctic would cross a tipping point and it may have already. From memory the range is 1-3 degrees c. I could be wrong on all this and maybe someone has better information.
-
Philippe Chantreau at 08:58 AM on 15 August 2021Skeptical Science New Research for Week #32, 2021
This may not fall into the "New Research" category but is nevertheless worthy of mentioning: faced with unprecedented natural disasters having him deal at the same time with massive floods and gigantic fires, even Vladimir Poutin is acknowledgeing the threat of climate change and the urgency of action. It is quite remarkable coming from him, considering that he had consistently dismissed both ideas for decades and that Russian troll factories have worked very hard at influencing public opinion against action, including suspected attacks against SkS.
If the English translation did not cross, I had a translate option just by right clicking on the page.
-
anticorncob6 at 05:39 AM on 15 August 2021The new IPCC Report includes – get this, good news
To stay below the main Paris target of 2°C (3.6°F) warming, global carbon emissions in SSP1-2.6 plateau essentially immediately and begin to decline after 2025 at a modest rate of about 2% per year for the first decade, then accelerating to around 3% per year the next decade, and continuing along a path of consistent year-to-year carbon pollution cuts before reaching zero around 2075. The IPCC concluded that once global carbon emissions reach zero, temperatures will stop rising.
This makes no sense to me. We can still avoid the 2C limit by reducing CO2 emissions by just 2-3% per year? And aren't there positive feedback mechanisms that will cause the world to keep warming after emissions hit zero (e.g., artcic methane release)?
Current emissions are 38 billion metric tons per year. If we integrate (38 * 10^9)*(0.97^x) from x = 0 to x = 55 we get 1 trillion tons of CO2 that will be emitted by 2075, and I haven't seen a carbon budget for two degrees that's anywhere near that big. So a 3% reduction per year wouldn't be nearly enough.
This source here says we have 469 billion metric tons left, and that was written in 2013, meaning that now we only have about 200 billion metric tons left, which at current rates means we will blow the two-degree target in only five years.
www.climatecentral.org/news/ipcc-climate-change-report-contains-grave-carbon-budget-message-16569
Perhaps better data since then might give us a better budget, but could it change by that much?
-
Bob Loblaw at 02:38 AM on 15 August 2021It's Urban Heat Island effect
blaisct:
I have also replied to your post # 66 over on the Albedo Effect where Michael Sweet has responded.
-
Bob Loblaw at 02:35 AM on 15 August 2021It's albedo
Also in response to blaisct's comment #66 posted over on the Urban Heat Island discussion.
Blaisct:
You continue to make poor choices in the numbers and calculations that you are doing. Going over your latest effort by number:
1. You continue to select an albedo for urban areas that is too low for anthropogenic surfaces, and you have failed to cite a reference for your value. In my comment # 64 on the Urban Heat Island discussion, I gave a reference to several artificial surface materials, all with albedo values that exceed the the value you have chosen. "Urban" areas are a mix of things like grass, roads, houses, etc. You would need to calculate how much of the surface is covered by each type, and work out an albedo for an "urban" area that way. If that is what you have done, you need to show your detailed calcuations on how you arrive at the 0.08 value.
2. There are no assumptions in the 0.31 albedo value for the earth as a whole. That is based on satellite measurements, and includes reflection from the surface, clouds, clear atmosphere, etc. Note that the only part of the surface reflection that reaches space is the part that makes it back out through the atmosphere and cloud cover. To calculate this in a model (which is what you are trying to do), you need to account for spatial variations (and daily/seasonal cycles) of solar input, surface albedo, cloud cover, and atmospheric conditions.
3 to 14. You continue to make unreasonable assumptions about the area that is undergoing a surface change, and how it relates to population. There is no reason to think that they are related through a simple proportion.
15 to 20. You continue to make errors in converting solar output (1367 W/m^2 measured perpendicular to the sun's rays) to an areal average over the surface of the earth. As MIchael Sweet points out, there is a factor of 4 involved, not a factor of 2. I also mentioned this in my earlier comment. If you do not understand why this is the case, then it is difficult to see how you can expect to do any useful calculations. You also need to consider seasonal variations in solar radiation distribution and seasonal albedo.
21. Converting radiative forcing to global temperature change involves looking at the top-of-atmosphere changes (what is seen from space), not surface changes alone. To properly incorporate surface changes into a calcuation, you need to use a much more complicated model of climate response to surface albedo changes.
22. You still get a wildy incorrect answer, due to bad data input and bad assumptions.
I have not bothered to follow the link to the Mark Healey document you mention. If that is the source you are getting your incorrect ideas from, then it is not worth bothering. The result you quote (that albedo changes can account for all the obsvered temperature rise) is completely inconsistent with the science.
Over at RealClimate, they have recent posted several articles on the just-released IPCC reports. One of those summarizes 6 key results. In that post, they provide the following graph from the IPCC report, which shows the estimated temperature response due to a variety of factors over the last 100 to 150 years. "Land use reflection and irrigation" is the second-last bar on the right. Note that the calculated effect is minor cooling, not warming.

Michael Sweet's suggestion to read the IPCC reports is a good one. I often suggest that people start with the first 1990 report, as this covers a lot of the basic climate science principles in a manner that is easier to understand for the non-expert. In the 1990 report, they mention the Sagan et al paper I linked to in my first comment. Google Scholar can probably help you fnd a free copy.
https://science.sciencemag.org/content/206/4425/1363.abstract
-
michael sweet at 01:08 AM on 15 August 2021It's Urban Heat Island effect
blaisct:
I have replied to you here, which is a more suitable thread to continue discussion.
-
michael sweet at 01:05 AM on 15 August 2021It's albedo
blaisct:
From here: It is generally a waste of time to do your own calculations. The albedo of urban areas cannot have changed more that 50%. The area of urban areas is less than 1% of the Earth's surface. A 50% change in albedo in such a small area cannot have such a large effect.
For starters you need to devide incoming solar radiation by 4 and not 2 to account for day/night and the curvature of the Earth.
Vacant land converted into farmland has significant (possibly greater) changes in abedo than urban areas and is a much greater part of the Earth's surface. The melting of Arctic ice causes a greater change in albedo than the rural/urban change does. We see that reflected in the Arctic increasing in temperature faster than the rest of the Earth. If urban areas caused 30% of the warming they would all be extremely hot during the day. This is not observed. If your calculations were correct than albedo changes would account for all of global warming and that is not what is observed.
If you look in the just released IPCC report you will undoubtedly find a chapter on albedo change. See what the scientists say. An old saying among grad students is "An hour in the library will save you a week in the lab". See what you can find in the IPCC report and come back here to inform us.
-
Philippe Chantreau at 10:16 AM on 14 August 2021Skeptical Science New Research for Week #32, 2021
Don't know if this has been mentioned but it would deserve a mention in the Climate Change Economics section: a survey of academics, professionals, regulators and policy economists reveals that there is a widely shared opinion that risks are grossly underestimated:
https://www.nber.org/papers/w29136?utm_campaign=ntwh&utm_medium=email&utm_source=ntwg23
-
ilfark2 at 02:32 AM on 14 August 2021Key takeaways from the new IPCC report
This assumes we don't get widespread ocean stratification and a die off of the marine photosythesizers... which I assume Archer et. al. could not factor into their models.
This, e.g.,
https://www.nature.com/articles/s41558-020-00955-x?
from the abstract (pay blocked), seems to indicate models are sea surface temperature dependent.
Thanks for your explanations, they are very helpful.
-
blaisct at 01:01 AM on 14 August 2021It's Urban Heat Island effect
Thanks All for the input. You are increasing my understanding of the albedo effect. I appreciate the articles you mentioned and see that the subject is very complex and calculations like mine are only useful for understanding the simple significance of the many variables and not useful for reaching conclusions or predictions. One general conclusion that seem to come from all the articles and papers is that albedo is most likely significant but there is not agreement on how significant, or the range of each of the variables, or the total interaction of all the albedo variables. I sure hope that the GW experts are improving their models with new NASA satellite data. Does anyone out there know how much of the current GW data (1.1’C) in the IPCC model is accounted for by albedo change?
For entertainment only, I redid the significance of the 0.7% urban of total earth surface what if calculation to include some of the comments.
1. The reported albedo of urban areas is about 0.08 (double the 0.04). (Albedo on a 0.0 to 1.0 scale)
2. The reported total albedo of the earth is about 0.31. (Assume that includes clouds and urban albedo)
3. % of earth that is urban: =0.7%
4. The non-urban area of the earth is: 100%-0.7%= 99.3%
5. The contribution of urban areas to the total albedo is: 0.08 * 0.7% = 0.00056
6. The total non-urban area albedo contribution to the total is: (0.31-0.00056)/ 0.993 = 0.31162
7. Assume the non-urban area albedo in the 1880 era was the same as today: =0.31162
8. Current earth population is about = 7.8 B
9. 1880 era population is about =1.3 B (Using 1880 as the approximate start of IPCC temp data)
10. Assume the 1880 era urban area was proportional to population: = 1.3/7.6*0.7% = 0.12%
11. The 1880 era urban area contribution to total albedo was: 0.07*0.12% = 0.0000933
12. The 1880 era non-urban area contribution to the total albedo was: (1- 0.12%)*0.31162 = 0.311257
13. The 1880 era total albedo estimate is: 0.311257+ 0.0000933 = 0.311351
14. The difference in 1880 vs 2021 albedo is : 0.311351 – 0.31 = 0.00135 (or about 0.14% albedo change)
15. The reported output of the sun reaching the earth is about: 1367 W/m^2
16. Assume that the urban albedo is only seeing one half (balk of urban areas are in the middle half of the earth’s surface) of the above due to the curvature of the earth: 50%
17. Average surface of the earth cloud cover: =67%
18. Average albedo of clouds: = 50%
19. Total sun’s output reaching cloud covered urban areas + non cloud covered urban (corrected for curvature) is : 455 W/m^2.
20. Therefore, this energy of the albedo difference is: 0.00135* 455= 0.61W/m^2
21. I have seen conversion factors for converting this to ‘C in earth temperature rise of 0.5 to 0.7 ‘C/W/m^2. I’ll use the 0.5.
22. The equivalent earth temperature rise of the above albedo change from 1880 to now is: 0.61*.5 = 0.31’CThe IPCC reported temperature rise over the 1880 to now is about 1.1’C. This what if calculation implies that a 0.7% urban area could account about 30% of this temperature rise – not insignificant.
One of the papers (in your previous references) on land use albedo change seems to agree that man-made albedo changes (mainly in agriculture by Mark Healey https://www.scirp.org/pdf/ijg_2020062914563820.pdf) are significant and could account for all the IPCC temperature rise. Mark Healey’s paper suggest that land use changes since 1910 are stronger than the UHI albedo effect.
I am switching over to the “It’s albedo” thread. What are all the possible albedo changes since 1880?Moderator Response:[BL] Link activated.
The web software here does not automatically create links. You can do this when posting a comment by selecting the "insert" tab, selecting the text you want to use for the link, and clicking on the icon that looks like a chain link. Add the URL in the dialog box. -
MA Rodger at 16:44 PM on 13 August 2021Key takeaways from the new IPCC report
ilfark2 @10,
I would not be so definite about the speed of CO2 draw-down as to put a value on it but the 3ppm you give is not unreasonable, but only as the initial value.
If we stopped emitting CO2 tomorrow, with 45% of our emissions now in the atmosphere, perhaps half of that will be drawn down into the oceans. (Note this also involves an additional transfer into the oceans, out from the biosphere which is more advanced along the path to equilibrium.) So +45% of our emissions, or that atmospheric increase of +140ppm, would roughly halve suggesting a drop of 70ppm, back to ~350ppm, this taking some 1,000 years although most would occur through the firat 100 years.
-
jon_zz09 at 07:54 AM on 13 August 2021Volcanoes emit more CO2 than humans
Thanks guys, very helpful. Yes the difference is huge I knew it was for land volcanoes and suspected the ocean activity wasn't significant, great to have the useful sources to confirm, also found the Wong 2019 from above useful.
-
Daniel Bailey at 07:53 AM on 13 August 2021Volcanoes emit more CO2 than humans
Here's what the peer-reviewed published literature shows, that humans produce 100x more CO2 than all Earth's volcanoes combined:
- Just two-one thousandths* of 1% of Earth's total carbon—about 43,500 gigatonnes (Gt)—is above surface in the oceans, on land, and in the atmosphere. The rest is subsurface, including the crust, mantle and core—an estimated 1.85 billion Gt in all.
- CO2 out-gassed to the atmosphere and oceans today from volcanoes and other magmatically active regions is estimated at 280 to 360 million tonnes (0.28 to 0.36 Gt) per year, including that released into the oceans from mid-ocean ridges.
- Humanity’s annual carbon emissions through the burning of fossil fuels and forests, etc., are 40 to 100 times greater than all volcanic emissions.
- Earth’s deep carbon cycle through deep time reveals balanced, long-term stability of atmospheric CO2, punctuated by large disturbances, including immense, catastrophic releases of magma that occurred at least five times in the past 500 million years. During these events, huge volumes of carbon were outgassed, leading to a warmer atmosphere, acidified oceans, and mass extinctions.
- Similarly, a giant meteor impact 66 million years ago, the Chicxulub bolide strike on Mexico’s Yucatan peninsula, released between 425 and 1,400 Gt of CO2, rapidly warmed the planet and coincided with the mass (>75%) extinction of plants and animals—including the dinosaurs. Over the past 100 years, emissions from anthropogenic activities such as burning fossil fuels have been 40 to 100 times greater than our planet’s geologic carbon emissions.
- A shift in the composition of volcanic gases from smelly (akin to burnt matches) sulphur dioxide (SO2) to a gas richer in odorless, colorless CO2 can be sniffed out by monitoring stations or drones to forewarn of an eruption—sometimes hours, sometimes months in advance. Eruption early warning systems with real-time monitoring are moving ahead to exploit the CO2 to SO2 ratio discovery, first recognized with certainty in 2014.
Regarding the release of CO2 from volcanoes:
"Earth’s total annual out-gassing of CO2 via volcanoes and through other geological processes such as the heating of limestone in mountain belts is newly estimated at roughly 300 to 400 million metric tonnes (0.3 to 0.4 Gt).
Volcanoes and volcanic regions alone outgas an estimated 280–360 million tonnes (0.28 to 0.36 Gt) of CO2 per year. This includes the CO2 contribution from active volcanic vents, from the diffuse, widespread release of CO2 through soils, faults, and fractures in volcanic regions, volcanic lakes, and from the mid-ocean ridge system."
https://www.sciencealert.com/humans-produce-100x-more-co2-than-all-volcanoes-combined
https://deepcarbon.net/scientists-quantify-global-volcanic-co2-venting-estimate-total-carbon-earth
http://elementsmagazine.org/past-issues/catastrophic-perturbations-deep-carbon-cycle/Kelemen and Manning 2015 - Reevaluating carbon fluxes in subduction zones, what goes down, mostly comes up
de Moor et al 2016 - Short-period volcanic gas precursors to phreatic eruptions: Insights from Poás Volcano, Costa Rica
McCormick et al 2016 - Observing eruptions of gas-rich, compressible magmas from space
Johansson et al 2018 - The Interplay Between the Eruption and Weathering of Large Igneous Provinces and the Deep‐Time Carbon Cycle
Tamburello et al 2018 - Global-scale control of extensional tectonics on CO2 earth degassing
Lee et al 2019 - A Framework for Understanding Whole-Earth Carbon Cycling
Black and Gibson 2019 - Deep Carbon and the Life Cycle of Large Igneous Provinces
Kamber and Petrus 2019 - The Influence of Large Bolide Impacts on Earth’s Carbon Cycle
"pCO2 is a result of the balance between the rate of CO2 inputs through magmatic/metamorphic degassing and the rates of carbon removal via silicate weathering and organic carbon burial."
McKenzie and Hehe Jiang 2019 - Earth’s Outgassing and Climatic Transitions_The Slow Burn Towards Environmental Catastrophes
Mikhail and Furi 2019 - On the Origins and Evolution of Earth’s Carbon
Schobben et al 2019 - Interpreting the Carbon Isotope Record of Mass Extinctions
Suarez et al 2019 - Earth Catastrophes and Their Impact on the Carbon Cycle
Werner et al 2019 - Carbon Dioxide Emissions from Subaerial Volcanic Regions_Two Decades in Review
"All studies to date of global volcanic carbon dioxide emissions indicate that present-day subaerial and submarine volcanoes release less than a percent of the carbon dioxide released currently by human activities. "
-
scaddenp at 07:32 AM on 13 August 2021Volcanoes emit more CO2 than humans
jon_zz09 - the killer for that argument is the volcanic CO2 has very different C isotopic signature to that fossil fuels. The changes in atmospheric C isotopic composition are consistant with FF source. Furthermore, the studies referenced in this article (and see more here) account for submarine volcanoes. While estimation is difficult even the high end of the estimates is small compared to FF emissions. Finally, there is no evidence of an increase in volcanism as Rob says ( see here from Global Volcanism Program).
-
ilfark2 at 07:21 AM on 13 August 2021Key takeaways from the new IPCC report
So we would expect to see something like a 3 ppm decrease per year to start and dimish over time upon 0 emissions. So if we wanted to get back to 300 ppm, it would take about 40 years at 0 emissions. So that would be another 40 years over the pre-Human climate equilibrium... though Archer et. al.'s models show we wouldn't get back down to 300 anyway.
This is assuming the Earth sinks continue to behave the way they have.
Is that what they are saying?
Thanks.
-
Rob Honeycutt at 05:43 AM on 13 August 2021Volcanoes emit more CO2 than humans
jon_zz09... My understanding is that, any CO2 emitted from underwater volcanoes would be dissolved before reaching the surface. That could be a complicating factor for ocean acidification, but it does nothing to explain the rapid rise in atmospheric concentrations starting with the industrial revolution.
-
MA Rodger at 05:12 AM on 13 August 2021Key takeaways from the new IPCC report
ilfark2 @8,
The usual work that sets the scene for the fate of our CO2 emissions is that of David Archer (eg Archer et al (2009) 'Atmospheric Lifetime of Fossil Fuel Carbon Dioxide' Fig 1b from the paper is pasted below.) Such work tends to involve the modelling of a big impulse of CO2 rather than the 'slow' release over decades we are managing at the present.
This graphic shows that 30% of a very big release of CO2 is still in the atmosphere millennia after its release. Fig1a (which I can't see on-line to post here) models a 1,000Pg release which is closer to what we humans will likely manage (So far we have managed 700Pg.) and suggests the final CO2 level would consist of 20% our total emissions.

The situation with our present emissions is that annually the rise in CO2 levels equates to about 45% of our annual emissions, this referred to as the Airborne Fraction. Thus annually we are emitting roughly 36Gt(CO2) = 10Gt(C), and seeing an atmospheric increase of some 2.4ppm or [2.4 x 2.13 =] 5.1Gt(C) or [x 3.664 =] 18.7Gt(CO2).
However the 55% that is thus being swepted from the atmosphere into oceans and the biosphere should not be seen as 55% of our annual emissions but as a smaller fraction of the accumulative emissions over past decades.
And because that is 55% of past emissions (which all our emissions will become when we stop emitting), that draw-down will continue although slowly diminishing with time. This reduction in atmospheric CO2 will thus reduce the climate forcing from AGW and counteract the 'in-the-pipeline' warming from the planetary energy imbalance. So warming will quickly stop. I don't think there is much reversal of warming, your "stabilize at a lower temperature."
I am a little surprised to read the comment in recent web articles suggesting this reasonably quick end to warming following a termination of CO2 emissions is somehow new learning. It has been well understood for many years now. What perhaps has prevented the communication of this knowledge is the absence the political will to enact such a cut in emissions. Thus the gradual reduction over several decades was what the science modelled, not a sudden zeroing of our emissions.
-
jon_zz09 at 03:55 AM on 13 August 2021Volcanoes emit more CO2 than humans
Someone I was debating on twitter (I know not a good idea) claims that quote "Out gassing via leakage and fumaroles under the ocean floors and from "quiet" volcanoes and thousands of miles of mid oceanridge" is a significant contribution to CO2 emissions. I'm v.skeptical of this and wondered if anyone else had heard this or had recent estimates for global ocean floor out-gassing from ridges, ocean volcanos and fumaroles. I suspect he is missing geological CO2 sinks
-
ilfark2 at 01:57 AM on 13 August 2021Key takeaways from the new IPCC report
Bob Loblaw
I'm referring to:
https://www.carbonbrief.org/explainer-will-global-warming-stop-as-soon-as-net-zero-emissions-are-reached
which references studies that suggest at zero emissions, CO2 concentrations would fall quite quickly. Michael Mann was on the Sunday shows (in the US) last week mentioning this. IPCC scientists on Democracy Now also referenced this.
In the above linked article, they say about half of human emissions are absorbed by the earth system. Seems if that were the case, CO2 concentration would be going up faster than 2ppm per year (since, my understanding is it takes about 2 gt of CO2 to raise the global concentration by 1 ppm). I.e., the earth must be absorbing significantly more than half.
I'm wondering if I understand the argument.
It seems Mann and others are suggesting the atmosphere and earth (water and land) are out of equilibrium. If we stop (or drastically cut as he suggests) emissions, atmospheric concentration of CO2 will drop quite quickly and we'll stabilize at a lower temperature quite quickly.
Though he points to models, it seems a better proof is that 40 gt of CO2 should raise the global concentration by 20 ppm not 2, so the earth is still absorbing a lot of CO2. Even accounting for mixing time, since we've been doing over 20 gt for years now, one would expect larger gains than 1 to 2 ppm per year.
-
Postkey at 20:19 PM on 12 August 2021Key takeaways from the new IPCC report
'The conventional wisdom among climate scientists has long been that if we stopped all carbon emissions today, the climate would continue to warm for decades or even centuries. . . . “It is our best understanding that, if we bring down CO2 to net zero, the warming will level off. The climate will stabilize within a decade or two,” Rogelj told Berwyn. “There will be very little to no additional warming. Our best estimate is zero.” He adds the notion that decades or even centuries of additional warming are already baked into the system as suggested by previous IPCC reports was based on an “unfortunate misunderstanding of experiments done with climate models that never assumed zero emissions.”
cleantechnica.com/2021/01/04/net-zero-emissions-stabilize-climate-quickly-uk-scientist/Moderator Response:[BL] Despite repeated warnings, you continue to post short quotes of material without discussion of context or applicability.
If you actually have reference to studies that support the position you claim, please post that information, rather than just short quotes from someone that claims such studies exist.
Warning #2
Please note that posting comments here at SkS is a privilege, not a right. This privilege can and will be rescinded if the posting individual continues to treat adherence to the Comments Policy as optional, rather than the mandatory condition of participating in this online forum.
Moderating this site is a tiresome chore, particularly when commentators repeatedly submit offensive or off-topic posts. We really appreciate people's cooperation in abiding by the Comments Policy, which is largely responsible for the quality of this site.
Finally, please understand that moderation policies are not open for discussion. If you find yourself incapable of abiding by these common set of rules that everyone else observes, then a change of venues is in the offing.Please take the time to review the policy and ensure future comments are in full compliance with it. Thanks for your understanding and compliance in this matter.
-
Ed Evans at 19:59 PM on 12 August 2021Net Zero by 2050
I'm 74, married 52 years, and have no children. If I did have children, I would be outraged that we are settling on a 2050 zero-carbon date. We must do better for Greta's generation.
-
Bob Loblaw at 07:04 AM on 12 August 2021Key takeaways from the new IPCC report
ilfark2:
I'm not quite sure what you are asking.
In the graphs above, SSP1-1.9 represents a case where we stop emitting CO2 and get net emissions to zero by 2050. In such a scenario, atmospheric CO2 stops rising - and then over long periods (centuries) will gradually decline. We will still be faced with a world where atmospheric CO2 is above current values.The earth will not quickly absorb the CO2 that is in the atmosphere.
Temperatures will continue to rise for a while, but wll eventually stabilize - at a temperature warmer than today.
There will not be a return to pre-industrial climates (CO2 levels or temperatures) through natural processes at any time in our lifetimes (or for generations to come).
RealClimate has a graph from the SPM, originating from a 2018 IPCC report that shows the temperature ranges expected from scenarios of CO2 levels similar to the graph presented above. It bsaically shows that if we stop adding CO2, we stop warming (with delays), but it's not related to a reduction in atmospheric CO2.

-
wilddouglascounty at 02:26 AM on 12 August 2021Key takeaways from the new IPCC report
Tristan (1.2), I hope you, like me, see the reduction of atmospheric particulates as a net plus due to reductions in health effects, acid rain and other deleterious effects of particulates in general, SO2 in particular. Any net increase in warming from decarbonizing the economy and clearing particulates from the atmosphere can be offset by other measures that do not include injecting particulates back into the air.
-
ilfark2 at 02:23 AM on 12 August 2021Key takeaways from the new IPCC report
It seems the report says that if emissions are cut, temperatures will stabilize in the next 10 or 20 years.
Is this based on the earth absorbing most (currently, roughly 36 of 40 gt?) emissions?
Thanks.
-
Thinking Is Power at 06:07 AM on 11 August 202111 Characteristics of Pseudoscience
Thanks for the comment! I will admit I'm partial to technobabble, simply because it can be rather humorous. But to your point, I've noticed my students easily confuse technobabble with real scientific termonology that they don't understand. By definition technobabble is used to confuse people into thinking it says something profound when it's essentially meaningless. I like your solution, though, as it puts the burden back on the "babbler" to explain what it means.
-
Bob Loblaw at 01:52 AM on 11 August 202111 Characteristics of Pseudoscience
A good list of things to look for.
I note that more than once the phrases "good ideas" and "bad ideas" are compared. Of course, scientists know that this does not mean some sort of moral "good vs. evil" statement.
In science, "good ideas" are ones that allow us to make more accurate predictions of how things behave. "Bad ideas" are ones that fail to provide any improvement in our understanding or ability to anticipate what will happen. That's where testing comes in, and then revising our thinking when observations show that the "idea" wasn't helping.
Occam's razor argues that "entities should not be multiplied beyond necessity". Technobabble falls into the category of using sciency terms "beyond necessity" - making things sound impressive when really the ideas are not.
Is the technobabble designed to baffle you, or provide an accurate description? Properly-used technical terms help a speaker or writer be very specific about what they are saying - as long as the listener or reader knows what the terms mean. As part of a dialog, a speaker should be willing to explain unknown terms if they are speaking scientifically, If they don't - or can't - then it is more likely to be pseudo-science. I can't count the number of times in my life when someone has done the "oh, it's too hard to explain" to cover up the fact that they just don't know.
-
Bob Loblaw at 00:48 AM on 11 August 2021In 1982, Exxon accurately predicted global warming
XKCD has an interesting cartoon on the "what Exxon predicted in 1982" story:

-
MA Rodger at 00:35 AM on 11 August 2021Key takeaways from the new IPCC report
Tristan @1,
Quoting CarbonBrief coverage, "The AR6 report dedicates a whole chapter to “short-lived climate forcers” (SLCFs). These include aerosols – such sulphates, nitrates, dust and sea spray that are also known as “particulate matter” – as well as “chemically reactive gases,” including methane, ozone, nitrogen oxides and carbon monoxide. “In most cases,” they are also air pollutants, according to the report."
The Technical Summary p68 says "The net effect of SLFC and HFC changes in global surface temperature across the SSPs is a likely warming of 0.06°C–0.35°C in 2040 relative to 2019."
I haven't yet attempted to access the full report.
-
Tristan at 00:27 AM on 11 August 2021Key takeaways from the new IPCC report
Found it. Looks like the aggressive emission reductions are expected to include 0.2c of warming by 2050 due to aerosol reduction.
-
Tristan at 00:05 AM on 11 August 2021Key takeaways from the new IPCC report
I'm trying to download the report - does it estimate the amount of warming due to the reduction of SO2 in the atmosphere as a result of decarbonising the economy?
-
michael sweet at 22:26 PM on 10 August 2021Is Nuclear Energy the Answer?
John ONeill:
I do not think that you will convince anyone to support widespread building of nuclear power by arguing about how many people were killed by the accidents at Chernobyl and Fukushima. Everyone knows that if you spread the damage around to enough people it becomes statistically impossible to detect how many people you have killed. That does not mean no-one was killed like James Conca claims. I have provided documention for 27,000 killed at Chernobyl and 1600 at Fukushima.
Abbott 2012 does not mention this issue besides pointing out that with the 15,000 reactors needed to provide All Energy to the world you would expect one major accident every month worldwide. I suggest that you stop wasting our time and move on to another point that Abbott makes that is more important.
Nuclear power is too expensive, enough rare materials (like uranium) do not exist to build out a significant number of nuclear plants and the plants take too long to build to significantly affect the problem before 2050.
-
John ONeill at 17:48 PM on 10 August 2021Is Nuclear Energy the Answer?
I'm still waiting for an emailed copy of the Beyea, Sovacool, von Hippel paper which raises Jacobson et al's 125 deaths ( 15 to 1100) to more likely 1000. Papers from Sweden and Finland did not find a significant effect from Chernobyl-
'Sweden received about 5 % of the total release of 137Cs from the Chernobyl nuclear power plant accident in 1986. The distribution of the fallout mainly affected northern Sweden, where some parts of the population could have received an estimated annual effective dose of 1–2 mSv per year...a possible exposure–response pattern between deposition of 137Cs and cancer incidence after the Chernobyl nuclear power plant accident was investigated in the nine northernmost counties of Sweden (2.2 million inhabitants in 1986)... In conclusion, using both high quality cancer registry data and high resolution exposure maps of 137Cs deposition, it was not possible to distinguish an effect of 137Cs on cancer incidence after the Chernobyl nuclear power plant accident in Sweden.'
'We analyzed the relation of the estimated external radiation exposure from the fallout to cancer incidence in Finland in 1988-2007. The study cohort comprised all ∼ 3.8 million Finns who had lived in the same dwelling for 12 months following the accident (May 1986-April 1987). Radiation exposure was estimated using data from an extensive mobile dose rate survey. Cancer incidence data were obtained for the cohort divided into four exposure categories (the lowest with the first-year committed dose
In any case, even granting 1000 deaths worldwide from Fukushima, that was the only major nuclear accident in thirty years, Increased deaths just in Germany, from coal pollution increases after the closure of nine reactors, has been estimated at 1100 people every year. Figures for Japan, where fifty reactors were shut down, and largely replaced with coal, are probably much higher. That's not even considering climate change deaths.
https://www.ncbi.nlm.nih.gov/pmc/articles/PMC4102770/
https://pubmed.ncbi.nlm.nih.gov/24135935/
https://www.nber.org/system/files/working_papers/w26598/w26598.pdf
Moderator Response:[BL] Badly formatted links fixed and activated. If you want people to follow links, please take the time to insert them correctly.
The web software here does not automatically create links. You can do this when posting a comment by selecting the "insert" tab, selecting the text you want to use for the link, and clicking on the icon that looks like a chain link. Add the URL in the dialog box.
-
michael sweet at 21:32 PM on 9 August 20212021 SkS Weekly Climate Change & Global Warming News Roundup #31
This First Dog on the Moon cartoon would look good on Skeptical Science.
(Sorry, I could not get the cartoon to copy to post it here)
-
michael sweet at 11:19 AM on 9 August 2021What’s the carbon footprint of a wind turbine?
David-Acct:
The problem here is that your question is completely incorrect. When several wind farms in Texas are generating power there are wind forecasts for the future wind and the amount of power that will be generated. These are for a variety of times from 5 minute forcasts to one hour, 6 hours, 24 hours and longer. The power output from the farms is relatively constant over short time periods, say 5 minutes, and slowly changes over longer periods. Thus grid operators do not need to run "constant backup generation to maintain grid stability, even if running at idle." Since they know in advance how much power will be generated by the wind farms, and they have forecasts of electricity usage, they need little extra backup generation.
By contrast, large thermal plants like coal and nuclear plants, often shut down in an instant due to some fault in the plant. Constant backup needs to be run for these plants in case of shut down (nuclear plants have unplanned shut downs about 2 1/2 times per year). For a wind plant they would only lose a singel turbine. In the case of a transmission line failure the back up needed is the same as for thermal plants. Often redundant transmission lines serve to deliver the power with no interruption.
Your question is incorrect. Supporters of fossil fuel have decieved you by feeding you false information. Read about how the Texas grid is currently run and you will see that constant backup generation for all power is not needed. Backup generation for renewable energy is frequently less than that needed for thermal plants.
-
One Planet Only Forever at 08:26 AM on 9 August 2021What’s the carbon footprint of a wind turbine?
David-acct,
The opinion that the comparison being "grams of CO2-eq per kWh" is not a valid and rigorously established value for comparing the alternatives would require the following part of the article to be ignored:
"In fact, this type of analysis constitutes an entire branch of research known as “life cycle assessment,” with its own handbooks, internationally agreed-upon standards, specialized software, and peer-reviewed journals."
Did you read and understand the entire article?
I did. And I would expect that the intermittent production of power would be part of the already developed considerations in the field of life-cycle research. Claiming it is not requires the provision of robust evidence, not the simple statement of an opinion and believing all opinions are equally valid.
I also feel obliged to respond to "As such, there has to be constant backup generation to maintain grid stability, even if running at idle." Power delivery into the grid is constantly "brought on line" and "taken off line" to keep the grid reasonably balanced between demand and supply. And there are grids running entirely without fossil fuels. So the intermittent delivery of some renewable power generation is already able to be managed. Batteries and pumped hydro are just 2 ways to do this that come to mind. A person not being aware of that indicates a person with a large opportunity to learn.
btw, I am just a Canadian trained civil/structural engineer with an MBA. But in Canada all engineers are required to have a basic understanding of all fields of engineering. But I constantly pursued learning more about all the fields and many things outside of engineering and business. Learning about climate science is only a hobby of mine. But I am also concerned technically and economically because the increased uncertainties of future conditions because of rapid climate change challenge civil and structural engineering designs and long-term business decisions.
-
Bob Loblaw at 01:42 AM on 9 August 2021Models are unreliable
To follow-up again on MA Rodger's excellent description, two things to note:
- Satellite data are not a measurement of atmospheric temperature. Satellites measure radiation. To transform the radiation data into an estimate of temperature requires some sort of model. A detailed atmospheric radiation transfer model. To call the results "observations" is playing loose with the term, although it is a common use of the term.
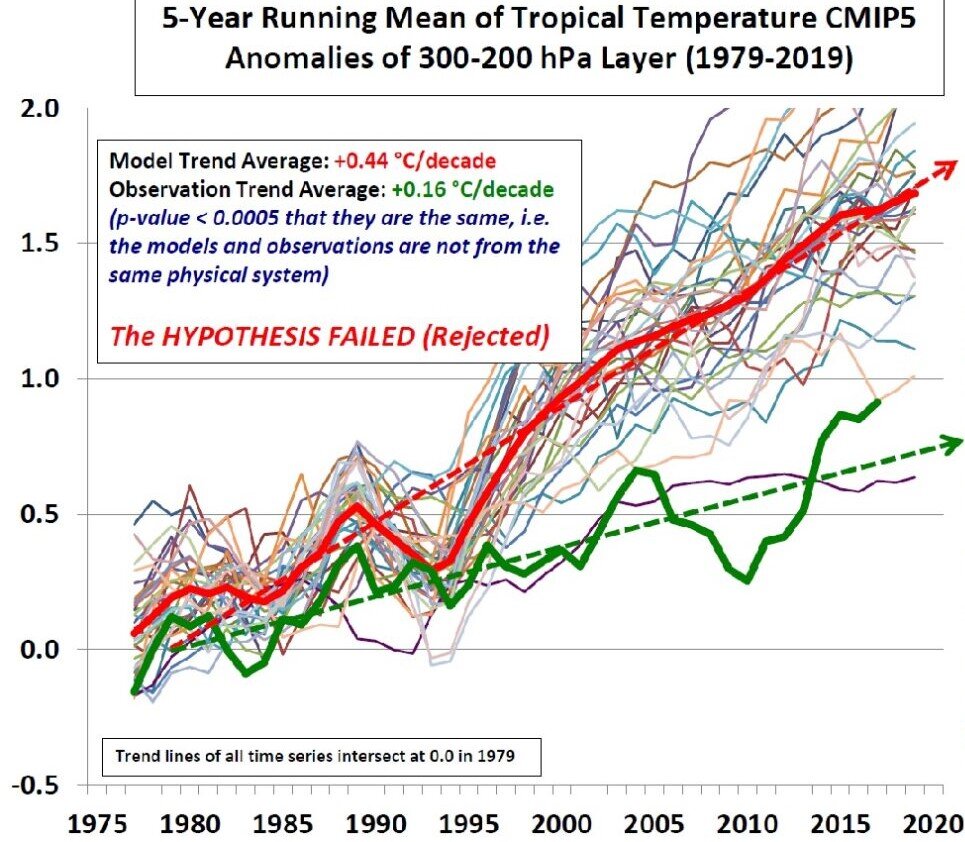
- In the last diagram that MA Rodger provides, note the expression "the models and observations are not from the same physical system". As MAR notes, the results from the climate models are an average of the entire atmosphere from the surface to 70,000 feet (>20km). The "observations" (Christy's model conversion of the satellite data) cover the pressure range from 300 to 200 hPa, which is roughly from 30-40,000 feet (9km to 12 km). That the two are "not from the same physcial system" is known prior to doing any statistical analysis.
Christy's "analysis" takes two things that are known to be different, and tries to make it look like the difference disproves some aspect of climate theory.
-
MA Rodger at 00:25 AM on 9 August 2021Models are unreliable
sailingfree @1294,
You ask "Did Christy use model predictions for the bulk atmosphere?"
He says he does.
It is not easy to be sure what Christy "uses" as he is not a reliable researcher. In specific cases it would/should be possible to see what he says he is "using" and then compare the numbers he "used" with what he says. But this is not always a trivial task and Christy's public statements are not considered of the slightest scientific importance by those best positioned for this task. So they mainly ignore them. But note the issue of modelled tropical tropospheric temperatures (which is real) is being addressed with, for example Vergados et al (2021) or Po-Chedley et al (2021).
You mention @1292 the "102 model runs", so a specific case of data use (although Christy happily reuses his grand finding oblivious to any errors it contains). The prime-time appearance of "102 model runs" was presumably Christy's testimony to the U.S. House Committee on Science, Space & Technology 2 Feb 2016 and in this case Christy's use of data has been questioned more than once but this is technical enough for even climatologists to trip over this task (as the correction within yet another RealClimate posting illustrates). What is perhaps most telling in this situation is the silence of John H Christy who thus acts more like a troll than a proper scientist who would be expected to defend his position by resolving any doubt on the matter.
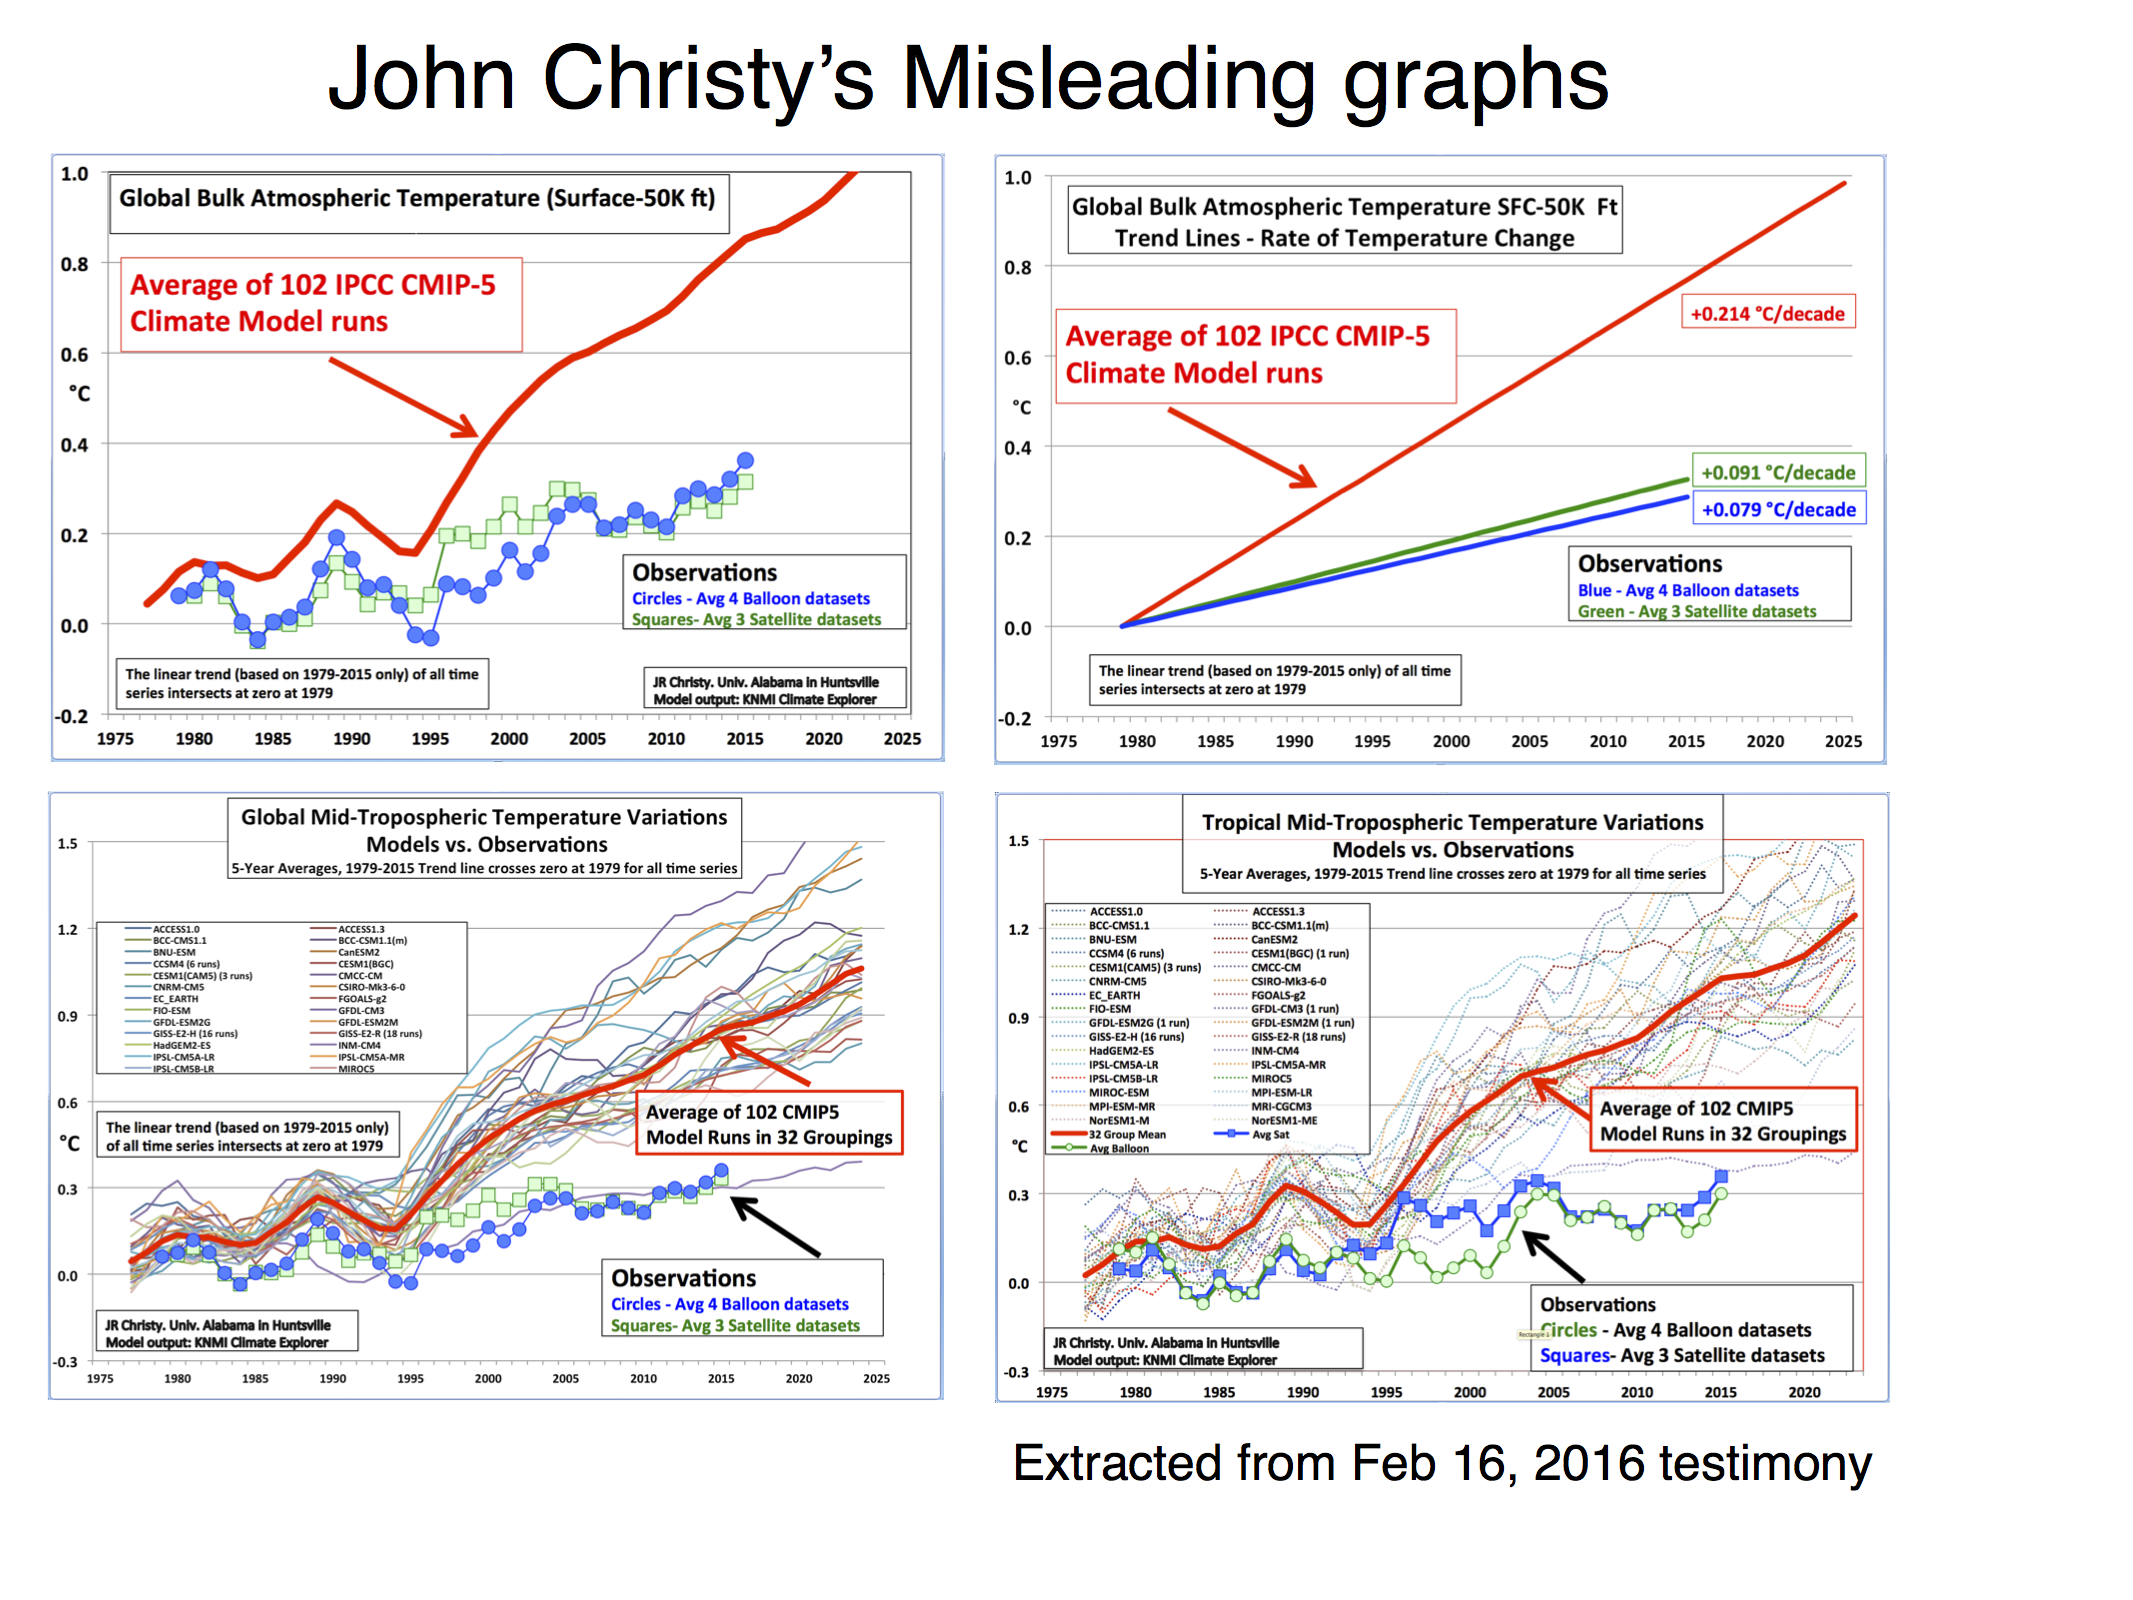
So on these graphics we see John Christy saying he uses "Global Bulk Atmospheric Temperature, Surface to 50,000ft" and also 'Global' and 'Tropical' "TMT Temperature Variations" (which actually go a bit higher than 50,000ft). The TMT satellite data is a statistical sample of emissions from a great swathe of altitudes, even up into the stratosphere where it is cooling due to AGW.
 The RSS browser tool with the correct choice of 'Channel' and 'Region' shows a TMT Tropical trend of +0.145ºC/decade. This compares with the UAH TMT Tropical trend of +0.09ºC/decade. Christy's assessment of model data puts the comparable model trend at +0.214ºC/decade although the model assessment presented by the RealClimate critique linked above gives a model trend of +0.19ºC/decade.
This +0.214ºC/+0.19ºC isn't a massive difference but this and the visual trickery employed by Christy has resulted in a film (actually a 7 minute YouTube video).
Christy latest wheeze is to brandish yet another fun-with-figures graphic (below) which compares TMT data (measured from surface up to 70,000ft with differing strength) with a small layer of the modelled atmosphere (roughly from 30,000ft to 40,000 ft). Presumably this is because the denialists require redder meat with the passing years.
-
David-acct at 00:22 AM on 9 August 2021What’s the carbon footprint of a wind turbine?
The analysis is limited to only incremental grams per mwh from each source. Wol makes a valid point with Kw per hour. As is well known, renewables while the incremental cost of less than fossil fuels, they remain intermittent. As such, there has to be constant backup generation to maintain grid stability, even if running at idle. In order to make a valid comparison, it should include to the back up generation.
-
Bob Loblaw at 23:48 PM on 8 August 2021Models are unreliable
sailingfree:
To add to what MA Rodger said about climate models, analyzing the output from a three-dimensional general circulation model is about as complex as analyzing climate observations - maybe even more so.
Think about the number of locations world-wide where we have measurements of surface temperature, humidity, wind speed, precipitation, radiation, etc. Then add in upper air, oceanic, ground temperature opservations, etc.
Then think about how sparse some of those observations are - how much of the globe is not well-measured.
Then think about things that are not routinely measured - vertical motions, cloud water content, spectral (wavelength-dependent) radiation. The list goes on.
...and then realize that a 3-d climate model is calculating all those things on an ongoing basis (minute by minute, hour by hour), at a 3-d set of points covering the entire globe.
Comparing the model to observations can be done where the two types of data match, and commonly involves some sort of statistical summary (of both the model output and the real-world measurements).
I don't know what Christy means by "bulk atmosphere". My guess would be that he is averaging over the entire vertical profile, but I consider Christy to be such an unrelaible source that I don't want to spend valuable time trying to figure out what he means.
Prev 92 93 94 95 96 97 98 99 100 101 102 103 104 105 106 107 Next


