


 Arguments


Recent Comments
Prev 95 96 97 98 99 100 101 102 103 104 105 106 107 108 109 110 Next
Comments 5101 to 5150:
-
blaisct at 06:35 AM on 20 July 2021The Albedo Effect and Global Warming
Reading about resent NASA satellite data on finding increase heat loss to space makes me wonder how this increase in heat loss is consistent with the Radiative Forcing theory of the IPCC. My understanding of that theory is that as atmospheric CO2 increase it hold in more heat and makes the surface temperature hotter like a blanket effect while the heat loss to space remains the same. The NASA data does not seem to support the Radiative Forcing theory or I must not understand the Radiative Forcing theory. Where is the extra heat coming from?
Also reading about the “heat island” effect from big cities (up to 15’F difference between urban and suburban) makes me wonder could this be related to the NASA data on heat loss? Has population gotten big enough to have an impact on global warming? The “heat island” effect is caused by the much lower albedo (reported as 0.04, cloud free) of urban areas vs the earth as a whole (reported at 0.31). Using IPCC data one can calculate that an albedo change of only 0.15% (+1’C) is needed to account for all of the temperature change from 1880 until now. (that is a hard to detect 0.001%/year). While we are waiting on that detection level we can use related data to estimate man-made albedo change like population or atmospheric CO2.
The earth’s urban area is reported at 3.1% of the total area of the earth. The urban area back in 1880 (start of IPCC global warming data) is estimated at 0.7% (proportional to population) over 4X change. In 1880’s the “heat island” albedo effect was probably insignificant plus there was not many black parking lots or paved roads. The IPCC reports a 1’C rise in temperature since 1880. Using published information one can calculate the heat rise of the current 3.1% urban area at 4’C rise (since 1880) in earth temperate just from the urban area albedo change. (Using IPCC data of sun’s radiation to the earth at 1367w/m^2 and surface temperature rise correlation of 0.5 ‘C/w/m^2). The calculated 4’C rise is more heat than necessary to account for the 1’C observed this is probably due the reflective increase in clouds (water evaporation that eventually become clouds and reflects sun light) that would come with more heat from urban area. This overly simplified estimate of the man-made albedo effect suggests a more scientific version of albedo change should be included in any global warming model or theory. As the population of the earth gets bigger and urban areas grow this effect will get bigger. There are also other man-made albedo effects (destruction of rain forest, forest fires, melting of sea ice, and agricultural practices) which would be proportional to their % of the earth’s surface and their individual albedos.
The earth’s population should be a good indicator of urban area increase and thus man-made albedo change. Atmospheric CO2 is also corelated to population should also be a good indicator of urban area increase (albedo decrease). Are CO2 and albedo confounded in their correlation to global warming? Which force is bigger? The above calculation suggest albedo. NASA's ongoing map of the earth's cloud free albedo should be a big help in including albedo in global warming models, initial results seem to support the above.Moderator Response:[BL] Please learn to format your comments for readability.
Much of your comment is off-topic for this thread.
It does not look like you have improved your understanding of the physics of climate change since your last post here over two years ago.
In your first paragraph, you are correct in saying "I must not understand the Radiative Forcing theory." The fundamental aspect of greenhouse warming of the atmosphere is that adding CO2 reduces the IR loss to space and increases the blanket effect - until the system heats up to restore the balance. Once balance is restored, IR loss will equal solar absorbed - but that may be at different values due to albedo feedback effects.
For discussion of the urban heat island - how it works, how it relates to our measurements of temperature trends, please go to this thread. Hint: it's not just albedo effects.
https://skepticalscience.com/urban-heat-island-effect.htm
In order to avoid off-topic posts, please take the time to review the Comments Policy and ensure future comments are in full compliance with it. Thanks for your understanding and compliance in this matter.
-
Jds at 06:07 AM on 20 July 2021Human CO2 is a tiny % of CO2 emissions
1. More testing for temp & c02 happens in or close to rural areas. Common sense logic. I need no link to prove. Why would you?
2. Saying the ocean increase of 8 inches since 1800's? When was the last time you saw vast amounts of brilliant scientists up & down the coastlines with yardsticks or God help me dipsticks measuring the lines as the ocean ebbs and wanes a great amount of times more than eight inches many times within decades yrs mnths wks days hrs mins? Maybe the guys back in the 1800's were comparing satellite images to determine the beginning rises? I do not need a link to prove this is b.s. Nor should you.
3. C02 gauges determining 400 parts out of 1,000,000 are c02? Fancy thermometer you have there & that is all it is. Electrochemical sensors? Did they count the atoms? Did they feel them? Smell them? Sorry el ch sensors only are in c0 detectors. C0 is even lower ppm than c02. C02 detects by measurements of laser intensity. Fancy thermometer. & Considering C02 can only possibly take up .05 to 5% of a given area that would mean variant temp detect would need be within those ranges as well. & Typal it would take the area of 3 average adults to have required amount of oxygen atoms needed to bond with carbon for such a reading of 400 ppm? Fancy thermometer. And this junk measures the laser intensity (pressure on the silicone chip... yes that's all.) in order to assume raises in c02 due temp rises? Fancy. Like if you had a concealed area void of all carbon oxygen etc and you lit a match to it the inner temp would not raise because only c02 can raise a temp! I do not need a link to prove this as quakery nor should you.
4. Global warming causes tsunamis? Do they mean the consistent average of 2 a yr which has never shown an increase as far as I know to 3 is & has been caused by humans? I do not need a link. Suddenly I am hungry for sausage though. How about you?
5. If .04 % of atmosphere is c02 & of that .04 we contribute .0016 of it that means we are changing approximate .00005 of atmo. An alien bug shifted a cosmic wind storm with a furt... seriously it did! But .00005% of your outhouse wallscovered in pink panther fiberglass... your still gonna shiver during snowy winter outdoor poo runs. Suddenly I no longer feel like sausage. Do you?
6. 2 degrees!!!! Omgomgomg! Over 200 yrs! Imagine if that happened in a minute? It does. & Within an hour day week month season decade century Millennium four score seven years etc. I even heard it goes up & down by higher than 2° in those time increments! Could you imagine waking up one morning and it was like 10°!!! This is why Eskimos don't visit Africa... they would melt. Animals, especially humans cannot adapt to extreme 2°+ changes... impossible... especially if they happen over decades... trust me that's what common sense scientists say. I'm trying to make a segue with Abe right now but politics are not allowed here. Shoulda txt 5 score & 8 yrs. Nor should you... sorry just trying to stick to a format here.
7. It's been millions of yrs since the earth has been this hot or had this much c02 & man was not even in existence back then which proves man did it! So who did it? Wooly mammoths? Hairy hippos? It's like saying your great grandmother to the ten millionth power got pregnant which prove the guy dating your daughter will not where a condom. Yeah I know... poor link. Norse soot dew.
8. 8% of our c02 production is what we breathe out. Gw alarmists should put a bag over there heads to help us get to the 0% c02 in the air which is what they want so that all plant life can die followed by all other life but at least surfers will not wipe out when a hundred ft high wave crashes upon them. Annette Fettuccine. Ignore her doo.
9. Animals breathe too... little effers. Get over here fido. It's time I introduced you to Mr. Gallon size ziplock. I'll leave the pasta in there so you can have a last meal. Dogs don't know it's not seven degrees hotter for Kevin bacon... nor does he.
10. You would think that after all this blaming mankind for every catastrophic thing that happens in nature from the monsoons to the tidal waves to rats overrunning Portugal the one's hitting the near end panic buttons with all their summits & committees & conferences & picnic BBQs & gov funding & YouTube funny cat video empirical research would come up with a way to significantly bring the average gt down by at least half a degree of our controllable portion so we could have only one & one half the amount of disasters. Like one and one half of a Suzuki.
The moral of the story.
Spending time preparing for the unavoidable will save more lives than attempting to eliminate mankind's effects toward the consequences of a chaotic nature. Therefore gw are murderers by way of their ignorance. It is like they are watching a man beat child while attempting to prove a too many carbohydrates will make man beat child... now if we can just keep Frankie Avalon from the spaghetti we might save a child from abuse!
Moderator Response:[BL] Long, mostly off-topic Gish Gallop snipped.
To our usual commenters: please refrain from responding to this until we have had the time to check if this particular user is another sock puppet of a previously-banned user.
[BL] July 20 moderation update. Although this user does not appear to be a previously-banned user, the behavior so far violates several aspects of the comments policy - especially with respect to staying on topic.
All comments must be on topic. Comments are on topic if they draw attention to possible errors of fact or interpretation in the main article, or if they discuss the immediate implications of the facts discussed in the main article. However, general discussions of Global Warming not explicitly related to the details of the main article are always off topic.
Warning
Please note that posting comments here at SkS is a privilege, not a right. This privilege can and will be rescinded if the posting individual continues to treat adherence to the Comments Policy as optional, rather than the mandatory condition of participating in this online forum.
Moderating this site is a tiresome chore, particularly when commentators repeatedly submit offensive or off-topic posts. We really appreciate people's cooperation in abiding by the Comments Policy, which is largely responsible for the quality of this site.
Finally, please understand that moderation policies are not open for discussion. If you find yourself incapable of abiding by these common set of rules that everyone else observes, then a change of venues is in the offing.Please take the time to review the policy and ensure future comments are in full compliance with it. Thanks for your understanding and compliance in this matter.
-
Bob Loblaw at 03:59 AM on 19 July 2021Analysts dissect historic Pacific Northwest ‘heat dome’
As usual, if you want it done right, ask Tamino. He has a new blog up on the recent NW US heat wave, and the very first graph illustrates the point I was making in comment #11.
https://tamino.wordpress.com/2021/07/16/northwest-heat-wave/
Bringing in the graph:

-
MA Rodger at 01:16 AM on 19 July 2021It's not bad
TVC15 @351,
To throw in my own ten pen'orth.
If anyone says “those disasters are here and now already,” it's a bit of an end to the discussion. I think your intended message is that the "disasters" are starting to happen. But as the analogy set out by Bob Loblaw @353 runs "if we can't stop the car before it hits the wall, slowing it down helps." So we are seeing disasters. We are in the process of hitting the wall. It is a very slow process. Things will get a lot worse before we come to a stop. But as we crash into the wall, it will help greatly if we take our foot off the accelerator and slam harder onto the brake.As for where we will end up, as Eclectic @352 says, the idea that humanity could drive itself to extinction through AGW is not on the cards.
If we fail to wean ourselves off FF where will we be? As michael sweet @354 suggests we are seemingly weaning ourselves off coal. That is significant. The +4ºC-and-higher 'outcomes' turn to +3ºC 'outcomes' (and higher) if we stop burning coal. I add the 'and higher' as +3ºC 'outcomes' also greatly increase the uncertainty relative to +2ºC 'outcomes'. Yet even +2ºC 'outcomes' will have bad consequences such as the melt-down of Greenland if we stay at +2ºC for too long. So we shouldn't lose the limit of +1.5ºC if we don't want 7m SLR in the next millennia or so.
And if we fail to buck up our game, still buried within the +3ºC (and higher) is the potential for our nation states to start tussling over real estate and resources and 'devil take the hindmost', thus the breakdown of the civilised world order. How bad a breakdown? There are 193 nation states in the world. So pick a number between 193 and zero.
In terms of climate, I don't think we have reached a point where we cannot with tomorrow's technologies reverse the climate forcings that is causing AGW. But that doesn't mean we reverse all the consequences. If we reverse the climate forcings there will already be irreversable events, certainly within the biosphere. There are thus many 'points of no return' we are creating but the idea of a 'runaway GH-effect' that would turn us into a carbon-copy of Venus; that is not going to happen.
-
michael sweet at 22:11 PM on 18 July 2021It's not bad
Eclectic:
We agree. At one time people complained that gas cars would never replace horses. Once electric cars are established and charging stations are built everywhere everyone will accept them. Then in the future people will wonder why we put up with the air pollution killing so many people for so long.
-
Eclectic at 09:50 AM on 18 July 2021It's not bad
Michael Sweet ~ LOL, in a Mustang maybe : but I wouldn't like to drive the average country road at 150mph in a pick-up truck. The Ford F150 is heavy, but has 4WD electric motors of total 420 horsepower (in lower spec.!!) Not too shabby. The battery has a 9 Kw outlet for portable power tools, or for powering your house during a blackout. Due late 2022, so not far away.
My point is, that many Americans will find this type of electric vehicle attractive. And this will shed a halo glow onto other "electric stuff" . . . and, I hope . . . soften some of the pro-fossil attitudes, and this will spill over into the more political arena.
-
michael sweet at 09:16 AM on 18 July 2021It's not bad
I have a friend who likes muscle cars and owns a high power Mustang. I saw an ad for an electric car that beat a bunch of muscle cars off the line in a drag race. I asked my friend and he said the electric car would beat his car for 1/8 of a mile (by a lot) but that after they got up to 100 mph his car had better acceleration and would win the 1/4 mile. I guess if you want to go 150 on the street (this friend does) you need a more powerfull electric car.
-
Eclectic at 06:20 AM on 18 July 2021It's not bad
Red Baron @394 ,
There's no hope for direct persuasion of the sort of denialist who comes out with the kind of "Models are All Wrong" argument that you mention. The deniosphere is full of that deliberate mental blindness.
But things are hopeful in other directions. Denialists are in some alarm about the current European Union moves to establish (more extensively) what is in effect a Carbon Tax on imports. This must cast a shadow into the future ~ a shadow influencing the investment choices of financiers & large corporations, and tilting their future decisions away from coal etc.
And in the USA, the new Biden Administration - however temporary it may be - must be having a chilling effect on the commercial advocates of future fossil-fuel developments.
Red Baron, your own interest in carbon-fixing (in the soil) does also add the possibility of lowering CO2, by a small but ultimately significant amount. We shall see !
And for the persuadable Middle Americans who like to drive "gas-guzzling pick-up trucks" , it seems the Ford F150 Lightning (due 2022) will have both the traditional looks & the carrying/hauling capabilities they fancy. An all-battery truck, with adequate range and muscular performance ~ quite a breath-taking acceleration, in fact. Forget the wimpy Prius and nerdy Tesla cars, because this "truck" will soften the gasoline addiction of even the average red-blooded right-winger.
-
RedBaron at 12:45 PM on 17 July 2021It's not bad
@393
Michael,
That's a very good point. I recently heard a denialist argument talking about how the models were wrong. The interesting thing about his argument was he used the "worst case do nothing" projection and then tried to claim, "See? The models were exagerated!"
Ironically the reason we are no longer on that old worst case scenario projection is because actions were taken! When the proper scenanio was selected and projected, the models proved to be almost uncannily accurate!
"it's not that bad." only because we are making the changes needed. Maybe not enough. But we are moving in that direction!
Potholer put out a great video about that 3 years ago! Projections still look bleak. We can do much more. But it is not as bad as it could have been.
-
michael sweet at 09:13 AM on 17 July 2021It's not bad
While I wish stronger actions were being taken now, it is way better than it was ten years ago. I remember thnking "how can we get people to build out wind and solar when they are 5 times more expensive than fossil fuels?" Now renewable energy is the cheapest so they are building out renewables in Texas!! No greenies behind those wind turbines and solar farms, they are building them because it is cheapest.
Carbon Brief reports many coal plants planned 5-10 years ago that were not built yet are being cancelled. That is not because they are worried about climate change, it is because renewables are cheaper.
I am worried about the future, but it looks way better to me than it did 10 years ago.
-
Bob Loblaw at 01:00 AM on 17 July 2021It's not bad
I'm sort of where Eclectic is, too.
There is an old saying: an optimist believes that we live in the best of all possible worlds; a pessimist fears that this is true.
Even if we can't stop the car before it hits the wall, slowing it down helps. And in the case of climate change, trying to stop at 1.5 or 2C but failing will still help us avoid 3 or 4 later on. And even if we fail to stop the bad consequences, knowing what they are going to be helps us prepare for them.
Anyone that thinks "it can't possibly get worse" is fooling themselves - there is always some creative genius out there who can find a way to make it worse.
-
Eclectic at 19:07 PM on 16 July 2021It's not bad
TVC15 @390 :-
Permit me some general waffle : my comment is that you should be half'n'half ~ half optimist, half pessimist. The global situation is going to get bad but not catastrophic. Yes, we are going to blow straight past the 1.5 degree mark in global surface temperature rise since pre-industrial. The rise already (over 170 years) is about 1.1 degrees, and this makes a mockery of any contrarian who opines that the CO2-doubling Climate Sensitivity is less than roughly 2.0 degrees (and seems most likely to be in the 2.5 to 3.0 degree range at equilibrium ~ which also fits with non-historic data e.g. the paleo data).
With extraordinarily good management, we might conceivably halt the rise by 2.0 degrees . . . but our political track record so far is poor.
It is not just the politics, but technological advances which are still required. Sure : cheaper solar & wind technologies are coming, but we really should have started seriously developing these at least 10 years before we actually did. (But the past cannot be changed.)
The 2050 date for "carbon neutral" will require more than the present-day solar & wind, even at half of today's prices. Energy storage is absolutely necessary ~ and I am looking to bulk storage of electrolytic hydrogen. Hydrogen to provide electricity via fuel cells (at small scale) or steam-driven turbines at large scale (possibly combined-cycle?).
The second leg to stand on, is a hugely-increased supply of liquid hydrocarbon [octane / kerosene / diesel types] produced from non-fossil feedstocks, by means of catalytic / enzymatic / fermentational technology. In brief, we need to produce these hydrocarbons at a scale little short of present-day fossil fuel consumption. For a great amount of our energy usage, these hydrocarbons are necessary ~ and I suspect it will take many decades after 2050 , before we could replace such hydrocarbon fuels.
Extinction of a very large slice of animal/plant species . . . is arguable. Extinction of the human race ~ certainly impossible. The casualty rate may be high in the future ~ but extinction, no way. Mass migration of "climate refugees" will increase as sea level rise and heat waves occur, and there will be major social disruption. "Interesting Times" , as the old Chinese saying goes.
-
TVC15 at 10:06 AM on 16 July 2021It's not bad
Hi Skeptical Science Team,
I am not trying to come across as a pessimist, in fact I am very jolly happy optimist. (it’s my nature).
However, looking around at all the attitudes that lack an understanding of how urgent our climate situation is, and the fact that not much has been done to ween the globe from fossil fuel burning, I can’t help but to think we are past the point of being able to curb the future disasters that are coming our way due to climate change. Those disasters are here and now already.
We are now living on a planet that is in the beginning stages of driving humans, as well as other animal species towards extinction. We’ve already caused extensive death and destruction. Over 50 percent of the world's coral reefs have died in the last 30 years and up to 90 percent may die within the next century. The rate of normal background extinction is hundreds, or even thousands of times higher than the natural baseline rate.
Also, since CO2 lingers around in the atmosphere for 1000’s of years and we are continuing to pump ~50 Billion tonnes of carbon dioxide equivalents a year into the atmosphere, how on earth are we going to prevent the creation of a runaway greenhouse effect?
Am I alone in thinking we’ve reached a point of no return? -
Philippe Chantreau at 03:42 AM on 16 July 2021Exxon's Own Research Confirmed Fossil Fuels' Role in Global Warming Decades Ago
And an opinion piece from Newsweek resulting from the unintentional disclosure I linked above:
The underlying reality is unescapable and very simple: there is no long term future for humans on this planet that includes continued, industrial scale use of fossil fuels. Everyone knows it. The ones profiting from it just want to make sure they extract every last little penny before they are forced to change.
I don't say this lightly. I come from a culture that values speed and skill at handling machines powered by fossil fuels. When I was growing up, the coolest thing one could do was riding motorcycles, doing Rallye racing or flying airplanes. I am a pilot, flight instructor, love to fly and I still love to ride motorcycles. However, reality does not change according to our preferences, despite what some would have the crowds believe.
-
BaerbelW at 02:39 AM on 15 July 2021Additional Fact Briefs published on Repustar
MAR @3
One broken link always slips through, sorry about that. Thanks for the heads-up and link fixed now.
Hameiri @ 1
Did you follow the link in the first paragraph? It renders your comment rather moot, doesn't it?
-
Bob Loblaw at 02:05 AM on 15 July 2021Additional Fact Briefs published on Repustar
Until the link MAR mentions is fixed in the blog post, you can follow this one:
It looks like the orignal has an echo. It looks like the orignal has an echo.
-
MA Rodger at 00:40 AM on 15 July 2021Additional Fact Briefs published on Repustar
The link to Do natural climate cycles disprove that modern global warming is caused by humans? ... read more needs editing.
-
Eclectic at 22:47 PM on 14 July 2021Additional Fact Briefs published on Repustar
Hameiri @1 ,
LOL. If you wish to be scientific, you should falsify the fact checker.
I will be interested to see if you can come up with anything!
-
Hameiri at 22:20 PM on 14 July 2021Additional Fact Briefs published on Repustar
A fact checker that always finds you right? Very scientific ❗ How long did it take to find this firm❓
-
TVC15 at 14:50 PM on 14 July 2021Climate's changed before
Many thanks to Eclectic, Bob Loblaw, MA Rodger and Daniel Bailey.
I gain so much from each of you every time I post denier claims.
Thank you all for your time and efforts to help educate us!
-
Bob Loblaw at 04:57 AM on 14 July 2021The cool, lush Pacific Northwest roasts in Death Valley-like temperatures
Just a little more trivia on the Lytton weather station during this record-setting heat and fire event noted in comments above.
Communications were lost early in the morning (UTC) on July 1, but the system ran on battery power until July 2 at 03 UTC.
Power was restored shortly before July 6, 00 UTC. The system transmitted data from July 1 at that time, and has been operational ever since.
-
Daniel Bailey at 01:05 AM on 14 July 2021Climate's changed before
IIRC, the Last Glacial Maximum saw a greater buildup of land-based ice than in previous glacial phases. By the time maximum warming in the Holocene had been achieved and a natural cooling initiated, a great deal of ice remained in Greenland and Antarctica that had already been lost by that same point in previous interglacials.
Given time to reach equilibrium with the modern forcing, global sea levels will eventually surpass any levels achieved in previous interglacials spanning the previous 800,000 years+, and likely far longer than that.
From Dutton 2015, Figure 5:
-
knaugle at 01:04 AM on 14 July 2021Study: Extreme weather may not lead to increased support for climate action
I think it relevant that Dr. Katherine Hayhoe of Texas Tech recently noted that while 70% of people in the USA believe global warming is real, only 43% think it will affect them in THEIR lifetimes. So more than half of us here still think that dealing with global warming is someone else's problem, one for another generation. That kind of inertia is difficult to overcome.
Meanwhile, I still think most people fear nuclear power far more than global warming.
-
MA Rodger at 00:21 AM on 14 July 2021Climate's changed before
TVC15 @873,
Your denialist is actually making four bold statements that are patently nonsense with the rather pathetic request that you "Tell us why this Inter-Glacial Period should be different.""Ice sheets and glaciers always melt during Inter-Glacial Periods." The melting actually happens in the run-up to the "Inter-Glacial Periods" which is what makes them "Inter-Glacial Periods" so in one respect this is entirely straw man territory. If the bold assertion is that glaciers and ice sheets shrink as they do today throughout an inter-glacial, that is false as sea levels of past millennia demonstrate.
"Sea levels are normally 4 meters to 14 meters higher than they are now during Inter-Glacial Periods." This is not supported by the evidence that
suggests only two or three of the eight had higher sea levels. (The graphic is from here but originates from this web engine.)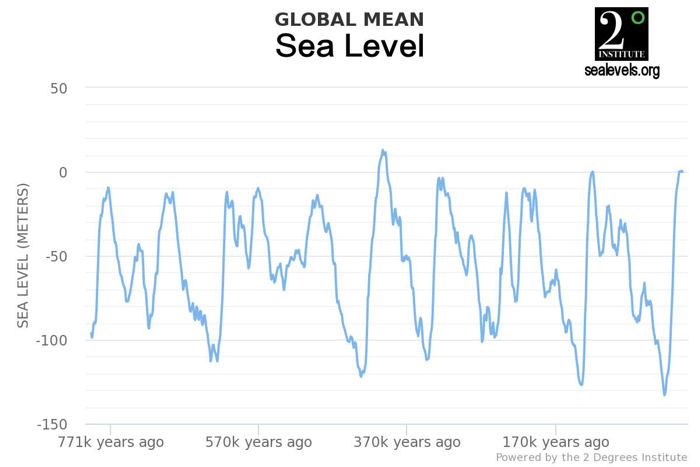
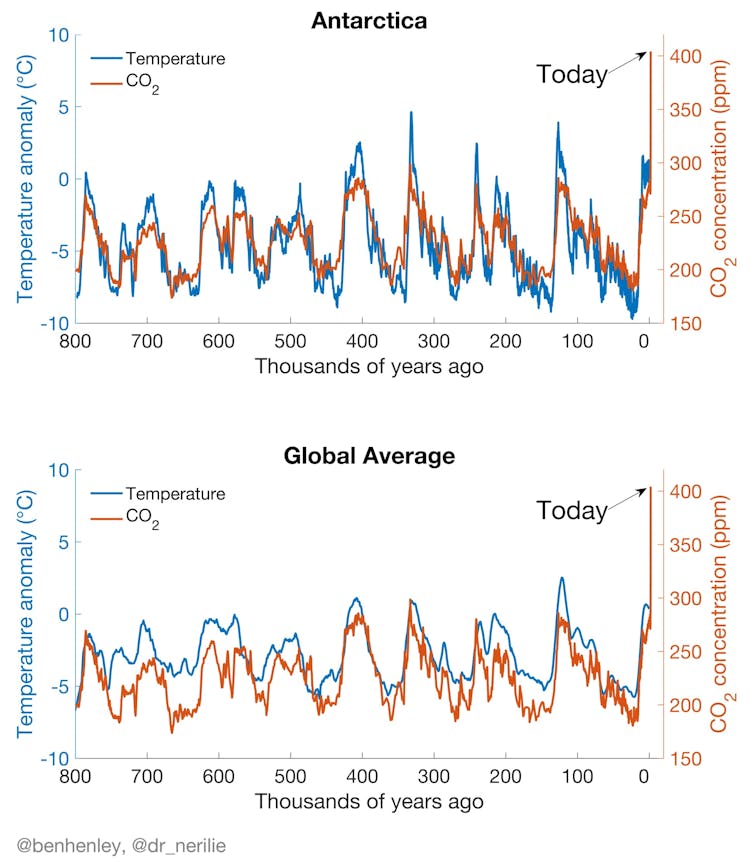
"Global temperatures in the other 8 previous Inter-Glacial Periods were at least 7°F warmer than present." Again not supported by the evidence. A google search provides many graphical representations of 800,000y temperatures and globally the present interglacial has been warmer than all but three of them (although AGW may be on course to change that ranking).
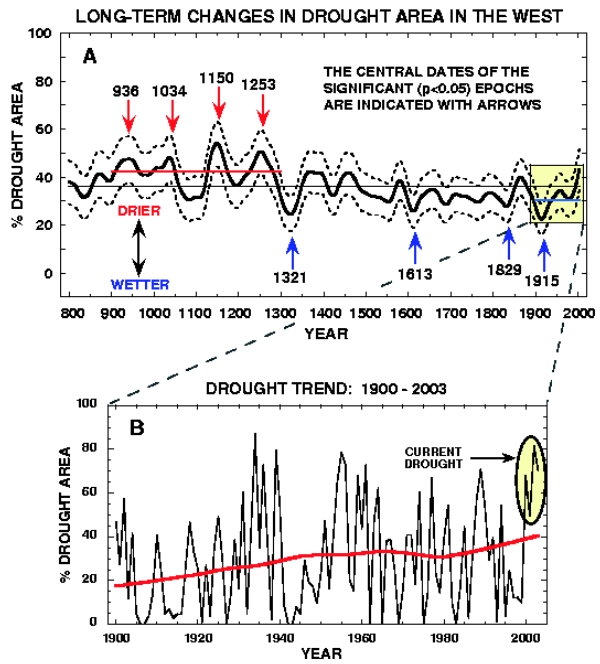
"The West always undergoes a drought during Inter-Glacial Periods." This is a more specialist assertion. That there has been "a drought" in "the West" through the Holocene is potentially correct. It isn't a place with massive rainfall. But more accurately there are periods of drought and periods when the rain is heavier. What we see to make sense of that is a bit of a Hockey Stick situation with drought conditions becoming more wide-spread. The graphic comes from here an account which does address the question "Will anthropogenic climate change cause the West to get drier or wetter?"
-
wilddouglascounty at 00:10 AM on 14 July 2021The making of a one-of-a-kind climate change PR professional
This self review of a book is intriguing and shares many of the insights it sounds like is expanded upon between the covers of that book. I plan to check it out: I believe that the transition of our governing process from a bipartisan to a bipolar political process has been engineered through the processes discussed in this book, and as such examination of these dynamics will hopefully aid in dismantling the polarization of the public commons where differences can be shared and ways forward can be developed.
-
Bob Loblaw at 22:21 PM on 13 July 2021Climate's changed before
A follow-up to the "sea level was higher in past interglacials" claim.
Is this person claiming that sea level is indeed rising to dangerous levels, but it's natural?
Is this person claiming that sea level has risen naturally in the past, so rising CO2 and rising temperatures cannot change this previous pattern?
The part TVC15 has quoted is the usualy mishmash of vague, unspecific claims. Good luck trying to pin the denier down to a specific claim or statement that can be examined by evidence - my experience is that such individuals often are incapable of expressing themselves clearly enough.
-
Eclectic at 17:35 PM on 13 July 2021Climate's changed before
TVC15 , from experience, you know how anything & everything is grist for the deniers' mill, in their attempts to minimize and/or deny the climate science. It's always ABCD ~ Anything But Carbon Dioxide.
And their excuses come in cycles of excuse ~ first: It's Not Warming . . . then: It's only warming a bit . . . then: Yes, it's warming a lot, but it's Not caused by humans . . . then: Well yes it's half-caused by humans, but the Warming is really very very good for us and is saving us from disastrous cooling.
Then it's back to: the Warming has Stopped and it's cooling now (for at least 6 years' cooling, says the deluded Monckton) . . . and a Colossal Grand Solar Minimum will have all of Canada under a mile-thick ice sheet by 2050 or somesuch date.
For millennia, the US Southwest has been arid - the opposite of the Northeast. And you can find other regions of the world likewise arid. All it needs is a slight variation in climate, and you've got a mega-drought (a drought defined as >20 years) or a super-mega-drought (for centuries). Nothing very new about that ~ except that now our Anthropogenic global warming is exacerbating the droughty tendency. (The exacerbation being the point your denier wishes to deny.)
I haven't studied past Interglacials w.r.t. aridity & droughts. Presumably similar overall conditions in the past have caused rather similar episodes. But that's all rather irrelevant to the current situation, which must be dealt with on its own terms. And the current droughty tendency doesn't disprove the climate science, nor does it fail to point to more of the same trouble in future, as AGW worsens.
Of course, as we look back in time, the proxy evidence (in past Interglacials) gets fuzzier & fuzzier ~ so conclusions of any sort get more difficult to make.
The "Anthropocene" is a semi-humorous label. Not official. But the label does get up the deniers' noses. Still, it does rhetorically emphasize that the Holocene is transitioning into something significantly different from the "natural".
-
TVC15 at 16:09 PM on 13 July 2021Climate's changed before
Bob Loblaw@876
[Sea levels are normally 4 meters to 14 meters higher than they are now during Inter-Glacial Periods.]
Thanks so much for responding to this deiners claim and providing that graph!
-
TVC15 at 16:07 PM on 13 July 2021Climate's changed before
Eclectic @874, 875
Hi Electric,
Thanks for the responses!
I don’t understand why this denier is trying to make it a fact that the Western half of the US always undergoes a drought during Inter-Glacial Periods when I don’t think we really know, or do we?
They mention the other 11 interglacial periods, during which modern humans did not exist until the Holocene. I’ve also head a new epoch called the Anthropocene, with the start date of this new epoch still in debate. Not sure if this is recognized as the most current epoch.
Since humans did not occupy most of those interglacial cycles, I don’t understand the deniers argument. There is nothing to connect the dots between past interglacials and our current situation.
Now instead of saying climate always changes, deniers are claiming that what we are witnessing all over the globe today is typical during an interglacial cycle.
How can we know the conditions of ancient interglacials? Did they all cause drought in the Western half of the US?
Thanks!
-
Bob Loblaw at 11:17 AM on 13 July 2021Climate's changed before
TVC15.
Your interlocutor seems to be using a combination of "Climate has changed before" (this thread) and "we're coming out of an ice age", which is an odd twist on "we're going into an ice age". Maybe he's confused with "we're coming out of the Little Ice Age".
There is a post here at SkS that talks about sea level over the past 150,000 years. It includes the following graph of sea level, covering the last glaclal/interglacial cycle:

I do not see anything on that graph to support his claim that sea level is normally 4 to 14m higher than now during interglacials. The peaks of that graph may be a touch higher, but there sure isn't a steady period of higher sea levels in the last interglacial. I suspect his claim is completely bogus, but you could always try to get him to provide his source of data.
On very long time periods, ocean basin size/shape changes have dramatic effects on relative sea level. On short time scales (glacial/interglacial cycles), local sea level in areas subject to the weight of ice have serous effects due to isostatic depression and rebound.
Of course, the answer to "why should this interglacial be different?" is "because we're adding CO2 to higher levels than seen in hundreds of thousands of years, and we're looking at rising temperatures and conditions not seen in past interglacials".
-
Eclectic at 10:49 AM on 13 July 2021Climate's changed before
. . . 2
TVC15 , a recent high-resolution sea-shore study [ IIRC - Kulp and Strauss 2019 ] indicates that a 1 meter SLR would displace approx 230 million people from their houses and farmlands. And factoring saline inundation by storm surge, there would be many millions of refugees displaced well before the "average" 1 meter rise is reached. So that's likely to be getting underway before 2100 even though the full 1m rise won't come until after 2100. And doubtless, some of these many refugees will need to settle in the neighbourhood of this denier's great-grandchildren. No social disruption at all !
And for a 2m rise in sea level, you can add a few hundred million more refugees . . . all wanting to go to higher ground . . . like Colorado, or wherever this unworried denier has been living.
Western droughts come and go - and sometimes stay for centuries, judging by the history of the last 2000 years. ( I'm sure your denier friend will tell the farmers and townsfolk, that they simply need to wait patiently, for a few generations or so.)
Note that the PAGES12k proxy studies show that world temperature is currently same or slightly higher than the peak of the Holocene - though many deniers still falsely claim that we are "colder than the Medieval Warm Period". Go figure !
-
Eclectic at 10:21 AM on 13 July 2021Climate's changed before
TVC15 @873 ~ yes, it's marvellous to observe the shameless rhetorical mendacity of some of these deniers. Hard to say whether they believe their own nonsense, or whether they simply aim to score Debating Club points by playing any arguments (arguments 100% true or 95% false). But .... it is what it is, with these trolls.
I love their dismissive style of argument - "It's stupid to worry about a few extra degrees of warming, when only 4 billion years ago the Earth's surface temperature has been 200 degrees hotter." And so on.
As you know, TVC15, each glacial cycle is somewhat different from each of the others - but what we have to face up to is to deal with modern problems : not the problems of a million years before humankind arrived. So why is he himself running away from facing up to the present situation?
Perhaps your denier friend would be unfazed by having a sea level 3 meters deep in his own house's living room? Or is it only *other* people's houses he is unworried about.
. . . 2
-
TVC15 at 07:46 AM on 13 July 2021Climate's changed before
My favoirite hubris spewing climate denier is at it again.
He was smarting of to a person in Colorado who was discussing the current drought in the Westen half of the US.
[What a coincidence.The same thing happened in the previous Inter-Glacial Period, and the one before that and the one before that and the other 5 before before that.
Are you foolishly blind enough not to see the pattern?
The West always undergoes a drought during Inter-Glacial Periods.
Tell us why this Inter-Glacial Period should be different.
Ice sheets and glaciers always melt during Inter-Glacial Periods.
Tell us why this Inter-Glacial Period should be different.
Sea levels are normally 4 meters to 14 meters higher than they are now during Inter-Glacial Periods.
Tell us why this Inter-Glacial Period should be different.
Tell us why the sea level should not rise at least another 4 meters like it did in the other 8 previous Inter-Glacial Periods.
Global temperatures in the other 8 previous Inter-Glacial Periods were at least 7°F warmer than present.
Tell us why this Inter-Glacial Period should be different.
Tell us why this Inter-Glacial Period should be a statistical anomaly and be colder with lower sea levels and no melting and no drought.
Can you do that?]
This denier is so hostile and over the top smug and arrogant in his replies it's hard to take them seriously.
Is it accurate that the west always undergoes drough during interglacials?
Also I don't think it's correct that Sea levels are normally 4 meters to 14 meters higher than they are now during Inter-Glacial Periods.
How can this denier make this claim? Global temperatures in the other 8 previous Inter-Glacial Periods were at least 7°F warmer than present.- Tell us why this Inter-Glacial Period should be different.
- Tell us why this Inter-Glacial Period should be a statistical anomaly and be colder with lower sea levels and no melting and no drought.
My response to the above bullets would be that this interglacial is nearning it's end and we should be seeing a global cooling effect, but we are seeing a warming effect due to human activity. Not sure what more I could add to my response to the bulleted statements made by this denier.
-
Bob Loblaw at 06:33 AM on 13 July 2021The making of a one-of-a-kind climate change PR professional
I lived throught he Harper government pushback on many of these issues, and watched colleagues (and myself) lose jobs as climate-related programs were shut down. I remember Peter Kent, as Environment Minister, making a public announcement of of an extensive oil sands environmental monitoring program that he claimed would demonstrate that Canada was producing petroleum products in an environmentally friendly way.
Silly me: I thought that scientists were supposed to draw their conclusions after the data was collected, not before. [To the credit of the scientists that had to set up the monitoring, they did do a good job of it.]
The politicans that are going after environmental groups over "foreign funding" never seem to worry about groups such as The Fraser Institute and their sources of funding. (Hey, there's that Desmog database at work again!) The Kenny government in Alberta (Kenney was in Harper's federal cabinet) has continued the "investigation", starting in 2019 and continuing today.
https://www.cbc.ca/news/canada/calgary/alberta-war-room-public-inquiry-1.5200549
-
Bob Loblaw at 06:14 AM on 13 July 2021Analysts dissect historic Pacific Northwest ‘heat dome’
Yes, Eric. distributions bring in a lot more data and make it a lot easier to evaluate the "how probable?" question. It really is a question of probabilities - asking "how much is cause A, vs. how much is cause B?" is very difficult when both cause A and cause B have built-in variation.
As a simple thought experiment, let's take the hypothetical case of a location with a mean high temperature of 30 for July, and with a normally-distributed variation that gives us a standard deviation of 5. Based on the characteristics of a normal distribution:
- We would expect 95.45% of the values for July high temperature to be within 2 SD (so, in the range 20 to 40).
- We would expect 99.73% of the values for July high temperature to be within 2 SD (so, in the range 15 to 45).
- If we only look at hot extremes, temperatures >40 would happen 2.3% of the time, and temperatures above 45 would happen 0.14% of the time.
The latter case (>45) is about a 1:1000 return interval. That does not mean that we'd only see one such event in 1000 tries, though: random variation could mean it happens 0, 1, 2, 3, or more times (with it being increasingly unlikely as that number increases).
Let's look at two scenarios where conditions change.
- In the first, the average does not change, but conditions get more variable. The SD increases to 7.5. Now, the upper limit of 45 is only 2 SD away from the mean, so it will be exceeded 2.3% of the time instead of 0.14% of the time. That is much more frequent.
- In the second, the SD does not change, but the mean increases from 30 to 35. Again, the upper limit of 45 is only 2 SD from the mean, so it will be exceeded 2.3% of the time.
In reality, both the mean and variation can change - and need to be evaluated.
To add to the difficulty, the 2.3% figure is a long-term statistic. Try generating a sequence of 100 random values (normally distributed) and count how many are more than 2 SD above the mean. Repeat it several times, and watch the count change. (In my quick check, I can get it to vary from 0 to 7 over a few dozen tries.) It is that variation that makes it difficult to use just the extreme values to assess whether there is a shift in the regime. The count of how many values exceed the chosen extreme, in a random sample of the variable, is given by the Binomial Distribution.
Getting away from statistics, yes any region will have links to other regions. And yes, as soil dries out and both soil and vegetation respond with reduced evaporation more of the energy received from the sun will go into heating the soil and the air. So it gets hotter, and things dry out more, etc.
-
nigelj at 18:11 PM on 12 July 2021The making of a one-of-a-kind climate change PR professional
What truly excellent commentary!
A couple of comments on a few aspects. I have found De Smog blog most useful for finding information on people. So thanks for this often very detailed and revealing work.
It's so sad when people abuse public relations skills to do bad things and promote disinformation.
This really resonates: "The goal of argument and public debate should not be to crush someone who disagrees with you, but to bring forward the truth. Argument is necessary and people should be encouraged to hold different opinions, to challenge issues, to question motivations and points of view, and to take part in passionate discussion. Paralysis is what’s bad......Empathy and evidence need to replace disinformation and division"
The commetary says "I became preoccupied with a question. Why, despite all the alarming scientific evidence, are we doing so little to address the big environmental challenges?"
While the disinformation campaign is obviously part of this it doesn't entitely explain it for me because many people who accept climate science and the need to do something don't appear to do much to change their own behaviour or change laws etcetera. This commentary is probably part of the answer:
"Harvard psychology professor Daniel Gilbert argues that humans are exquisitely adapted to respond to immediate problems, such as terrorism, but not so good at more probable, but distant dangers, like global warming. He talks about his op-ed piece which appeared in Sunday's Los Angeles Times......"
-
Eric (skeptic) at 12:23 PM on 11 July 2021Analysts dissect historic Pacific Northwest ‘heat dome’
...it is better to look at all the data and apply a frequency distribution, then use the fitted distribution to assess extreme values.
Thanks for the added feedback Bob. Initially I thought my question was simpler: how much of the recent event was weather and how much was global warming using the trend of monthly maximums. Then your frequency distribution suggestion led me to this paper:
The changing shape of Northern Hemisphere summer temperature distributions (the Wiley link may not work, so I included the title)
They are doing what you suggested, a frequency distribution of all Tmax values. Then they trend the percentiles. That seems very sensible. My trend of the maximum value of the month does not capture the nature of global warming because global warming affects averages.
That's of course using my assumption from the discussion in the rapid response paper: that the weather was not affected by global warming, just the temperature. So I have to go back and redo my work.
It seems reasonable that a warmer Gulf of Mexico could pump out more moisture and temper Tmax in the central and eastern US. Out west there may be a "desert amplification" effect in dry locations, but there's a lot of variability and that could be Tmax cooling from reforestation (e.g. Nevada City CA), Tmax warming from draining the delta (Sacramento around 1920), and some weather amplification. Soden and Held said the wet get wetter and dry get drier, and I think that applies to weather and seasons more than locations.
Drought is natural but amplification of any drought is part of global warming, and that clearly contributed to Tmax in Portland with 14% RH and Lytton, which I believe went all the way down to 9%. I'll have to leave that for later.
Finally, thanks for the Canada info. I drilled into a directory and found gridded anomalies. That could provide a global warming trend but probably for Tavg, rather than Tmax. I could compare the trend to the raw Tmax values for the recent event. But I'll probably stick with USA for now.
-
Bob Loblaw at 23:54 PM on 10 July 2021Analysts dissect historic Pacific Northwest ‘heat dome’
Now, regarding the brief description you give of your methodology, Eric. If I go directly to the image you provided in comment #5, it is a little easier to read the text than it is here on the narrow SkS web page.
https://followthedata.dev/wx/temp/trends/LILLOOET.png
You also say a few words on your use of monthly maxima in comment #7.
The distrbution of temperature involves a lot more than just the extreme values, so you are not looking at the full picture when you restrict the data set that way. Restricting it to monthly maxima is even further limiting. In examining climatological data, it is better to look at all the data and apply a frequency distribution, then use the fitted distribution to assess extreme values. That distribution may be a normal gaussian curve in the case of temperature, but will be something else for other parameters. For instance, precipitation events are not at all described by a normal distribution, so other statistical distributions are used.
In comment #7, you finish with:
The bottom line is with the 98% criteria I can usually get 100 or more years of data. I consider that a minimum for rare events but obviously inadequate for very rare events. We will never see those.
It is erroneous to assume that an extreme temperature with a 100-year return interval is the highest temperature in a 100-year period of record, and it is erroneous to think that a shorter record will not contain these extreme values. A 100-year record may not include a 100-year return interval event, or it may contain several, and it may contain a 1000-year event. These are probabilities, not certainties.
Take the case of Lytton. Is the extreme measure in June 2021 (which is an all-time Canadiane record) a 100 year event? A 1000 year event? Neither? Even if the Lytton station only had data available starting in 2021, that temperature would be an extreme event even though the period of record is short. The classification "extreme event" is essentially independent of the length or record. Our abiity to assess that classification does require more data - but we need to keep a clear distinction between "is it extreme?" and "how do we know it is extreme?". If an event is extreme, it is extreme whether we know it or not.
In order to assess the 100-year/1000-year question, what is needed is enough data to properly assess the distribution of temperatures, which can be done with a lot less than 100 years of data, and involves including more than just the extreme data. In particular, the dsitribution within a region can be assessed using many different stations throughout the region, and determining that the behaviour is similar across the region.
In short, assessing the likelhood of extreme events is a little more complicated than it initially looks.
-
Bob Loblaw at 23:47 PM on 10 July 2021Analysts dissect historic Pacific Northwest ‘heat dome’
Thanks for the links, Eric.
I will first comment on the Canadian sources of data, which I have more than a passing knowledge of. You have found the main public archive of data available from Environment and Climate Change Canada (Meteorological Service of Canada). The web site (https://climate.weather.gc.ca/historical_data/search_historic_data_e.html) has its limitations in search functions - in particular it's a bit hard to determine sources of data, whether data are available on hourly, daily, or monthly periods, etc. It takes a bit of manual labour to try all the drop-downs and see what shows up.
In my comment #6, the source of information I was using for station listings and observation programs was the old "Station Data Catalog". For decades, it was published on paper by MSC, and for a while in the elctronic age the catalog was available electronically, but they seems to have stopped providing it publicly. The last electronic copy I have is from 2017. The Catalog lists all observing programs/time periods for each station, including some that are not available electronically. MSC still has records that have not been transferred from paper to electronic form, and the public archive at the web site you used also does not cover every station and observing program that exists electroncially. That web site is probably as complete as it gets for public records, though.
The station catalog I refer to tells you when a measuremnt program was active at a station, but it does not tell you when there are gaps in the observations. For example, the one period I mentioned in comment #6 is based on this entry:
1114620 LILLOOET BC | 50 42 121 56 | 0290| 1948-03-01 1970-02-01
but the data do not appear to be avaiable on the web. As you have discovered, even if the web page provides you with a download, you may find missing values.
Yes, a change in station identifiers usually means a significant change in location, but it is not always so. Over many decades, it is hard to maintain a standard policy on when a new identifier should be used. The same identifier may be used when a station undergoes major changes in instrumentation, too - even though this can mean a discontinuity in methodology that may require homogenization. Station names may also change, making it hard to find other stations that might fill a gap. Once you have selected a specific station and are viewing data, there is a "Nearby Stations with Data" link.
A useful link to additional sources of MSC data is this one: https://climate.weather.gc.ca/links/index_e.html. It includes a link to gridded data based on adjusted and homogenized data.
The MSC web site provides data from a variety of sources. both in terms of who originally collects the data, and the type of observations that performed. Data can come from MSC-operated stations, or partners such as Nav Canada, DND, Parks, or provincial agencies. Observations can be done manually, or through a variety of automatic systems. Manual observations can be detailed hourly meteterological measurements by trained ovservers, or simple once-per-day temperature (max/min) and precipitation measurements by volunteers (although the equipment is provided by MSC).
You can find more information on the observation and processing methods in the Techncial Documentation and Glossary links on this web page: https://climate.weather.gc.ca/about_the_data_index_e.html.
A few key points:
- Daily mean temperature is calculated as (Max+Min)/2 regardless of the level of detail available in the original observations. This provides consitency across many different data sources.
- When manual observations of Max/Min are done once or twice per day, there are specific rules on how these are assigned to calendar dates, to maintain consistency. A high temperature will not be used twice on two days or two months.
- When manual or automatic readings are available on an hourly basis, all Canadian data use a "climatological day" from 0601Z to 0600Z, regardless of time zone.
For the archived data, hourly, daily, and monthly reports are stored independently, so you are not looking at daily or monthly values that are calcualted on the fly when you request them. Until recently, only selected stations were being processed into daily and monthly results. For monthly results, the MSC folows WMO rules for completeness of records: monthly value are not computed if more than a few days are missing. As a result, monthly data may not be provided for a lot of stations that do report daily data.
I will comment on your methodology in the next response.
-
Reuben Fraser at 21:06 PM on 10 July 2021Why the Miocene Matters (and doesn’t) Today
As 'this is' my 'first post' on 'Skeptical Science', I have decided to 'respectfully' introduce myself, even though I don't expect anyone to reply. 'Thank You!' That is, to the providers s of this website, and more specifically for howardlee, whose post back on 12 Feb. 2015 has introduced me to this website: Why the Miocene Matters (and doesn’t) Today.
I am accustomed to writing comments for the New York Times, and that is what has led me via a roundabout route to this website. It began when someone's comment informed me about something which I was unaware:
"Concentrations of CO2 in the atmosphere were as high as 4,000 parts per million (ppm, on a molar basis) during the Cambrian period about 500 million years ago to as low as 180 ppm during the Quaternary glaciation of the last two million years."
In the above I am quoting Wikipedia, rather than the person who made the comment, because that is my everday routine: turning to Wikipedia for further information about something which I have read in the NY Times; or otherwise, because there is a new artist about whom I am unfamiliar in the top 10 on the Apple Music charts for the U.S., U.K., South Korea or Spain, the four that I am happy to follow, it being routine to turn to their Artist Discography to download their most commercially successful songs.
The specific Wikipedia article about Climate Change that I am quoting above is Carbon dioxide in Earth's atmosphere; and their reference for what I have quoted is the Australian National University's Professor Tony Eggleton (2013) A Short Introduction to Climate Change, Cambridge University Press, p. 52. However, his text then redirects the reader to his chapter 8 for his references. Via many further such steps, I eventually found the following key reference: Hansen J, Sato M, Russell G, Kharecha P. 2013 Climate sensitivity, sea level and atmospheric carbon dioxide. Phil Trans R Soc A 371: 20120294; as this provides an excellent graph of relatively recent Climate Change, most notably the mid-miocene climatic optimum (MMCO).
")
-
prove we are smart at 11:05 AM on 9 July 2021Skeptical Science New Research for Week #27, 2021
Extract from 1 of the 107 articles from this weeks new research
"A rapid low-carbon transition is central to achieving the well below 2 °C goals of the Paris Agreement1. In addition to current policies and plans, meeting current NDC pledges is estimated to require US$130 billion per year of further investment in low-carbon technologies to 2030—an amount which could double or even triple for 1.5-2 degree consistency.
For the full article from Climate Change & Economics,week 27 here www.nature.com/articles/s41467-021-24305-3
Yes I know the bulk of that article is mainly concerned with the problems with financing green solutions in third world counties. Well maybe I am proving how smart I'm not but to me a big part of the slow response to new investment in green solutions is this?....
This probably also extends to our govt leaders, media and many more..
The extent of polluting affiliations exposed by the analysis underscore the need for closer scrutiny of board members, said Molly Scott Cato, Professor of Green Economics at the University of Roehampton and a former Green Party MEP."
“It’s shocking to see the very close links between banks and fossil fuel and other heavily polluting industries and helps to explain why, even in the middle of a climate emergency, it has been so difficult to undertake the rapid defunding of the very industries that are driving us to climate destruction,” she told DeSmog.
“This research needs to become a lesson for banks to conduct audits of their staff, not only to understand their potential biases, but also to ensure that they have undertaken mandatory sustainability education.”
Adam McGibbon of Market Forces, a group campaigning to prevent investment in environmentally-damaging projects, agreed that the extent of the connections that fossil fuel companies had to bank boardrooms presented a potentially concerning conflict of interest. He told DeSmog:
“Financial institutions are critical to driving the transition to clean energy, so it’s terrifying that their directors’ views are being shaped by the fossil fuel industry.”
“How can banks reasonably claim to support the Paris Agreement when their directors are linked to an industry with a vested interest in the Paris Agreement failing?”
For the full 11minute read see here www.desmog.com/2021/04/06/revealed-climate-conflicted-directors-leading-the-worlds-top-banks/
-
Eric (skeptic) at 10:37 AM on 9 July 2021Analysts dissect historic Pacific Northwest ‘heat dome’
Bob, I used this link climate.weather.gc.ca/historical_data/search_historic_data_e.htmland then type a town. I noticed in most cases observation locations have changed. When I used NCDC, these are my steps: followthedata.dev/wx/temp/trends.html Although the US stations that result from that search may show as complete from 18XX to present, there may in fact be observation location changes over that stated time period.
My impression with the Canada search results is that location changes are all explicit. Elevation changes are obviously likely in the terrain in the parts of BC I looked at which can create obvious discontinuities.
The main reason I used the highest temperature for each month in the trend is to avoid having to homogenize. The highest temperature for the month has a very low chance of being double counted from the previous month (high temp on last day of previous month counted on first day of next month). I basically avoid one problem (observation time with min/max reset) that homogenization may solve.
As for Lillooet it is actually missing the temperature data but has some precipitation, e.g.
"-121.93","50.70","LILLOOET","1114620","1958-01-21","1958","01",
"21","","","","","","","","","","","","0.0","","13.2","","13.2","","","","","","",""
So I assumed the temperature was not recorded and those particular gaps (all with the same station ID) are not resulting from station moves which would have completely missing data. I believe I used 955 and 27388 but I no longer have the shell script in my shell history so I don't know for sure. Here is a line from the recent data:
"-121.93","50.68","LILLOOET","1114619","2021-01-13","2021","01","13","","5.5","","-0.2","","2.6","","15.4","","0.0","","","\
","","","","M","","","","M","","M"On my US maps I used a 90 year minimum to include the 1930's (source code is linked). My station selection process (described at the link) is to download the first 3-4 stations with 98% or more completeness with current data and earliest start date. Some states have limited records so I settled for as low as 96% in some cases. But I also am downloading any long-record station that achieve new all-time highs. I have not done past mid-June so I do not have all of the PNW heat wave stations (started this before the PNW heat wave).
The bottom line is with the 98% criteria I can usually get 100 or more years of data. I consider that a minimum for rare events but obviously inadequate for very rare events. We will never see those.
Moderator Response:[BL] Added a line break to try to fix page formatting issue.
-
Bob Loblaw at 07:48 AM on 9 July 2021Analysts dissect historic Pacific Northwest ‘heat dome’
Thank you for providing additional information, Eric.
Regarding Lillooet. What is your source of data, and are you going by name, or the Climate ID used by the Meteorological Service of Canada? The information sources I have contain 29 entries for Lillooet, starting in 1878. Each entry indicates small changes in observing programs.Although there are gaps (as suggested by your graph), I see information that suggest a station was active in the period 1948-1970, and other stations in the 1970s and 1980s.
There are nine Climate ID values associated with those 29 station information records - a few have additional information in the names, such as "Lillooet A', which indicates an airport location. The nine Climate IDs are associated with slight variations in location, which would indicate a need for homogenization if records are joined.
You may be looking at a very incomplete record for the Lillooet area.
You may wish to look at the recent discussion where several of us talked about the Lytton location (record all-time Canadian high temperature) and fire:
https://skepticalscience.com/pacific-northwest-death-valley-like.html
In the information I have access to, the current Lytton RCS station (Climate ID 1114746) has been operating since 2006, but there are other records in Lytton going back to 1966. Lytton also has nine different Climate IDs associated with the name (incuding variations such as "Lytton", "Lytton RCS", "Lytton 2"). Again, homogenization would be required to join these together, but the current Lytton RCS station is within one arc-minute of the 1966 location (and 50m higher in altitude).
A great many weather observing locations in Canada (and throughout the world) have undergone many changes over the years, and it takes a lot of work to collect all the different bits and pieces. That's why people do homogenization, and they do tend to know what they are doing.
Although you mention "that web site", you did not actually provide a link.
You also state "Homogenization may or may not be a factor..." and "...that doesn't guarantee that extreme temperatures were not moderated by homgenization in prior years".
That is a very weak argument. Maybe it is? Maybe it isn't? Maybe you don't really know?
What do you consider to be a "short record station? How many years? On what basis do you decide that this is too short?
-
rpnman at 07:04 AM on 9 July 2021Welcome to Skeptical Science
Thank you so much for a valuable site. I rely on it for educational purposes and will support it (to the limited extent I can) financially.
...
My comment and question has to do with the intersection of climate change activism and other avenues of effort to bring about a more just and sustainable world. I have phrased that introductory sentence very carefully, because I am deeply concerned with getting to the root of what ails humanity that gives rise to ongoing crises in so many aspects of our living at once. I'll mention just a few that I claim are (beneath the surface) related: climate change; the cruel distorting injustice of a racialized social, economic, and political order; and widespread alientation from science and a flourishing of irrational contrarianism.
So think it may not just be a meaningless fluke or that your public-facing, friendly, 'volunteers' shot is, roughly 3/4 male and overwhelmingly white. It would take an effort to delve beneath the statistics (yes, the costs of climate change are visited disproportionately on the poor and on people of color) and come to grips with the worldview that links these imbalances into a pattern.
This long prolog boils down to a series of questions. Is there a part of the website that I missed that addresses this issue? If not is there any fellow interest in pursuing it? And where would it land? If there is not any interest I am left wondering why, and would welcome any thoughts in response.
My perspective is not one of an atheistic skeptic, but I do recognize that much of the world's religion has become mired down in outdated ways of discussing things that borders on superstitious narrow-mindedness. What I'm saying is that the discussion of human values is also essential to understanding how we got in to this climate mess and will be key to finding a way forward. Inevitably, that discussion entails a host of other issues as well. I fear that to ignore this critically important part of the picture is a Procrustean, and potentially fatal, oversimplification. -
Eric (skeptic) at 06:45 AM on 9 July 2021Analysts dissect historic Pacific Northwest ‘heat dome’
Thanks for fixing my link, and thanks for the questions. I found one long record station that continues to the present in SW Canada:

The trend is clearly up but due to the lack of data lacks statistical significance. I have the code on that website and can provide data if anyone wants to validate. The bottom line is that the first possibility in the top line of the paper is the most likely:
There are two possible sources of this extreme jump in peak temperatures. The first is that this is a very low probability event, even in the current climate which already includes about 1.2°C of global warming — the statistical equivalent of really bad luck, albeit aggravated by climate change. [versus climate nonlinearity]
They also point out the possibility of a combination. But charts from the US PNW are clear, a mostly flat trend in the highest monthly temperature followed by an extreme outlier. Bob, short record stations can't show the trend. Homogenization may or may not be a factor, and only in the single Canadian example, New Westminster. They said the 2020 homogenized and raw matched exactly. But that doesn't guarantee that extreme temperatures were not moderated by homgenization in prior years.
Phillippe said: "For Portland, OR in 1872. For Seattle, WA in 1891" They used Portland Int AP which starts in 1938 and SeaTac AP which starts in 1948.
-
John Hartz at 03:21 AM on 9 July 2021Analysts dissect historic Pacific Northwest ‘heat dome’
Hot off the press:
The deadly heatwave that hit north-western US and Canada in late June would have been “virtually impossible” without human-caused global warming, a new “rapid-attribution” study finds.
The event, which saw temperature records shattered by as much as 5C, has been linked to hundreds of deaths in the Pacific north-west region.
The heatwave was “so extreme” that the observed temperatures “lie far outside the range” of historical observations, the researchers say. Their assessment suggests that the heatwave was around a one-in-1,000-year event in today’s climate – and was made at least 150-times more likely because of climate change.
The analysis also finds that, if global warming were to hit 2C, a heatwave as extreme as seen last month would “occur roughly every five to 10 years” in the region.
Pacific north-west heatwave shows climate is heading into ‘uncharted territory’ by Robert McSweeney, Carbon Brief, July 7, 2021
-
Philippe Chantreau at 02:44 AM on 9 July 2021Analysts dissect historic Pacific Northwest ‘heat dome’
Like Bob, I would like to know more about why exactly Eric has a problem with the World Weather Attribution Group method.
There is a discussion at RC about this and they link to the preprint, where this can be found in section 2.1 (Observational data):
"The main dataset used to represent the heatwave is the ERA5 reanalysis (Hersbach et al., 2020), extended to the time of the heatwave by ECMWF operational analyses produced using a later version of the same model. All fields were downloaded at 0.25º resolution from the ECMWF. Both products are the optimal combination of observations, including near-surface temperature observations from meteorological stations, and the high-resolution ECMWF weather forecast model IFS. Due to the constraints of the surface temperature observations, we expect no large biases between the main dataset and the extension, although some differences may be possible under these extreme conditions."
It would be nice to propose a potential better methodology before condemning this one to the Gemonies.
Per NOAA, the period of record for Vancouver, WA starts in 1872. For Portland, OR in 1872. For Seattle, WA in 1891. For Vancouver BC in 1877. Etc, etc...
-
Bob Loblaw at 23:38 PM on 8 July 2021Analysts dissect historic Pacific Northwest ‘heat dome’
Eric:
You state "they are comparing adjusted, homogenized data from prior years to unhomogenized data from this year which exaggerates the current event. "
Please explain your reasoning as to why recent unhomogenized data causes this problem.
Please also explain/support your assertions regarding "very short record stations" and "no long term data".
-
Eric (skeptic) at 20:10 PM on 8 July 2021Analysts dissect historic Pacific Northwest ‘heat dome’
Link to study is on this page, and please read "main findings" bullets. https://www.worldweatherattribution.org/western-north-american-extreme-heat-virtually-impossible-without-human-caused-climate-change/ The bullets are sensible.
I'm not sure if they are intent on showing the event was mostly weather. But they are comparing adjusted, homogenized data from prior years to unhomogenized data from this year which exaggerates the current event. That makes it even more likely to be weather. They are comparing ERA to the euro model in the bounded area box. The 5C outlier extreme temperature in the bounded box is not verified by any station other than very short record stations, which I suspect is the problem with the analysis of the box.
In any case they are showing an event with an extreme outlier temperature without showing an increase in similar extremes. They claim an increase but have no long term data to show an increase.
Moderator Response:[BL] Link activated.
The web software here does not automatically create links. You can do this when posting a comment by selecting the "insert" tab, selecting the text you want to use for the link, and clicking on the icon that looks like a chain link. Add the URL in the dialog box. -
MA Rodger at 10:17 AM on 8 July 2021CO2 is not increasing
the Inspector @41,
I'm not at all convinced by your 'China' theory or even that there is a convincing 'dip' in MLO CO2 levels (or perhaps best described as "less of a February CO2 rise relative to consecutive months").
But I would draw your attention to a definite error in your argument. The reason the windy.com graphics are showing sky-high levels over China and very low levels elsewhere is because this is CO (carbon monoxide) being plotted in parts per billion. It is not showing CO2 (carbon dioxide).
Prev 95 96 97 98 99 100 101 102 103 104 105 106 107 108 109 110 Next


