


 Arguments


Recent Comments
Prev 1566 1567 1568 1569 1570 1571 1572 1573 1574 1575 1576 1577 1578 1579 1580 1581 Next
Comments 78651 to 78700:
-
Camburn at 10:36 AM on 18 August 2011How we know the sun isn't causing global warming
Scaddenp: Thank you. This is not what I was referring to, but it does show the difference within specialists in this field. I asked Dr. Svalgaard about his paper that he had mentioned about 6-8 months ago, and he said he was not in the "TSI food fight at this time" I can only take his advice, that TSI is certainly not deffintive, and even present methods of trying to measure it via satillite are not very good. He did say that Judith Lean does not back her Lean 2000 reconstruction with the newer understandings. So, being the true skeptic that I am, from at least my understanding, I will not accept that the early 20th century warming was tied to an increase in solar as there is too much disagreement within those who are experts in this field to have any confidence level in this idea. Also, the L&P effect is something else new as well. So much to learn, so little known. Thank you very much for your help. -
FiveString at 10:25 AM on 18 August 2011Joseph E. Postma and the Greenhouse Effect Part 2
I guess I really thought that trying to appeal to Postma from an astrophysical point of view would help him see his error. What's interesting about it is that my own background in stellar atmospheres led my intuition astray too. The difference is that when I saw that my intuitive view of how nature works conflicts with every non-loony authority, my response was to step back and try to figure out where I went wrong. And it didn't take long to find the mistake. Just like grad school all over again... I've apparently greatly underestimated the blinders on these latter-day Galileos. The most depressing part of it is that the only long-term result is likely to be that this 'dramatic new theory' will become a permanent talking point for the right-wing nuts. If I have to pick sides (and from my interactions on that site, apparently I do) put me on the science team, please. -
mullumhillbilly at 10:18 AM on 18 August 2011It's waste heat
Thanks Muon, The IR photos and S-B ^4 were helpful explanations for my small open fire, but you are really referring to temperature, not heat energy. I can think of two situations where the temperature is lower and the explanation may not hold. For example I can cover or contain the fire, or make it burn very slowly. The waste heat from a coal-fired power stations CFPS is ultimately equal to the energy content of the coal. It just comes out in various forms, steam from condensation towers, cooling water re-circulated in dams, the walls/roof heated by boiler radiation, transmission resistance in lines, and finally the actual electricity produced that goes into lighting or electric motors or whatever, all of which give off some low grade heat. So most of that waste heat from the CFPS is in fact similar to the background and would therefore seem to have as much chance of being absorbed by CO2 (or H20) as the night time losses from the natural land/water surface. And what if the coal was burnt very very slowly? For example, like a rotting log. Suppose it takes 10 years to decompose the 3.2 kg of coal in my first question. The heat (energy, not temperature) liberated by oxidation is still 24 MJ//kg, and it will still take 660 years for the warming produced by GHG emission to equal that amount. (assuming CO2 is already doubled so it has the effect of warming at 3.7W/m2). So it seems if you take out the rapid IR loss, the conclusions from my fire analogy still stand. The GHG warming energy from the emitted CO2 (in the short term) is a miniscule fraction of the energy released by combustion. Why is that GHG warming energy (night time only , near ground) not lost from the system as easily as the combustion energy? -
muoncounter at 10:17 AM on 18 August 2011Climate Denial Video #3: Polluters Use Same Tactics As Tobacco Industry
Tom, That is pirate's homework assignment. He's the one pushing '30+ climate scientists,' so let him tell us who they are. Hint: Spencer - not. Lindzen - yes. -
Tom Curtis at 10:09 AM on 18 August 2011Climate Denial Video #3: Polluters Use Same Tactics As Tobacco Industry
muoncounter @34, good luck with that - signatories do not have their specialization attached to their name, so even identifying the 39 climatologists would be a challenge. -
Tom Curtis at 10:08 AM on 18 August 2011Climate Denial Video #3: Polluters Use Same Tactics As Tobacco Industry
apirate @33 1) To quote from your 13:" We can then compare that to the 75 out of 77 who were deemed worthy of contributing to the oft reported 97% figure of climate scientists who support the AGW theory. 32 vs 77. Maybe, just maybe, things aren't as cut and dry as some would like them to be."
So, we have a denominator less comparison of 32 "climate scientists" for the Oregon Petition to the 77 "actively publishing climate scientists" from Doran; and we have an assertion that things aren't "cut and dry" in an explicit discussion of the proportion of climate experts who accept AGW. That represents a very clear implicit argument that that the 97% is significantly wrong, and that a comparison of the 32 with the 97 gives a better idea of the correct value. No explicit argument was msde. Consequently you implicit argument was exactly as I stated it. If that was not you intended argument you need to withdraw that claim and apologize for stating what ever your actual argument was in a way which invited misunderstanding. 2) My point stands whether you include members of the Oregon Petition, or just those surveyed by Doran. A petrologist is no more likely to be expert in climate science than is a dentist or proctologist. You do insist that the opinion of geochemists and geophysics is as relevant to assessing expert opinion on climate change as the opinion of actively publishing climatologists. But their opinion can only be as relevant to the expert opinion on climatology if they, by virtue of being geochemists and geophysicists, are as expert on climate change as are the actively publishing climatologists. -
Keith Hunter at 08:31 AM on 18 August 2011OA not OK part 16: Omega
Myself @6: Spotted a mistake. The saturation depth in the Pacific gets shallower from south to north, not as I mistakenly stated @6. -
scaddenp at 07:34 AM on 18 August 2011How we know the sun isn't causing global warming
Sorry, link to Svaalsgard is here. Note that this is a review and proposal but it contains a good review of reconstructions. -
muoncounter at 07:10 AM on 18 August 2011It's waste heat
hillbilly#67 : "where is all that heat from the fires going?" The surface of the earth radiates at 288K (~14 C); suppose your fire burns at 400C (673K). The radiated power varies with the 4th power of temperature (in K); there's a huge difference between 2884 and 6734. So the short answer is hot objects lose energy as infrared radiated to space very rapidly. See recent IR photos of wildfires (example here). See the Stefan-Boltzmann law wikipedia article for a reference. -
garethman at 06:52 AM on 18 August 2011One Confusedi Bastardi
As a self confessed sceptic I was really saddened by this interview. I’m sure the guy is an intelligent person who has a much greater potential than dodgy interviews on a news programme renown for being economical with the truth. Come on Joe, you can do better than this, you have the power to do much for the science. Reductionism and black and white thinking is always wrong, whatever side you are on. -
muoncounter at 06:48 AM on 18 August 2011Climate Denial Video #3: Polluters Use Same Tactics As Tobacco Industry
pirate#33: "there are 30+ who signed the petition" Let's stop throwing that 30+ number around without knowing what it means. Find out who the 30 are and what kind of work they have done. Are they are mostly fringers and cranks (of the caliber of Salby, Bastardi, etc) whose signature means nothing credible? Where do these 30 work? What papers have they published? How have those papers been received, commented, rebutted etc? You know, questions that skeptics might want answered before believing that this petition constituted some form of 'evidence'. Go over the petition with the same sort of microscope that you apply to Doran. -
Paul D at 05:19 AM on 18 August 2011Another two reviews of Climate Change Denial
It's Brians Satchel! eg. the guys name is Brian and he has a satchel :-) Unless I am missing a joke?Response: No, error on my part, have updated the post with Brian's correct name (next time should read the blog title more carefully). -
Bob Lacatena at 05:08 AM on 18 August 2011Joseph E. Postma and the Greenhouse Effect Part 2
5, Chris Colose, It is certainly worth at least some effort, just to have a record of it. It serves three purposes: 1) For a handful of deniers who believe this stuff, there's a chance they'll actually behave skeptically long enough to find your post, read it, and maybe put Postma aside in hopes of a more believable excuse for their denial. 2) For people on the fence, or in denial but able to understand the truth when they see it, you are providing a resource which will help them to not only move on past Postma's gibberish should they stumble into it, but also to see how easily the unwary can be confused by high-faloot'n sounding gobbledygook. 3) It will provide a log of yet another example of denial Climastrology, a growing and fantastic branch of alchemy that, if it grows large enough, will eventually serve as a huge, blinking neon sign for everyone to look at when considering how inane not only Postma's but almost all other denial arguments on the table really are. The sad fact is that a huge, huge number of deniers are Dunning-Kruger victims of the ilk of Postma (many can be found posting ridiculous comments on this very site). Not all (but many) are able to put together a web page or PDF of complex and therefore seemingly plausible gibberish. They are the poster children for those many more who don't or can't go that far, but also think they know better than everyone else because they rose in the ranks of their chosen but narrow field of engineering or science, and were able to solve any problem with their one hammer of choice. Because of the air-play that Postma is getting, his nonsense needs to be thoroughly debunked. -
John Q. Credibility at 04:13 AM on 18 August 2011Joseph E. Postma and the Greenhouse Effect
A second paper? The Postma always ding-a-lings twice, it seems. -
apiratelooksat50 at 03:43 AM on 18 August 2011Climate Denial Video #3: Polluters Use Same Tactics As Tobacco Industry
Tom at 32 1. I was not making an implicit argument about the percentage of scientists disagreeing with AGW. I plainly said that there are 30+ who signed the petition. However, for you to include comments in parantheses (i.e., whatever sort) is an implicit condemnation of scientists for which you have no basis other than your own arrogant sense of superiority. 2. I was not offended in the least by your comments in 29. Instead I found them amusing and off-topic. I am not insisting that actively publishing climate scientist not be considered the experts that they are. You insist on putting words in my mouth. I am no more insisting that a dentist be considered an expert than you are. But, then again I was not referring to the Oregon Project. I referring to the fact that there were plenty of scientists in the Doran Survey who were sent the survey who were not "climate scientists". Those respondees in other disciplines were placed to the side to achieve the higher percentage that is often quoted. From the article "With survey participants asked to select a single category, the most common areas of expertise reported were geochemistry (15.5%), geophysics (12%), and oceanography (10.5%). General geology, geology/hydrogeology, and paleontology each accounted for 5–7% of the total respondents. Approximately 5% of the respondents were climate scientists, and 8.5% of the respondents indicated that more than 50% of their peer-reviewed publications in the past 5 years have been on the subject of climate change." -
Chris G at 02:13 AM on 18 August 2011Joseph E. Postma and the Greenhouse Effect Part 2
I've gotten the impression that there is a class of people I call symbol manipulators. Basically, these are reasonably intelligent people who have a hard time knowing when the equations apply to the physical world and when they don't, or when they apply, but only as an approximation. They can be pretty good at juggling math equations and laws of nature, but there is a disconnect between the symbols and what they mean in the real world. I'm getting the impression that Postma might fall in this category. An extreme example: There was a fellow engineering student I knew who read something to the effect that no matter exists at absolute zero. All the rest of us took that to mean the entropy and the diffusion of energy guaranteed that all matter had some, possibly very minute, amount of heat energy (molecular motion). He took it to mean that, if you could somehow reduce matter to a temperature of absolute zero, it would cease to exist. He wasn't a bad person, and he was capable of producing language and formulas that were consistent with most laws of physics, but he was missing a connection with reality at a fundamental level. It might be that Postma would benefit from an explanation of how the composition, the density, and the temperature of the atmosphere vary with altitude, and why that is, because that is where simple atmospheric models suffer a disconnect with reality. Then again, that is knowledge that is readily available; so, he has probably been exposed to it before. Is this pattern a Dunning-Kruger effect, a result of cognitive dissonance, or something else? I don't know. -
Same Ordinary Fool at 02:01 AM on 18 August 2011Joseph E. Postma and the Greenhouse Effect Part 2
From Idiot Tracker "For months "Climate Etc" has been plagued by thousands upon thousands of comments triggered by her efforts to debunk some obvious denier fallacies about the greenhouse effect, which she has collectively labelled a "greenhouse dragon." Presently Judith's lead is a rather mundanely titled effort: "Postma on the greenhouse effect." "But I rather like what must be her original title... ..."A slain greenhouse dragon"." Her introduction mentions this Skeptical Science blogpost. -
Mighty Drunken at 01:38 AM on 18 August 2011The Ridley Riddle Part Three: Like a Northern Rock
suibhne I am not convinced. The reason I am not convinced is that mortgages are a fairly safe bet as long as you take a little care on who you lend to. This means the limiting factor on the number of mortgages you can lend is how much capital you have available. Its clear that this was not the case for Northern Rock, they had to keep burrowing money for the capital they required. Many a say a good rule of thumb is that a bank should not ever have a leverage ratio of more than 10 - if you do not want a banking collapse. -
mfripp at 00:36 AM on 18 August 2011SkS Weekly Digest #11
Great cartoon! -
Tom Curtis at 00:26 AM on 18 August 2011How we know the sun isn't causing global warming
Camburn @75, I agree it is one of many interesting areas of study in climate science. However, I do not see it as much of a threat to the consensus. To see why, consider this reconstruction of climate forcings over the last 1000 years from Hegerl and Zwiers, based (I believe) on previous work by Hegerl which I'm to tired to chase up at the moment):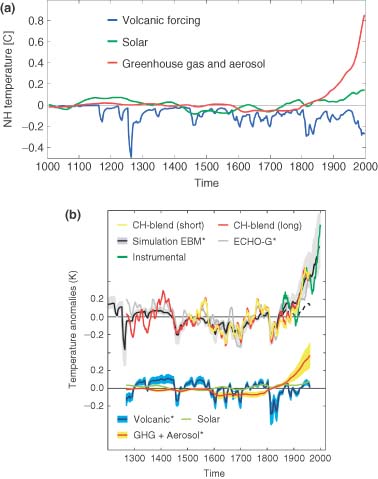 As you can see, they have no difficulty reconstructing early twentieth century temperatures (or indeed, temperatures for the entire 1000 years) with a change in solar forcing closer to 0.1 than 0.125 W/m^2 over the period 1900-1950. Part of the difference is made up by a stronger volcanic influence than in other reconstructions, however, it should be remembered that on the standard reconstructions for attribution studies as seen in the IPCC can reconstruct all of the 20th early 20th century rise with natural forcings alone. If one of those forcings is weaker than expected, the probable consequence is that natural plus anthropogenic forcings will still be able to reconstruct the temperature series, but that natural forcings alone will do so less well, possibly to the point of statistical significance.
You are correct about Shapiro being an outlier. What is more, he uses an innovative technique which I gather to be quiet controversial. Intuitively it is dubious to me, but I think its one the solar physicists are going to have to sort out between themselves.
As you can see, they have no difficulty reconstructing early twentieth century temperatures (or indeed, temperatures for the entire 1000 years) with a change in solar forcing closer to 0.1 than 0.125 W/m^2 over the period 1900-1950. Part of the difference is made up by a stronger volcanic influence than in other reconstructions, however, it should be remembered that on the standard reconstructions for attribution studies as seen in the IPCC can reconstruct all of the 20th early 20th century rise with natural forcings alone. If one of those forcings is weaker than expected, the probable consequence is that natural plus anthropogenic forcings will still be able to reconstruct the temperature series, but that natural forcings alone will do so less well, possibly to the point of statistical significance.
You are correct about Shapiro being an outlier. What is more, he uses an innovative technique which I gather to be quiet controversial. Intuitively it is dubious to me, but I think its one the solar physicists are going to have to sort out between themselves.
-
Camburn at 23:24 PM on 17 August 2011How we know the sun isn't causing global warming
Tom: Can you tell me more about Shapiro? I looked him up and he seems to be an economist. Is this correct? -
Camburn at 23:11 PM on 17 August 2011How we know the sun isn't causing global warming
Tom: Thank you. I will have to study your links as time permits. I would also hope I have created interest in studying this area again. As you noted, there are quit dramatic differences in reconstructed TSI as of late, which require re-examination of previous reasons of early 20th century warming. Shapiro would be considered an outlier with his results at this time. -
Bob Lacatena at 22:07 PM on 17 August 2011Joseph E. Postma and the Greenhouse Effect
8, Kevin C, People do tend to not find what they don't look for, don't they? Funny how that works. But it's all part of the nefarious deception. -
CBDunkerson at 21:11 PM on 17 August 2011Murry Salby - Confused About The Carbon Cycle
Dale, you might not like it, but think how this series looks to others. When presented with a logic chain which contradicts the conclusion you support you do not say, 'hmmm... maybe the conclusion is wrong'. Instead, you decide to deny the validity of the starting data. The logic can't be refuted, so the only remaining way to 'defend' the conclusion is to assume a conspiracy to falsify the data. Yet, as Dikran has pointed out, Salby accepted the accuracy of the data. Thus, we can still clearly see that his analysis MUST be wrong... unless you can identify some flaw in the logic progression that Dikran walked you through (which was an excellent analysis BTW). Failing that you are essentially now arguing against Salby's assumptions (i.e. the data is correct) as the basis to 'defend' his conclusion (i.e. the increase in atmospheric CO2 levels is due to natural emissions). This is inherently self-contradictory. Your claim that we must wait for Salby to publish in order to see if there is a flaw in his position is disproven by the fact that you cannot maintain support for his conclusion without contradicting his assumptions. This is the kind of logical inconsistency / cognitive dissonance which SHOULD make people say, 'Hmmm... there seems to be a flaw in this position'. You haven't done that. Is it any wonder that this causes some people to suspect your integrity? Personally, I think it more likely that you are sticking to the position out of some sort of faith or emotional resistance to being incorrect. That is, you aren't so much lying/trolling US as you are doing so to yourself. However, the effect is the same... rather than making logical conclusions you are leaping to incredibly thin conspiracy theories (e.g. human emissions data accepted by all parties is overstated by more than 100%). -
Fitz1309 at 20:47 PM on 17 August 2011Climate's changed before
CBDunkerson and DB Thank you for your replies and graphs! Very helpful indeed! The "How reliable are CO2 measurements?" article was also interesting, I particularly like the animation at the bottom of the page! :-)Response:[DB] If you liked that video then you should love this one, from SkS author Robert Way:
-
Robert Murphy at 20:33 PM on 17 August 2011Climate's changed before
#201 "What if heat causes CO2, which I gather is an emerging theory?" No, it's an old falsified claim that pops up every now and then in different guises by some "skeptics". I assume you mean the claim that the rapid rise in CO2 over the last 150 or so years is mostly due to rising temperature. That higher temperature will over a long time result in outgassing of CO2 from the oceans is not controversial and has no bearing on the recent spike. -
Dikran Marsupial at 19:31 PM on 17 August 2011Murry Salby - Confused About The Carbon Cycle
Dale wrote: "In terms of the evidence presented in this thread, the cause is human emissions." Good, I'm glad you agree. So unless Salby can refute the data used here, his theory is dead in the water? "But I do proviso that statement with "in terms of the evidence in this thread". In his podcast Salby says the anthropogenic emissions data are the only reliable data we have. The Mauna Loa data are so solid even WUWT accepts them as accurate, and it is the atmospheric growth data that Salby uses (listen to his podcast). Those are the only datasets used here, and Salby endorses both of them! "For instance, how are human emissions calculated?" The anthropogenic emissions data would have to be an overestimate by a factor of two to change the result. The uncertainty of emissions data isn't anything like that large. The uncertainty is also likely to be assymetric with under-estimate more likely than an over-estimate, simply because energy usage is taxed, so energy companies have no benefit to be gained by over-reporting. "Which also brings questions on how the natural in and out figures are calculated. How accurate to reality are they?" This comment suggests that you still don't understand the mass balance argument as it does not assume any knowledge about the "in and out" figures for the natural environment. It is a method for calculating the difference between them without knowing their values. -
Kevin C at 19:20 PM on 17 August 2011Joseph E. Postma and the Greenhouse Effect
Arthur Smith deals with the non-spherically averaged cases for both non-rotating and rotating planets here, in response to another similar claim. From the paper, p11:(There does not seem to be any readily-available data on separate day-time and night-time average temperatures for the Earth, which is very curious, while there is a wealth of data on daily average temperatures. The day-time and night-time averages are extremely important and would go far in helping to determine the heat retention capacity and properties of the atmosphere.)
Curious. I was able to pull up hourly data from individual stations straight away on Weather Underground. Not sure if anyone releases hourly data in a curated form though. -
Tom Curtis at 17:03 PM on 17 August 2011Climate Denial Video #3: Polluters Use Same Tactics As Tobacco Industry
apirate @30: 1) I notice you have shifted the topic of discussion. Previously you where defending the claim that the 39 climate scientists (of whatever sort) from the OISM petition and the 72 actively publishing climate scientists from Doran should be directly compared without reference to the relevant denominators. The implicit argument is that 35% of climate scientists disagree with AGW - a conclusion that is straightforwardly false. Having now recognized that ignoring denominators is irrational, you now appear to be arguing that actively publishing climate scientists are in fact not uniquely expert on climate science - a different argument entirely. 2) Turning to that argument, I need only point out that it is in no way a condemnation of dentists to say that actively publishing climate scientists are more expert on climate science than they. After all, expertise is not just a matter of possessing critical reasoning skills. It is a matter of having the relevant background knowledge; of being familiar with unusual but common (in the field) techniques; and of being current with the relevant scientific literature. To drive this point home, let us reverse the claim. Suppose I where to say of a dentist that they where no more expert at dentistry than the average climate scientists. That would be a resounding condemnation of the dentist. If it were true, they should be barred from practicing on the grounds of incompetence. Yet here you are insisting that actively publishing climate scientists should be considered no more expert than a random list of dentists, doctors, engineers, and other technically qualified people, only one third of whom have PhD's, and whose only known familiarity with the literature is an egregiously false propaganda piece that was deliberately dressed up to appear peer reviewed, complete with fake journal volume and page numbers. And while running this argument, you have the gall to be offended by my comments at 29. The simple fact is, if we want to know whether there is a consensus of the experts on climate science, then the only relevant opinions are those of the experts. And the experts are the actively publishing climate scientists. It is no insult to any other scientist to say they are not as expert in that field as are the actively publishing climate scientists. But it is an outrageous insult to the genuine experts say they are no more expert than any other scientists as you are doing. -
Doug Mackie at 17:01 PM on 17 August 2011OA not OK part 16: Omega
Yes Tor, this is the 'snow line' we wrote of in the post and that Keith restated in his comment. In addition to the links I gave in my comment above, I think Ove did something else on this a while back at SkS (pauses to check) here. (Wow the comments then certainly present, shall we say, an interesting spectrum). -
Tom Curtis at 16:43 PM on 17 August 2011How we know the sun isn't causing global warming
Camburn, comparing Steinhiber et al to Meehl et al, both show a 0.5 W/M^2 rise in insolation between 1900 and the mid-century peak in insolation. Having said that, Meehl et al indicate that to be the rise in forcing, which suggests it is the globally averaged figure, compared to Steinhiber et al's TSI. In that case based on Steinhiber the rise in solar forcing should be 0.125 W/m2. Krivove et al, 2010 show a similar rise. A deficit of 0.385 W/m^2 is certainly large enough to be of interest. That deficit may be compensated for by a stronger usually accepted aerosol forcing. The early twentieth century saw a distinct lack of major volcanoes, resulting in a drop in the normal level of naturally occurring stratospheric aerosols. That would also require a stronger than currently accepted climate sensitivity per doubling of CO2 to balance anthropogenic aerosols. Alternatively, recent reconstructions showing lower variation in TSI could simply be wrong. After all, some recent reconstructions, notably by Shapiro continue to show a large variance in TSI> -
Marco at 16:10 PM on 17 August 2011Joseph E. Postma and the Greenhouse Effect Part 2
Sorry, Chris, I just see more evidence he is one of those "Bozo the Clown"-Galileos. I really think he honestly thinks he is right. Problem is, no one can show him wrong, because he won't accept being wrong. He's right, period. He's Galileo! -
adelady at 16:07 PM on 17 August 2011Climate's changed before
stickybeak, I think you're probably referring to this, Murry Salby Confused About The Carbon Cycle. Not very promising. -
Tom Curtis at 16:02 PM on 17 August 2011How we know the sun isn't causing global warming
scaddenp @72, your first link is a link to Meehl et al 2003 rather than to Svalgaard 2011. -
Stickybeak at 15:55 PM on 17 August 2011Climate's changed before
What if heat causes CO2, which I gather is an emerging theory? -
scaddenp at 15:03 PM on 17 August 2011How we know the sun isn't causing global warming
Camburn, Svalgaard's most relevant is probably this (2011). However, if you put this reconstruction in Meehl, it looks within the uncertainty bands to me. That said it will be interesting to see an update of Meehl with better estimates of all forcings. Someone with more time than me can probably access that from the CMIP5 archive already though it will certainly be part the next IPCC report when it comes out. -
Camburn at 14:44 PM on 17 August 2011How we know the sun isn't causing global warming
DB: Thank you. I am not here to disrupt. That would be crass of me. There are areas of climate science that I feel the science is very good. There are also areas of climate science that I feel the science is not as up to date as it should be. This is one of those areas. I can't read everything, but collectively the knowledge of each can be shared with all. I am looking for additional knowledge. -
actually thoughtful at 14:37 PM on 17 August 2011Joseph E. Postma and the Greenhouse Effect Part 2
Way, way of topic, but I don't know where else to post: I read in the current issue of Discover that a scientist has developed a method of pulling the carbon out of the air using only a small amount of PV and a lot of solar thermal. He ends up with either carbon monoxide or solid carbon. It was presented as a feasible solution to global warming. Am I missing something? Here is the article: http://discovermagazine.com/2011/sep/26-carbon-dioxide-into-bioplastics-2-birds-1-stone -
Camburn at 14:31 PM on 17 August 2011How we know the sun isn't causing global warming
Dr. Svalgaards paper to be published, and it has been accepted, is based on the results of this paper. In his paper, he refines the data of F. Steinhilber,1 J. Beer,1 and C. Fro¨hlich2. TSI reconstruction for Holocene I am not trying to be a pest. If someone has a paper that is based on the newer TSI reconstructions that can show the early 20th century warming I would very much enjoy reading it. -
Camburn at 14:20 PM on 17 August 2011How we know the sun isn't causing global warming
scaddenp: ok.....the paper is based on a TSI reconstruction that does not match any current TSI reconstruction. I am sure the TSI reconstruction was the best available at the time the paper was written. as of late TSI reconstructions, and I don't have the links but I know the names: Svalgaard 2007 Prenminger 2006 Both show flat TSI during the early 20th century. Dr. Svalgaard is coming out/or it might have been published by now a newer reconstruction that re-affirms his previous work. With that in mind, the conclusion of Meehl 2003 is not applicable as they are using solar forcings as part of the bases for the increase in temperature. In the conclusion section of Meehl 2003 they state that the paper re-inforces that solar/ghg and aerosols account for the early 20th century warming. I don't know how to post pictures. I think in my archive I have the TSI reconstruction that Dr. Svalgaard is publishing. It does reflect the current solar max, and flattens the TSI even more in the early 20th century. So scaddenp: The thing that challenges Meehl is that the TSI reconstruction has been updated in peer reviewed papers and would not support his findings. So, I get back to the: what caused the warming in the early 20th century? -
Phila at 13:58 PM on 17 August 2011One Confusedi Bastardi
Camburn, Bastardi said several things that are absolutely, demonstrably untrue. Do you agree that they're untrue? If you don't, please explain why. If you do, please explain why you think he said those things. This doesn't seem like a lot to ask, given that Bastardi's errors are the actual topic of this post. -
Tom Curtis at 13:57 PM on 17 August 2011Murry Salby - Confused About The Carbon Cycle
For those interested in the answer to Dale's question @89, I refer you to CDIAC, and in particular to Boden et al, 1995 which explains the methodology used:"3. CO2 Emission Calculations The methods of Marland and Rotty (1984) were used to estimate the amount of CO2 emitted to the atmosphere from fossil-fuel burning, gas flaring, and cement production. This section briefly summarizes these methods and states some of the assumptions used in these methods [for a complete discussion see the copy of the Marland and Rotty (1984) paper provided in Appendix B]. As indicated earlier, the primary data used to calculate the CO2-emission estimates came from the UNSTAT Database. Fuel production data were used in generating global CO2-emission estimates because these data are more complete than energy consumption data. For regional or national emission estimates, however, one needs to know the amount of fossil fuels consumed in each region or nation, and not the amount produced, to calculate the CO2 emitted. The calculation of CO2 emissions from fossil fuels is conceptually very simple (Marland and Rotty 1984). For each type of fuel, the annual CO2 emissions are the product of three terms: the amount of fuel consumed, the fraction of the fuel that becomes oxidized, and a factor for the carbon content of the fuel (Marland and Rotty 1984). That is, CO2i = (Pi) (FOi) (Ci), (1) where subscript i represents a particular fuel commodity, P represents the amount of fuel i that is consumed each year, FO is the fraction of P that is oxidized, C is the average carbon content for fuel i, and CO2 is the resulting CO2 emissions for fuel i expressed in mass of carbon. For CO2 emissions, fossil fuels can be divided into the usual groups of solid, liquid, and gas fuels. An identical procedure has been adopted by the IPCC in prescribing a methodology for countries to use in estimating and reporting greenhouse gas emissions (IPCC 1995). Global total CO2-emission estimates are generated by using the above equation, where P represents production data from the UNSTAT Database for all primary solid, liquid, and gas fuels. Because secondary fuels are derived from primary fuels, they need not be included."
(My emphasis) Because fuel use data are used in the estimates of global emissions, not energy production data, Dale's expressed concern is unjustified. However, of necessity average values for the various multipliers for different fuels must be used. Along with other factors this leads to an estimated error "from 6 to 10%". That is significant, but it is nowhere near enough to suggest that Humans are not responsible for rapid rise in CO2 concentrations. -
muoncounter at 13:28 PM on 17 August 2011Murry Salby - Confused About The Carbon Cycle
Dale#96: "muoncounter started that train of thought" I did not speculate one way or the other; I offered the flip side of the big 'if' to demonstrate the utter pointlessness of such speculation. This a denier tactic straight out of the pages of FauxNews: the unfounded and meaningless question. Repeat it enough times and it gets picked up as if the content is true. But when all else fails and the argument still isn't going your way, start throwing the good old 'corruption' bombs. Sad, very sad. -
scaddenp at 13:01 PM on 17 August 2011How we know the sun isn't causing global warming
Camburn, can assume that you have seen Meehl 2003? While forcings here are somewhat dated, it should be starting point. What do you mean by "currently accepted" TSI reconstructions? TSI reconstructions are improving all the time, so any modelling is always going to be based on whatever is best published TSI at the time. That said, early 20th Century warming seems to be well within the uncertainties of net known forcings (GHG and aerosols included). Can you be specific about what you think challenges that view? -
bibasir at 12:57 PM on 17 August 2011Joseph E. Postma and the Greenhouse Effect Part 2
You summed it up well. “The incompetence is overwhelming.” -
adelady at 12:53 PM on 17 August 2011Climate Denial Video #3: Polluters Use Same Tactics As Tobacco Industry
"But, since a presumption was made that only climate scientists had the insight and training to understand the nuances of climate change, we can disregard the rest and thereby inflate the end result." Nobody's "disregarding" the rest, they're ranking them. If we're interested in tennis "champions" we would probably count, firstly the winners of Grand Slam events, then those people who've achieved No 1 ranking in the world. Then someone cries, what about Ermintrude Kafloops! She was ranked Number 12 in the world for 8 years straight! What about her?! Obviously, EK was a serious contender, but we're not looking for people who could have been champions. We want the real thing. Same thing for scientists who don't publish in the climate area. They may be contenders, but they don't rank for this purpose no matter how good their work may be in reptile genetics or particle physics. -
Murry Salby - Confused About The Carbon Cycle
Dale - Muoncounter's quote in #90 clearly indicated that such a speculation was nonsense. 'Nuf said. -
Murry Salby - Confused About The Carbon Cycle
Dale - I was attempting to give you the benefit of doubt, to work from the assumption that you were actually interested in discussing the science of climate and climate change, and in this case, critically examining a 'skeptic' argument that appears to be poorly reasoned. Your "UN" conspiracy comment just throws that out the window. If you (or for that matter anyone, in any discussion) starts with the assumption that the majority of people spending their life-work in a science field are lying, there is nowhere for the discussion to go. Personally, I now consider you someone in denial or a troll, and will treat your comments accordingly. -
Dale at 12:35 PM on 17 August 2011Murry Salby - Confused About The Carbon Cycle
[DB] That was just an attempt to derail this thread. Please ignore it. That's it, I'm out. I thank you for the good discussion we had. I'll point out that muoncounter started that train of thought with his implication that business corrupts their emission reporting by reporting less. Yet his comment remains unmoderated. From #90: "it makes just as much sense to speculate that polluters under-report their emissions."Response:[DB] Actually, it was pretty transparent. However, should you wish to abandon the attitude & check the tone at the door and actually enter into dialogue with individuals extremely well-versed in climate science, then you will be welcomed upon your return. In and of itself, SkS is witness to some of the finest science dialogue on the intertubes, (relatively) free of insults and the usual aspersions/comspiracy theories that abound in the usual places. Ciao.
-
Camburn at 12:33 PM on 17 August 2011How we know the sun isn't causing global warming
DB: Why do I ask questions? Because maybe someone can be sure and would share said knowledge. When you look at the currently accepted TSI reconstructions, (which even within those there are substantial variations), none of them show that the early 20th century warming was caused by solar. So, if not caused by solar, what was it caused by? This is important in understanding the validity of the models that are being used in current projections. An aside. If what I wrote was considered an insult, I humbly applogize, and will certainly be more careful in the future and thank you for bringing that to my attention.Response:[DB] Thank you. In the time I've known you, the majority of the time it is obvious that you take the time and care to construct a comment that adds to the discussion. Be the resource here that I know you can be is all I ask.
Prev 1566 1567 1568 1569 1570 1571 1572 1573 1574 1575 1576 1577 1578 1579 1580 1581 Next


