


 Arguments


Recent Comments
Prev 1594 1595 1596 1597 1598 1599 1600 1601 1602 1603 1604 1605 1606 1607 1608 1609 Next
Comments 80051 to 80100:
-
Bibliovermis at 14:21 PM on 26 July 2011Other planets are warming
Christine, This claim that scientists have placed their attention solely on a single variable is wholly incorrect. Please review this site and the primary sources that the articles link to, and consider that you may be doing exactly what you are condemning - finding lots of reasons to support a preconceived notion.Moderator Response: For example, Christine, see "CO2 is not the only driver of climate." -
ChristineSutherland at 13:54 PM on 26 July 2011Other planets are warming
So, many different bodies may have quite different reasons for warming or cooling, and these may be irrespective of solar activity. No argument from me there, as long as climate change on planet Earth is given the same objective analysis and assessment. However scientists, being apparently quite anthropomorphically inclined, have placed their attention on a single variable, "human activity" and of course can then find lots of reasons to support their conclusions. The more likely scenario is that highly-complex and interacting variables are behind warming or cooling of all the bodies in our solar system, and since this occurs both with and without the impact of homo sapiens, we have to consider that our puny contribution may possibly be of no consequence, and that we ought to be continuing our search for understanding of climate change in other directions. -
Tom Curtis at 12:41 PM on 26 July 2011Milankovitch Cycles
Glenn Tamblyn @34 with regard to symmetrical land mass in both hemispheres, you assume that ice sheets will advance at retreat at the same rate. However, you later point out that the albedo effect will increase much earlier in the transition than it will retreat. Therefore, given symmetric hemispheres, if an ice sheet forms in one hemisphere, a point will come when much of the other hemisphere's land mass is snow covered while the ice sheet still exists. The combined albedo should lock the globe into a glacial. Another minor point is that rock generally has a higher albedo than vegetation. The vegetation dissipates the energy differently in that about 10% of it is stored as chemical energy and then dissipated by the plant or animals later on, but the total energy absorbed by the surface is still greater. -
Tom Curtis at 12:25 PM on 26 July 2011CO2 is not a pollutant
davidh @18, regardless of the dictionary definition, "pollution" is not used that way in common language. To take one example, I come from Mount Isa, whose copper ore has a high sulfur content. Consequently the emissions from the smelter had a high sulfur dioxide content, those emissions being traceable as far as the African coast. When the wind was in the right quarter, and weak enough, the sulfur dioxide would be carried into the town with the result that the sulfur dioxide formed into a weak acid when brought into contact with water, as in on the lining of the oesophagus and lungs. For many people that made breathing very difficult, and anything more than very light activity outside a significant health risk. If it rained, the acid was washed down onto plants, killing rose bushes across the town. What it did not do is make anything foul, unclean or dirty. I doubt that anyone would hesitate to call the SO2 pollution. Also from Mount Isa, lead has been periodically released into the environment by a variety of means. Soil containing the lead was indistinguishable from soil not containing the lead other than by chemical analysis. But again, when high levels of lead contamination was found at a local kindergarten, no letters (I am sure) where sent to the paper saying it was not lead pollution because it did not make the soil "foul or unclean, or dirty". One final example, also from the mines, in which ventilation was a major issue. One reason for that was to prevent the build up of carbon monoxide, which is famously a colourless, odourless gas, and hence by definition not foul, unclean or dirty. It also kills, so again I doubt anyone would hesitate to call it pollution. More fundamentally, the important definition in this case is not the Macquarie Dictionary definition, but the legal definition. So, whether you go with New South Wales and say an act of polluting is:"an offence of waste disposal if committed without lawful authority, wilfully or negligently, in a manner that harms or is likely to harm the environment (s. 5)"
or with Victoria, and define it as:"where a person intentionally, recklessly, or negligently pollutes the environment or causes or permits an environmental hazard which results in: · a serious threat to the environment; · a serious threat to public health; · a substantial risk of serious damage to the environment; · a substantial risk of a serious threat to public health."
CO2 is a pollutant. That it is a waste product can hardly be argued, and that it poses a significant threat to the survival of the Great Barrier Reef, and hence "a substantial risk of serious damage to the environment" is well established. The insistence that we not use perfectly accurate descriptive words because deniers don't like the connotations is Orwellian in a quite literal sense. It is an attempt to make thinking about the issue difficult by controlling the language used to do so. -
muoncounter at 12:23 PM on 26 July 2011CO2 is not a pollutant
davidh#18: "connotations that don't really make sense in the case of CO2 as a greenhouse gase." You make an elegant argument; however, if you view CO2 as a waste product of fossil fuel consumption, the unregulated dumping of said waste into the open air would seem to fit your #1 definition of the verb 'pollute.' -
Glenn Tamblyn at 11:53 AM on 26 July 2011Milankovitch Cycles
My understanding of the assymetry of the continents is that if they are symmetric, changes in insolation between NH and SH will cancel out in terms of any Albedo change - ice retreats in one hemisphere as it expands in the other so that the net Albedo change due to Milankovitch alone is much closer to zero. WRT early snow melt yes, that would occur during the early stage of the warming. But then the feedback available from albedo change would slow as the system waits for the ice sheets to recede. In contrast, increased snow range during the cooling phase is a factor that would cut in early but then not suffer a later lag since snow can just keep extending without needing ice sheets to form first. So Albedo change due to snow/ice is likely to be a stronger early driver during the cooling phase but more of a lagging driver during the warming phase. As for exposed rock & vegetation, the initial positive feedback is strong due to the rock being exposed. Later - perhaps 1000's of years, the albedo effect from this is somewhat reversed as vegetation replaces rock. Also at this point there is a negative feedback, opposing Oceanic CO2 outgassing as this new biomass soaks up CO2. Then during the cooling phase, it is unlikely to be the exact reverse. Snow extends, killing off vegetation but without an intermediate bare rock phase. Also, die back of all that dying vegetation is then a carbon source, opposing the uptake of CO2 by cooling oceans. So compare these patterns to the glacial cycles. Early warming - Milankovitch, CO2 (and perhaps Methane from melting permafrost) and early snow melt. Mid to late stage warming - ice retreat and exposed rock. Late stage warming, more ice retreat but diminishing impact as spherical geometry cuts in and slowdown of CO2 increase due to its logarithmic forcing and growth of vegetative biomass. Then early cooling - Milankovitch, more snow. Mid cooling -even more snow, spherical geometry startiong to make this more effective, cooling oceans so CO2 drawdown but also compensating CO2 release from dying vegetation. Late stage cooling - Biomass has returned to previous levels, CO2 drawdown increases so CO2 starts to become a more potent late stage driver. So simplistically, CO2 as larger early stage driver during warming with Albedo change cutting in more strongly at the end. And Albedo change is the stronger driver during early cooling with CO2 coming in more strongly at the end. And this matches the Ice Cores. During warming CO2 is closely coupled to temps. During cooling, particularly the 1st half, much less so. This would only be a general picture since there are a lot of other wrinkles - how and how fast ocean currents change for example. And no two glacial cycles from the cores are exactly the same. But within the limits of what we can quantify the ice cores certainly seem to behave substantially as we might expect. -
Philippe Chantreau at 11:50 AM on 26 July 20112nd law of thermodynamics contradicts greenhouse theory
I am aware of the pattern KR. To my knowledge, nobody has ever been banned from SkS. Damorbel's actions, so transparent and so consistent over time, have certainly earned him the right to set a precedent in the matter. However, considering how John has conducted this site so far, I doubt that he will do that; yet we will continue to endure the whining of pseudo-skeptics about being silenced when nonsense is called out. In thermodynamics, by respect to energy and entropy, we "can't win." It seems to be like that too in the parody of debate maintained by pseudo-skeptics.Response:[DB] In the spirit of transparency, a select few have "crossed the line". Damorbel may yet indeed set a precedent; that remains to be seen. As an alternative, I earlier proposed "Damorbel's Law", for those who wish to consider it.
-
Keith Hunter at 11:27 AM on 26 July 2011OA not OK part 10: Is the ocean blowing bubbles?
I can't resist adding that if ocean outgassing were the source of the rise in atmospheric CO2, then the pH of the surface ocean would be increasing. It's not, it's decreasing, as shown by several time series. -
davidh5040 at 11:25 AM on 26 July 2011CO2 is not a pollutant
I'm going to talk about semantics for a moment, so if you are only interested in the science, then skip over this… I think it is important to understand why someone might object to the term pollutant. The argument might go like this: 1) I am more likely to rely on a dictionary to get my definitions, rather than US legislation or the Encyclopedia Britannica. 2) I am in Australia, so I would usually refer to the Macquarie Dictionary as the authoritative source. Their definition for pollute is: 1. to make foul or unclean; dirty. 2. to make morally unclean; defile. 3. to render ceremonially impure; desecrate. 3) These senses of the word have connotations that don't really make sense in the case of CO2 as a greenhouse gase. 4) Thus the use of the word pollutant could appear to be imprecise and/or an attempt to use the fallacy of "loaded language" in order to persuade. For many, this might seem like hairsplitting to distract from more substantive issues. However, I object when I see contrarians using language that I consider imprecise or loaded, so I think it fair to listen when they make the same charge. I'd suggest that if we can make the case without describing CO2 as a pollutant, then it is probably worth doing so (both as a courtesy, and also to avoid getting diverted into a semantic debate). If we do use the word pollutant, then we should preface this by an explanation of where our definition is coming from. -
scaddenp at 09:47 AM on 26 July 2011Wakening the Kraken
The important point I think though is comparison with clathrate gun hypothesis. This assumes that ocean warming takes hydrates out of stable phase, which further warms ocean, which then destabilizes more hydrate etc. By comparison, mining proposal I have seen involve hydrates in cold ocean sediment, nowhere near being destabilized, and being mined by hot water injection with some trapping device (and the trick is in the trapping device). What I cant see is a mechanism by which this process could become self-sustaining without the hot water injection. -
John Hartz at 09:31 AM on 26 July 2011Rising Oceans - Too Late to Turn the Tide?
This article is a repost of a Univ. of Arizona news release about the paper: "The role of ocean thermal expansion in Last Interglacial sea level rise", Nicholas P. McKay, Jonathan T. Overpeck,and Bette L. Otto‐Bliesner Received 25 May 2011; revised 7 June 2011; accepted 9 June 2011; published 21 July 2011. GEOPHYSICAL RESEARCH LETTERS, VOL. 38, L14605, doi:10.1029/2011GL048280, 2011 -
Tom Curtis at 09:09 AM on 26 July 2011China, From the Inside Out
Agnostic @89, my assumptions are: 1) Global warming needs to be limited to a 2 degree C increase to have a reasonable chance to avoid catastrophic consequences of global warming. That is science based (PDF). 2) Total CO2e emissions to 2050 need to be limited to 1000 Gigatonnes of CO2e to have a reasonable (75%) chance of avoiding a greater than 2 degrees C increase in global temperatures. That is certainly science based. 3) A limit on total emissions makes the right to emit a scarce good within the technical meaning of the term of economics, and hence such a right has an economic value. That is not a science based assumption. Rather, it is one of the fundamental assumptions of economics, which I can presume to be a reasonably objective discipline. If you wish to reject all of modern economic theory, as you would have to to reject this assumption, please let us know. 4) Given an economic value of a good, you can make a preference ranking of any free assignment of those goods based on the quantity assigned to each person. If an unequal assignment is considered preferable, that represents a greater preference for the well being of the person or persons receiving the greater quantity of goods, with the level of preference being given by the quantity of goods assigned/ the average value of goods assigned across the population. (4) follows straight forwardly from decision theory. It has, however, been widely rejected by some people. In particular, Marxists have rejected the notion, instead maintaining a principle of "From each according to his ability, to each according to their need." Adherents to the free market, on the other hand, recognize that some people have greater need for certain goods, and that utility will be maximized of an assignment based on need is achieved. However, they maintain that the utility maximizing assignment is best achieved by free exchange. In that case, an unequal initial assignment will always be reflected in unequal final utility after exchanges have taken place, and hence represent a differential valuation of individuals if the initial assignment is deliberately chosen as a matter of policy. Hence (4) follows straight forwardly from decision theory and adherence to the free market. Again, if you would rather accept Marxism, please let us know. So, while my "assumptions" are not exclusively based on science, they are based science, two soundly based formal disciplines, and a foundational assumption of western societies (however inconsistently applied by many). I don't know what your assumptions are based on, but their consequences are to value citizens of the West, and in particular of the US more highly than citizens of other nations, and in particular of the third world. I have seen many argue that such a valuation should be the approach of any national government. I disagree, but I doubt that is relevant. What is relevant is that you cannot rationally expect the Chinese government to value US citizens more highly than its own; and therefore cannot rationally expect them to accept an agreement that effectively does so. Therefore negotiating on a basis that implicitly does exactly that is to doom the negotiation to failure. Consequently the choice for rational governments is simple. If you want to solve the global warming crisis through international agreement (and it is difficult to see any other means), then the basis of negotiations must be on equal per capita emissions rights. For practical purposes, those rights must be tradable. -
Tom Curtis at 08:13 AM on 26 July 2011Michaels Mischief #1: Continued Warming and Aerosols
Eric the Red @7, and following, the correct way to compare recent short trends to the long term trend is to use the procedure Tamino illustrates here with GISS data: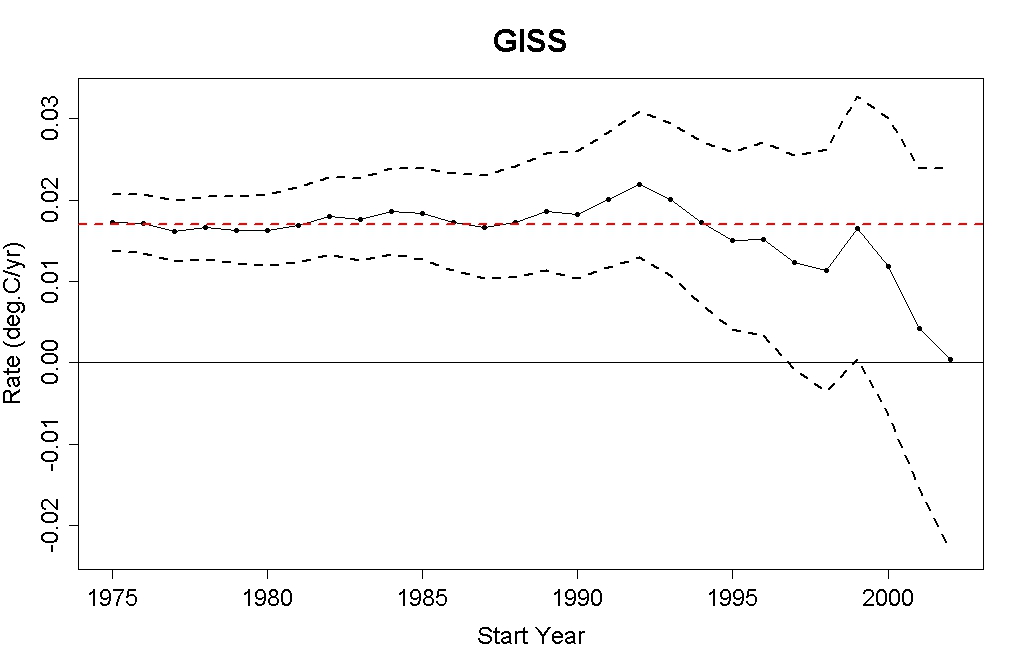 The solid line is the trend from the given year to the present (June 2011). The two dashed lines show the bounds of statistical significance (95% confidence). If neither bound crosses the long term trend line (red dashed), speculation about a change in the long term trend is just that, speculation, and is not based on substantive evidence.
-
Tom Curtis at 08:04 AM on 26 July 2011Wakening the Kraken
scaddenp @43, if the clathrates are mined without leakage, there impact on the global warming will be in the form of emitted CO2, and hence much smaller than for the clathrate gun hypothesis. But you have to wonder how the leakage rate will be kept small, and how that would even be measured if their is significant leakage in the mining process. And even in the event that leakage is curtailed, it is likely that this is an energy intensive means to get natural gas. That means the whole fuel cycle CO2 release per ton of methane from clathrates will likely be higher than that from conventional gas fields. So I believe concern is appropriate. On the other hand, for mining clathrates to be as bad as the spontaneous release of clathrates, near 100% leakage would need to apply, making the venture commercially unviable. -
Eric the Red at 07:56 AM on 26 July 2011Michaels Mischief #1: Continued Warming and Aerosols
Dave and Kevin, I think we are in agreement about the long term trend. There are periods of higher trends, lower trends, and flatness. However, long term, the trend has not deviated significantly. When you compare the most recent years, you will see that they do not deviate. My point earlier, was than if there was a deviation, then it should be evident when compared to the long term trend. -
scaddenp at 07:24 AM on 26 July 2011Wakening the Kraken
Okay, so I am in the industry and may be biased but I think the risks here are somewhat overstated. In terms of GHE, its same as natural gas. While much is made of the narrow stability zone for hydrates, how do you propose that the instability zone is propogated from where the hydrates are mined (and trapped) to area where methane would be released and how would such a process be sustained? -
scaddenp at 07:10 AM on 26 July 2011Milankovitch Cycles
"bare rock is slowly converted to soil and biomass." This is a negative feedback (removing carbon), but the vegetative changes have a more direct effect of decreasing albedo especially with forest expanding into tundra, which is a quite rapid change in this context. And of course this change is much more pronounced in the NH cf to the south. -
Riduna at 07:10 AM on 26 July 2011China, From the Inside Out
Tom Curtis @ 88 Your assumptions are entirely wrong and hardly science based. Thank you for your views. -
Dave123 at 06:54 AM on 26 July 2011Michaels Mischief #1: Continued Warming and Aerosols
Kevin, exactly. One can go back in the the recent historical data and find many periods of "flatness" comparable to what is claimed now. Yet, mysteriously (not so mysteriously) the longer term trend is stili inexorably upwards. -
Doug Mackie at 06:37 AM on 26 July 2011OA not OK part 10: Is the ocean blowing bubbles?
@Byron, we are getting a little ahead of the rest of the series. Hold on for a few more posts and then we can go over any gaps. -
Doug Mackie at 06:35 AM on 26 July 2011OA not OK part 10: Is the ocean blowing bubbles?
@jyyh: Not for the first time your comment seems to be missing words. Can you clarify what your point is (or if there is one)? Are you asserting that volcanic emissions are a major source of CO2 in either the atmosphere or the ocean? If so it is plain you have not read (or understood) the post. -
kevin s at 05:58 AM on 26 July 2011Michaels Mischief #1: Continued Warming and Aerosols
It looks like Rob Honeycutt already made this point using UAH monthly data, but here's a simple illustration that anyone can check out for themselves: Take a look at a graph of a good global temperature record--I used the GISS land/ocean index, but any good record should work. While looking at the graph, imagine using the "compare the most recent data to the trend" method in various years. For example, imagine it's 1986, and you want to compare the past few years of data--let's say five--to the trend. Did that give you any useful information about the future? Do the same exercise again, only pretend it's 1999, so your "most recent data" is 1993-1998. Did that give you any useful information about the future? I think that the only thing you get from comparing a short segment of noisy data to the statistically significant trend...is a first-hand appreciation of how useless it is to do such a thing. That's more obvious when you use it on archival data--where you can see right away that the fluctuations turned out to be noise--than it is when you're doing it on current data, hot off the presses. But it's every bit as true regarding the current data, and even more important to be aware of, lest you get carried away with all sorts of wrong ideas. -
Byron Smith at 05:31 AM on 26 July 2011SkS Weekly Digest #8
Just wondering whether the cartoon in this post falls foul of the comments policy stating no rants about politics. There are plenty of very funny and insightful political cartoons out there, do we need this one here?Response:[DB] Don't believe it fits the definition of a rant. A lament, sure.
The logo splash at the start is kinda cool.
-
kevin s at 05:30 AM on 26 July 2011Michaels Mischief #1: Continued Warming and Aerosols
"When you use such short time frames, all sorts of crazy statistics can appear." - Yes! Using of too-short time frames with noisy data can lead to misleading conclusions. "Selective use of statistics to bolster ones view is not a good scientific approach." - Yes! Absolutely correct! The light has been seen! "Best is to use a long term trend (with good statistics), and then compare the most recent data to that trend." - Oh...oh, never mind. Eric the Red, your whole comment up until the last half of the last sentence demonstrates the problem with what you advocate in the last half of the last sentence. Try to "compare the most recent data to the trend," and unless your "most recent data" includes enough for a test of statistical significance, you have EXACTLY the problem of "all sorts of crazy statistics can appear" with "such short time frames." -
Rob Honeycutt at 04:17 AM on 26 July 2011Michaels Mischief #1: Continued Warming and Aerosols
Eric... You still get into trouble comparing recent data with the long term trend because the variation in the data exceeds the trend by such a large amount. Even just look at UAH monthly variation. Just in the past couple of years it's ranged from -0.4 to +0.5 (approx) while the long term trend is still in the range of 0.15C/decade. Variation exceeds the trend by a factor of something like 6 (rough guess). What I always find more compelling is the fact that we have still yet to see any statistically significant cooling. The skeptics go on and on about no apparent warming but neglect to point out that they also don't see any cooling anywhere even at the end of a long 30 year warming trend. -
CBDunkerson at 03:50 AM on 26 July 2011Wakening the Kraken
Seriously? It isn't bad enough that we might accidentally release carbon long sequestered in methane clathrates into the atmosphere. Now we're going out and doing it deliberately. -
Eric the Red at 03:38 AM on 26 July 2011Michaels Mischief #1: Continued Warming and Aerosols
When you use such short time frames, all sorts of crazy statistics can appear. Adjust your starting date forwards or backwards one year, and the CRU trend changes from 0.11C / decade to 0.00C / decade. Selective use of statistics to bolster ones view is not a good scientific approach. Best is to use a long term trend (with good statistics), and then compare the most recent data to that trend. -
caerbannog at 03:22 AM on 26 July 2011Michaels Mischief #1: Continued Warming and Aerosols
If Michaels weren't so disingenuous, he'd acknowledge that you don't need *any* of the CRU's supposedly "destroyed" raw data to confirm that the global-warming trend is very real and is quite in line with the CRU's (and NASA's, and NOAA's) results. I know that I've put up a number of posts here pounding on this basic theme, but it's important enough for new visitors/lurkers to see this that I don't think that the "old timers" here will mind too much if I pound on it yet again. 1) All of the publicly-available *raw* temperature data needed to do perform your own verification of the NASA/NOAA/CRU global-average temperature results are available at the NOAA/GHCN data repository. 2) The basic algorithm used to compute global-average anomalies is straightforward and well-documented. There are many variations on this basic procedure, but just the basic procedure (without any of the extra fancy stuff that the NASA/NOAA/CRU folks do) will still produce global-average temperature estimates very much in-line with the pros' results. 3) All of the software-development tools needed to put together your own "hand rolled" global-average anomaly program are freely available for anyone to download and use. Some time ago, I wrote up a program that implements the simplest, most basic version of the global-average temperature anomaly algorithm, and then ran GHCN *raw* data through it. And once again (for those who haven't already seen this), here is a plot showing how my results compare with NASA's official "Meteorological Stations" results. The bottom line is, it does not matter how you slice and dice the global temperature data -- if you don't completely screw things up, you'll get results very similar to the results that the "pros" get, whether or not you have access to the CRU's supposedly "destroyed" raw data.
The deniers who have been attacking the climate-science community's global-temperature work know (or should know) this. The fact that they have continued with attacks like this indicates to me that they are incompetent or dishonest (that's an inclusive "or" btw...).
Moderator Response: [RH] Readjusted width. Please keep images down to 450 so that it doesn't break the page formatting. Thx.
The bottom line is, it does not matter how you slice and dice the global temperature data -- if you don't completely screw things up, you'll get results very similar to the results that the "pros" get, whether or not you have access to the CRU's supposedly "destroyed" raw data.
The deniers who have been attacking the climate-science community's global-temperature work know (or should know) this. The fact that they have continued with attacks like this indicates to me that they are incompetent or dishonest (that's an inclusive "or" btw...).
Moderator Response: [RH] Readjusted width. Please keep images down to 450 so that it doesn't break the page formatting. Thx. -
Robert Murphy at 03:19 AM on 26 July 2011Michaels Mischief #1: Continued Warming and Aerosols
"Robert - no, according to HadCRUT the trend is 0.08°C per decade since 1996" OK. I was thinking of Phil Jones who said the trend was .12C/decade from 1995 thru 2009, so I assumed the trend didn't change much from 1996 through present. Just another example of how changing the start year can make a big difference when dealing with small sample sizes. -
KR at 03:13 AM on 26 July 20112nd law of thermodynamics contradicts greenhouse theory
Philippe - This has been a pattern with damorbel from the beginning. When a bit of nonsense is firmly refuted, he skips to the next argument in a Gish Gallop. The original bit of nonsense will then re-emerge weeks later, perhaps to a different visitor, in a sort of never-ending zombie manner. And damorbel has shown no compunctions against contradicting himself, if it continues the argument. I've yet to see actual discussions of science with this poster - just arguments. DNFTT. -
Eric the Red at 03:04 AM on 26 July 2011It's the sun
gcdem, The solar cycle has nothing to do with the Southern (especially Texan) drought. The main culpret has been the strong La Nina. Areas to the north experienced above normal precipitation (rain and snow), whereas southern areas were rain-starved. Similar occurrances accompanied past strong La Ninas, many of which were more severe than the current situation, particularly the mid 1950s. http://www.cpc.ncep.noaa.gov/products/expert_assessment/seasonal_drought.html -
dorlomin at 02:41 AM on 26 July 2011Michaels Mischief #1: Continued Warming and Aerosols
An aerosol spreading confusion? Sounds like Michaels. -
dana1981 at 02:40 AM on 26 July 2011Michaels Mischief #1: Continued Warming and Aerosols
Robert - no, according to HadCRUT the trend is 0.08°C per decade since 1996 (0.12°C total). It's nearly twice that (0.15°C per decade) according to GISTEMP though. Paul - the Forbes family (specifically Steve Forbes, I believe) own the magazine. -
Paul Magnus at 02:33 AM on 26 July 2011Michaels Mischief #1: Continued Warming and Aerosols
Forbes is well know for its anti GW bias. Is it owned by Murdoch? -
Byron Smith at 02:28 AM on 26 July 2011OA not OK part 10: Is the ocean blowing bubbles?
Thanks Doug, that is very helpful. A further question: If the ocean as a whole remains a carbon sink but some areas are a carbon source, what are the local conditions that contribute to the latter? Is it more common in certain parts of the globe? Do these areas shift significantly over time or are there long term patterns certain areas being sources? -
gcdem at 02:23 AM on 26 July 2011It's the sun
Great Post! It's 2011, and we in the US are in the middle of another Summer heat wave and severe drought. I used a few arguments from this post to totally debunk someone in my office who was trying to use the "11-year solar cycle" argument to explain this drought. -
Robert Murphy at 02:10 AM on 26 July 2011Michaels Mischief #1: Continued Warming and Aerosols
"the average surface temperature has warmed 0.12°C since 1996" Shouldn't that be .12C/decade? -
jyyh at 01:56 AM on 26 July 2011OA not OK part 10: Is the ocean blowing bubbles?
the resident 'skeptic' asks of the volcanos present somewhere them earth scientists haven't looked and points to http://www.skepticalscience.com/volcanoes-and-global-warming.htm -
muoncounter at 01:51 AM on 26 July 2011The Medieval Warm(ish) Period In Pictures
More bad news from the Sargasso Sea: The graph shown in the source cited in #28 (Bluemle), attributed as 'modified' from Keigwin's original work, is really the misrepresentation done by Art Robinson, Sallie Balliunas and Willie Soon (originally published in 1998 by that prestigious climate source, the Journal of American Physicians and Surgeons; apparently they liked it so much they published it again, under the same title, in 2007). The lower panel in this composite is the version in Bluemle; the upper is Robinson. Neither contain all of the data published by Keigwin 1996.
This is clear-cut scientific dishonesty, yet the meme lives on. Olson's work is a must-read.
The lower panel in this composite is the version in Bluemle; the upper is Robinson. Neither contain all of the data published by Keigwin 1996.
This is clear-cut scientific dishonesty, yet the meme lives on. Olson's work is a must-read.
-
Philippe Chantreau at 01:15 AM on 26 July 20112nd law of thermodynamics contradicts greenhouse theory
Damorbel, your attempts at distracting from your poor comprehension of the subjects on which you would pretend to comment, and even lecture, are amusing. I note that you fail to defend your IR photon thermometer/temperature of the source idea; not suprising, since it is not defensible. "thermodynamics is rather complicated" Well, it's not so bad, really. Reflect on the following long and deep and you will eliminate a lot of the confusion that has been plaguing you during this astoundingly tedious exchange: You have to play. You can't win. You can't break even. That's enough for anyone to understand thermodynamics better than what transpires from your comments. -
muoncounter at 01:10 AM on 26 July 2011Rising Oceans - Too Late to Turn the Tide?
Ger#23: "What will be the effect of the rising pressure of the sea on the lower agricultural grounds?" Some chilling pictures of the effect on agriculture in Kiribati, on the front lines of sea level rise, are available here. Some chilling words from coastal Germany, Sterr 2008: Although additional investment in flood and erosion protection will be considerable (estimated at more than 500 million US$) this seems manageable for the national and regional economies. On the other hand, hard coastline defence and accelerated sea-level rise will increase “coastal squeeze” on the seaward side, endangering important coastal ecosystems such as tidal flats (Wadden Sea), saltmarshes, and dunes. Currently there is no strategy to remedy this increasing ecological vulnerability. --emphasis added Isn't it good to hear that there's no strategy? -
muoncounter at 00:55 AM on 26 July 2011Gripping video of Arctic sea ice melting away before your eyes
Badgersouth#15: "The negative consequences that melting Artctic sea ice is having, and will continue to have, on the ecology of the Earth are many" And this can't be good. A single-celled alga that went extinct in the North Atlantic Ocean about 800,000 years ago has returned after drifting from the Pacific through the Arctic thanks to melting polar ice. And while its appearance marks the first trans-Arctic migration in modern times, scientists say it signals something potentially bigger. -
DSL at 23:43 PM on 25 July 2011Rising Oceans - Too Late to Turn the Tide?
Ianash, if I extend the trend in the historical data, my best guess is "no." However, we can't rule out an anomalous response (hope, of course, being required for despair). -
Ken Lambert at 23:27 PM on 25 July 2011Trenberth on Tracking Earth’s energy: A key to climate variability and change
Dear Dr Trenberth Very good of you to respond to comments on this thread. Could I draw your attention of a very detailed discussion from a SKS thread entitled "Robust Warming of the Global Upper Ocean" found here: http://www.skepticalscience.com/news.php?p=2&t=78&&n=202 Posts by Berényi Péter at #6, #30, #40, #45, #72 are of interest as well of a few of my lesser efforts at #24, #43, #60, #67. Berényi Péter at #30 in the above says: "TOA imbalance is extremely important. Below is satellite measurement for the last ten years: (see chart) These measurements have low accuracy but reasonable precision. It means that the curves above have an arbitrary offset (within several Wm-2), but would show a marked level change whenever accumulation rate of thermal energy changes in the climate system. Nothing like that is seen between 2002-2004. Therefore either satellite data are absolutely useless or the 6-8×10²² J heat accumulation in the oceans after 2000 followed by a more or less level plateau from 2004 on is an artifact due to transition to ARGO. There is no other possibility. Net TOA radiative imbalance should be very nearly identical to the temporal derivative of OHC, because there is no heat storage capacity in the climate system comparable to the oceans and all energy exchange between Earth and its environment is mediated by electromagnetic radiation (any other forms of energy transfer, e.g. tidal breaking are many orders of magnitude smaller)." What I call the 'step jump' in OHC in the 2002-04 period is not reflected in satellite measurements of TOA imbalance and this strongly suggests that the 6-8E22 Joules of increase in OHC is an artifact of the XBT-Argo transition. Linearizing the OHC charts including this step jump from 1993 to 2010 giving the equal of 0.5-0.6W/sq.m TOA imbalance is therefore invalid. Could you comment on this issue? -
CBDunkerson at 22:12 PM on 25 July 2011Water vapor is the most powerful greenhouse gas
On another thread Ken wrote: "When Water Vapor is included as a GHG, it represents 95% of the GHGs." Water vapor represents about 0.4% (or 4000 ppm) of the total atmosphere. CO2 is at about 395 ppm currently. The other greenhouse gases are all measured in parts per BILLION or less and thus disappear in the rounding. Based on these numbers water vapor molecules would account for about 91% of all greenhouse gas molecules. The warming impact of water vapor obviously varies by location (i.e. not much in deserts, rather alot in humid areas), but on average it represents 36% (if we exclude water vapor impacts which would also be caused by other GHGs) or 72% (if we exclude impacts by other GHGs which would also be caused by water vapor) of the total greenhouse effect. Thus, I'm not clear where your figure of "95% of the GHGs" comes from. The closest is the 91% of total molecules figure... but that value has no direct relevance to the warming impact you were referring to in your post. -
Tom Curtis at 21:59 PM on 25 July 20112nd law of thermodynamics contradicts greenhouse theory
damorbel @1109, it is rather more important to keep clear about the content of the physical laws you are appealing to, something you continually fail to do. But your just keep on plugging away drawing attention to the use of a metaphor as a substitute for actually learning the topic on which you expound so frequently. -
Bob Lacatena at 21:57 PM on 25 July 20112nd law of thermodynamics contradicts greenhouse theory
1107, damorbel, Your obsession with semantics and word choice is crippling you. The rest of us understand exactly what is meant by "diffusion," "transfer" and "flow" without the need to apply only certain terms to gases, solids or fluids... as do the learned men who wrote the referenced papers and used those terms to begin with. You have a whole lot of studying to do before you can contribute to a discussion like this. In particular, I suggest that you try to get away from what you think you know and understand (traditional thermodynamics) and begin to study more modern quantum and molecular level physics and radiative transfer (or diffusion or flow or emission/absorption for whatever term you'd like to use). Until you do, you're trying to both understand and argue from a too limited perspective. You're like one of the blind men trying to describe an elephant.So oft in theologic wars, The disputants, I ween, Rail on in utter ignorance Of what each other mean, And prate about an Elephant Not one of them has seen!
-
damorbel at 21:55 PM on 25 July 20112nd law of thermodynamics contradicts greenhouse theory
Re #1108 Dikran Marsupial, you wrote:- "Speaking of heat flow does not necessarily imply adherence to caloric thory" I know that too. But thermodynamics is rather complicated so it is essential to be quite certain of the meaning of words. There is all the difference in the world between processes involving transport of fluids and diffusion in solids. The 'flow' problem is not the only one. Frequently diagrams are drawn shoing the GHE where the authors do not distinguish betwen the reflection (as with a mirror) and the absorption/emission of radiation. These two processes are completely different, it isn't possible to even think of a CO2 GH effect unless the two processes are clearly separated.Moderator Response: [Dikran Marsupial] In that case, as you know that nobody in the discussion is talking about caloric theory when they speak of "flow", any further mention of "caloric" on this thread is off-topic and will be deleted, likewise any further general discussion on the meaning of the word "flow". As you apparently recognise that "flow [of heat]" is being used as a metaphor for "transfer [of energy]" this should be no hurdle to communication. -
Dikran Marsupial at 21:40 PM on 25 July 20112nd law of thermodynamics contradicts greenhouse theory
damorbel Speaking of heat flow does not necessarily imply adherence to caloric thory. One can talk metaphorically about there being a flow without the supposed existence of a fluid. For instance in information theory it is perfectly reasonable to talk of the flow of information through a channel, but information isn't carried by a fluid. It is just a metaphor. -
Tom Curtis at 21:37 PM on 25 July 2011Gripping video of Arctic sea ice melting away before your eyes
Dan Olner @16, personally I enjoyed seeing the sun "bounce" without going below the horizon.
Prev 1594 1595 1596 1597 1598 1599 1600 1601 1602 1603 1604 1605 1606 1607 1608 1609 Next


