


 Arguments


Recent Comments
Prev 1738 1739 1740 1741 1742 1743 1744 1745 1746 1747 1748 1749 1750 1751 1752 1753 Next
Comments 87251 to 87300:
-
Rob Honeycutt at 11:59 AM on 14 May 2011Lindzen Illusion #7: The Anti-Galileo
Camburn... Neither is a complete idiot but one of them is blatantly obfuscating the science. How can anyone claim to believe that climate sensitivity is low (as low as Lindzen claims) when all the other research on that issue turns up directly contradictory evidence? -
drrocket at 11:57 AM on 14 May 2011CO2 has a short residence time
Stephen Baines, 5/14/11, 01:09 AM CO2 residence time How do you know that 'Anthropogenic' (notice how they use quotation marks) fluxes simply refer to the change in rates that has occurred because pCO2 in the atmosphere has increased and land use changes have occurred. Do you have a citation from IPCC or an IPCC reference? You seem to put a lot of stock in the fact that IPCC put anthropogenic in quotation marks for Figure 7.3. It also wrote "'natural' fluxes". What does that lead you to conclude? In another context, IPCC said, Collins et al. (2002) calculated indirect GWPs for 10 NMVOCs with a global three-dimensional Lagrangian chemistry-transport model. Impacts on tropospheric ozone, CH4 (through changes in OH) and CO2 have been considered, using either an ‘anthropogenic’ emission distribution or a ‘natural’ emission distribution depending on the main sources for each gas. AR4, ¶2.10.3.3 Non-methane Volatile Organic Compounds, p. 214. Here IPCC appears to employ quotation marks because the data are synthetic, drawn from calculated emission distributions. This is a likely reason for offsetting the same words in the caption to Figure 7.3. Between the TAR and AR4, IPCC uses the word anthropogenic 1,799 times (including indices, references, tables of contents), but only in these two instances is it offset quotation marks. Without using quotation marks, IPCC says, About 80% of anthropogenic CO2 emissions during the 1990s resulted from fossil fuel burning, with about 20% from land use change (primarily deforestation) (Table 7.1). Almost 45% of combined anthropogenic CO2 emissions (fossil fuel plus land use) have remained in the atmosphere. AR4, ¶7.3.1.2 Perturbations of the Natural Carbon Cycle from Human Activities, pp. 514-15. In case you might want to start relying on numbers, the first sentence supports the land use change of 1.6 GtC/yr out of a total ACO2 of 8 GtC/yr per Figure 7.3. Note that 45% of ACO2 has remained in the atmosphere. Why the restriction to ACO2? The chart has (8-4.6)/8 = 40% remaining in the atmosphere. Maybe the quotation marks account for the discrepancy. Meanwhile the chart has 0/191.2 = 0% of "'natural' flux" remaining in the atmosphere. You claim to the contrary, When pCO2 increased over preindustrial, there was an increase in net CO2 flux into the ocean. … There is nothing special about anthropogenic carbon. The IPCC graph does not imply in anyway that there is. Why didn't that increase in pCO2 affect both ACO2 and nCO2 since the dawn of the industrial era? Regardless of your rationale, that IPCC treats the flux of nCO2 quite differently than it does ACO2 is inescapable. -
Camburn at 11:25 AM on 14 May 2011Lindzen Illusion #7: The Anti-Galileo
DB: Yes, we are in a sunspot cycle, But as far as a deep solar minimum?......not even close. Yes, if you look only at sunspots. However, there is a lottttt more going on in the sun than just spots. 2010 was only close to a warm year using GISS data. Other data sources are not nearly as close. The decade of 2001-2010 was warm, but on a climatic basis was certainly not out of the ordinary. Some folks who post here see things as black and white. The actual science is not nearly as black and white if you read papers with an open mind. I guess I don't like the tone concerning Lindzen, just as I would not like the tone concerning Hansen if the same were done to him. Both have made errors, but neither one is a climate idiot.Response:[DB] "Yes, we are in a sunspot cycle, But as far as a deep solar minimum?......not even close."
Sunspots show this:

"Yes, if you look only at sunspots. However, there is a lottttt more going on in the sun than just spots."
Uh-huh; how about TSI vs temperature:

"2010 was only close to a warm year using GISS data. Other data sources are not nearly as close."
Per the UK Met Office:
With a mean temperature of 14.50 °C, 2010 becomes the second warmest year on record, after 1998. The record is maintained by the Met Office and the Climatic Research Unit at UEA.
Earlier this month, in the US, NASA's Goddard Institute for Space Studies and NOAA's National Climatic Data Center announced that the past year is either warmest or equal-warmest on their respective records.
So HADCru, GISS and NASA say you're wrong.

"The decade of 2001-2010 was warm, but on a climatic basis was certainly not out of the ordinary."
Over the ten years from 2001 to 2010, global temperatures have averaged 0.46°C above the 1961-1990 average, and are the highest ever recorded for a 10-year period since the beginning of instrumental climate records.
And per Phil Jones:
Speaking about the figures, Professor Phil Jones, Director of Research at the Climatic Research Unit of the University of East Anglia said: "The warmest 10 years in all three datasets are the same and have all occurred since 1998. The last 10 years 2001-2010 were warmer than the previous 10 years (1991-2000) by 0.2 °C."
"The actual science is not nearly as black and white if you read papers with an open mind."
Ignoring the crass insinuations you make, and the equally crass responses that spring to mind unbidden, having an open mind doesn't mean letting your brain fall out. The true skeptic challenges his own ideologies and presumptions before challenging others'.
-
Camburn at 10:37 AM on 14 May 2011Lindzen Illusion #7: The Anti-Galileo
One thing is pointedly clear. The realiability of the underlying data concering the h20 vapor is in need of improvement. All the papers cited verify this. You can pick and choose which paper you want to consider credible as to their determination. But you can not argue that the results have such large error bars that a credible value is achieved. Lindzen has very valid points, based on how he interprets the data. Just as others have very valid points as to how they interpret the data. We have had a flat to declining temp trend since 2001. OHC since 2003 has been dropping. The sun was in a very very strong maxima for the past 40 years, setting records that can be measured. It appears to have peaked in that cycle in the early 2000's. The climatic response of OHC and surface temp show this. The critical issue of AGW will be solved in the next 10-15 years. Either the hypothosis will prevail, or re-examination of it will have to be done.Response:[DB] "We have had a flat to declining temp trend since 2001."
Umm, you're forgetting that the "Aughts" were the warmest decade on record, with 2010 leading the way as the warmest year on record. Despite a quiescent sun (deep solar minimum). That is indeed perfectly clear.
-
Albatross at 09:45 AM on 14 May 2011Lindzen Illusion #7: The Anti-Galileo
CW @71, "And it shows that all the temperature data set indicate a trend lower than the 1.8 C per century rate that IPCC identifies as the best estimate for the "Low Scenario"." As you have been informed, you are not comparing apples to apples. Also, continuing to repeat a falsehood doesn't make it true. If you are going to insist on citing the IPCC or attributing stuff to them, then please link directly to where they made that statement, or quote them verbatim, with a link to the relevant section or chapter of AR4. But again, apples to apples please, see Dana's embedded graphic at #59. Regardless, you cannot escape the fact the devastating graphic and observations by Hansen shown at #58. Lindzen is the clear outlier. -
WheelsOC at 09:44 AM on 14 May 2011Infographic: 97 out of 100 climate experts think humans are causing global warming
This graphic reminds me of a way I've been trying to put the "controversy" into context for a while. I usually point at the imbalanced media coverage and say that to really represent the split, they'd have to gather about 34 climate scientists into one room for a discussion, and out of those 34 only one would be unconvinced of anthropogenic climate change. Wouldn't make for much of a debate, would it? Unfortunately it wouldn't make for a "fair and balanced" segment, just an accurate and informative one. I've also used the same numbers for a "what if you were diagnosed with cancer..." scenario. -
Rob Honeycutt at 09:43 AM on 14 May 2011Lindzen Illusion #7: The Anti-Galileo
CW... Again, please view the trends I plotted at 68. -
Rob Honeycutt at 09:41 AM on 14 May 2011Lindzen Illusion #7: The Anti-Galileo
CW @ 71... "It shows that GISS is the high outlier." I think you need to revisit the definition of "outlier." In statistics that would be a point that lies "very much" higher or lower than other point. Each of these data sets are well within reasonable range of each other. -
ClimateWatcher at 09:30 AM on 14 May 2011Lindzen Illusion #7: The Anti-Galileo
64. That's fine - lets throw out the Hi and Low and average the remaining. -
ClimateWatcher at 09:25 AM on 14 May 2011Lindzen Illusion #7: The Anti-Galileo
65. See chart in 61. -
drrocket at 09:25 AM on 14 May 2011CO2 has a short residence time
Stephen Baines, 5/13/11, 12:30 PM, You wrote, pointlessly, The fact that the atmosphere is not now in equilibrium has no bearing on this debate. That is a red herring. You quote me as if I had introduced something irrelevant. I agree, it IS a red hearing, which is exactly why I have no use for it, and why I responded to Dikran Marsupial's vacant charge that I confused residence time with adjustment time. Then you write, The residence time also has almost no bearing on how quickly the CO2 added to the atmosphere will be absorbed by the biosphere. IPCC provides the following formula: Turnover time (T) (also called global atmospheric lifetime) is the ratio of the mass M of a reservoir (e.g., a gaseous compound in the atmosphere) and the total rate of removal S from the reservoir: T = M / S. For each removal process, separate turnover times can be defined. In soil carbon biology, this is referred to as Mean Residence Time. AR4, Glossary, p. 948. (The remark about being Mean Residence Time in soil carbon biology is a litigator's half-truth, intended to give the impression that T is not the Mean Residence Time in all applicable fields.) You might recognize the formula as saying S = dM/dt and dM/dt = M/T. The solution is the exponential, so the reservoir mass, M = M_0*exp(-t/T). This is also the impulse response of the reservoir. So if you put in a slug, M, of ACO2 at t = 0, it will decay according to that formula. Now if you continuously input ACO2, the reservoir will accumulate ACO2 according to the convolution of the input function with the impulse response. The difference between the input function and the amount retained in the atmosphere is your amount that will be absorbed by the biosphere. The residence time, T, has everything to do with the amount absorbed by the biosphere. IPCC shows its estimate of the increase in ACO2 emissions in AR4, Figure 2.3, p. 138. Between 1981 and 2002, it increased at a best fit rate of 1.55%/yr. If we extrapolate that back to 1750, the start of the industrial era. the emissions were 0.15 GtC/yr in 1750, increasing to 10.98 GtC/yr in 2030, and the total emissions over that period is 705 GtC. The amount accumulated in the atmosphere asymptotically approaches 594 GtC (84.3% of the total) for a residence time of 350 years, 247 GtC (35.0%) for a residence time of 35 years, and 36.0 GtC (5.1%) for a residence time of 3.5 years. The last figure, which is the result from IPCC's formula and data, sans leaf water, but it doesn't put enough CO2 into the atmosphere. By never relying on the formula, IPCC gains a handle on ACO2 emissions. It can rationalize the residence time to put just enough CO2 in the atmosphere to match the bulge at MLO. Of course, IPCC doesn't actually rely on equations here. It just declares the bulge to be ACO2. This phony claim by IPCC gives its supporters fits. They stand on their heads to redefine terms or introduce new ones, and safe to say, never with citations. ACO2 does not accumulate in the atmosphere, and there isn't enough present to make AGW work. Pity. CO2 residence time is essential to systems science, and a misunderstood play thing for AGW climatologists. P.S. Re. your post on 5/14/11, 01:09 AM. You are correct enough that "there is nothing special about anthropogenic carbon." But that is my argument. Repeating it doesn't help your position. You need to bring that fact to the attention of IPCC and AGW believers. It is IPCC, not I, that treats nCO2 and ACO2 to substantially different physics. And I've given you all the proof. -
ClimateWatcher at 09:24 AM on 14 May 2011Lindzen Illusion #7: The Anti-Galileo
61. This graph is pretty good. It shows that GISS is the high outlier. And it shows that all the temperature data set indicate a trend lower than the 1.8 C per century rate that IPCC identifies as the best estimate for the "Low Scenario". The only addition would be to add the MSU Middle Troposphere which indicate warming trends less than even the 1.1 C per century that IPCC indicates as the lowest possible. -
Albatross at 08:56 AM on 14 May 2011Infographic: 97 out of 100 climate experts think humans are causing global warming
Thanks for the laugh Rob :) OK, not that Albatross...! -
Rob Honeycutt at 08:53 AM on 14 May 2011Infographic: 97 out of 100 climate experts think humans are causing global warming
Ah yes. Albatross.... One of my favs! ;-) -
chris at 08:45 AM on 14 May 2011Lindzen Illusion #7: The Anti-Galileo
CW @ 62: the problem with "the warming is in the pipeline" is that were this the case, one might expect an accelerating temperature increase. One "might", but one would be quite wrong. Two reasons: 1. The temperature response to an instantaneous forcing resulting from (say) a slug of enhanced CO2 looks somewhat like a hyperbolic rise towards a maximum (or more strictly, a superposition of several "hyperbolic" rises with characteristic relaxation times). Any "warming in the pipeline" would manifest as a decelerating temperature increase under these circumstances. Of course, the anthropogenic greenhouse forcing is being continually supplemented by continual emissions, and so the temperature response (averaged over rather longer periods than you would likely prefer to consider) is approximately linear. 2. "Warming in the pipeline" is dominated by the slower response elements of the climate system (especially heat uptake into the ocean). These accrue over a long period and so again their contribution will be apparent as a slowly increasing temperature contribution with a decelerating trend. Of course, this is much better assessed using a rather more quantitative modelling as illustrated, for example, the figure in Albatross's post @ 66. Note that the existence of "warming in the pipeline" is not in doubt. It's a fundamental property of the response to enhanced radiative forcing from whatever source, and only requires that we're observing the system at a period that is shortish on the timescale of the relevant response times of the climate system. -
Albatross at 08:33 AM on 14 May 2011Infographic: 97 out of 100 climate experts think humans are causing global warming
Rob, I was making a poor joke...you know, me 'Albatross' suggesting 'gliding' :) I guess even winch launches require burning FFs. Thank goodness I'm an Albatross.... Anyhow.....back to business. -
Albatross at 08:33 AM on 14 May 2011Infographic: 97 out of 100 climate experts think humans are causing global warming
Well, this is interesting. "I’ve read somewhere that about 5% of physicists have serious doubt that we really landed on the Moon. In both cases, science has moved on because the evidence is overwhelming. There was not a magic moment when it occurred, it is different with each person, but without doubt, it has." From the American Geophysical Union site. "Skeptics" really ought to actually read the first few lines of John's post about his dad to understand why the 97-98% figure is important. -
Albatross at 08:26 AM on 14 May 2011Lindzen Illusion #7: The Anti-Galileo
CW @59, "This rate, we should observe, is not necessarily abnormal, given that a similar period of warming occurred from 1910 through 1945" Another red herring, not to mention a well used disingenuous argument designed to confuse lay people. Not surprisingly this red herring has been addressed here at SkS. Keep trotting out the myths and we'll keep refuting them. Really, engaing in this behaviour only further harms the already tarnished reputation of the 'skeptics'. And it is not helping Lindzen's already weak case either. -
Rob Honeycutt at 08:25 AM on 14 May 2011Lindzen Illusion #7: The Anti-Galileo
Here are all the trends plotted. Again, pretty much same basic picture. Heck, pick the one you like best. It's going to be difficult to change and fundamental conclusions about the science based on which data set you use. -
Rob Honeycutt at 08:18 AM on 14 May 2011Lindzen Illusion #7: The Anti-Galileo
CW @ 62... Go to woodfortrees and plot it yourself. Albatross... I remember Tamino's post now. -
Albatross at 08:17 AM on 14 May 2011Lindzen Illusion #7: The Anti-Galileo
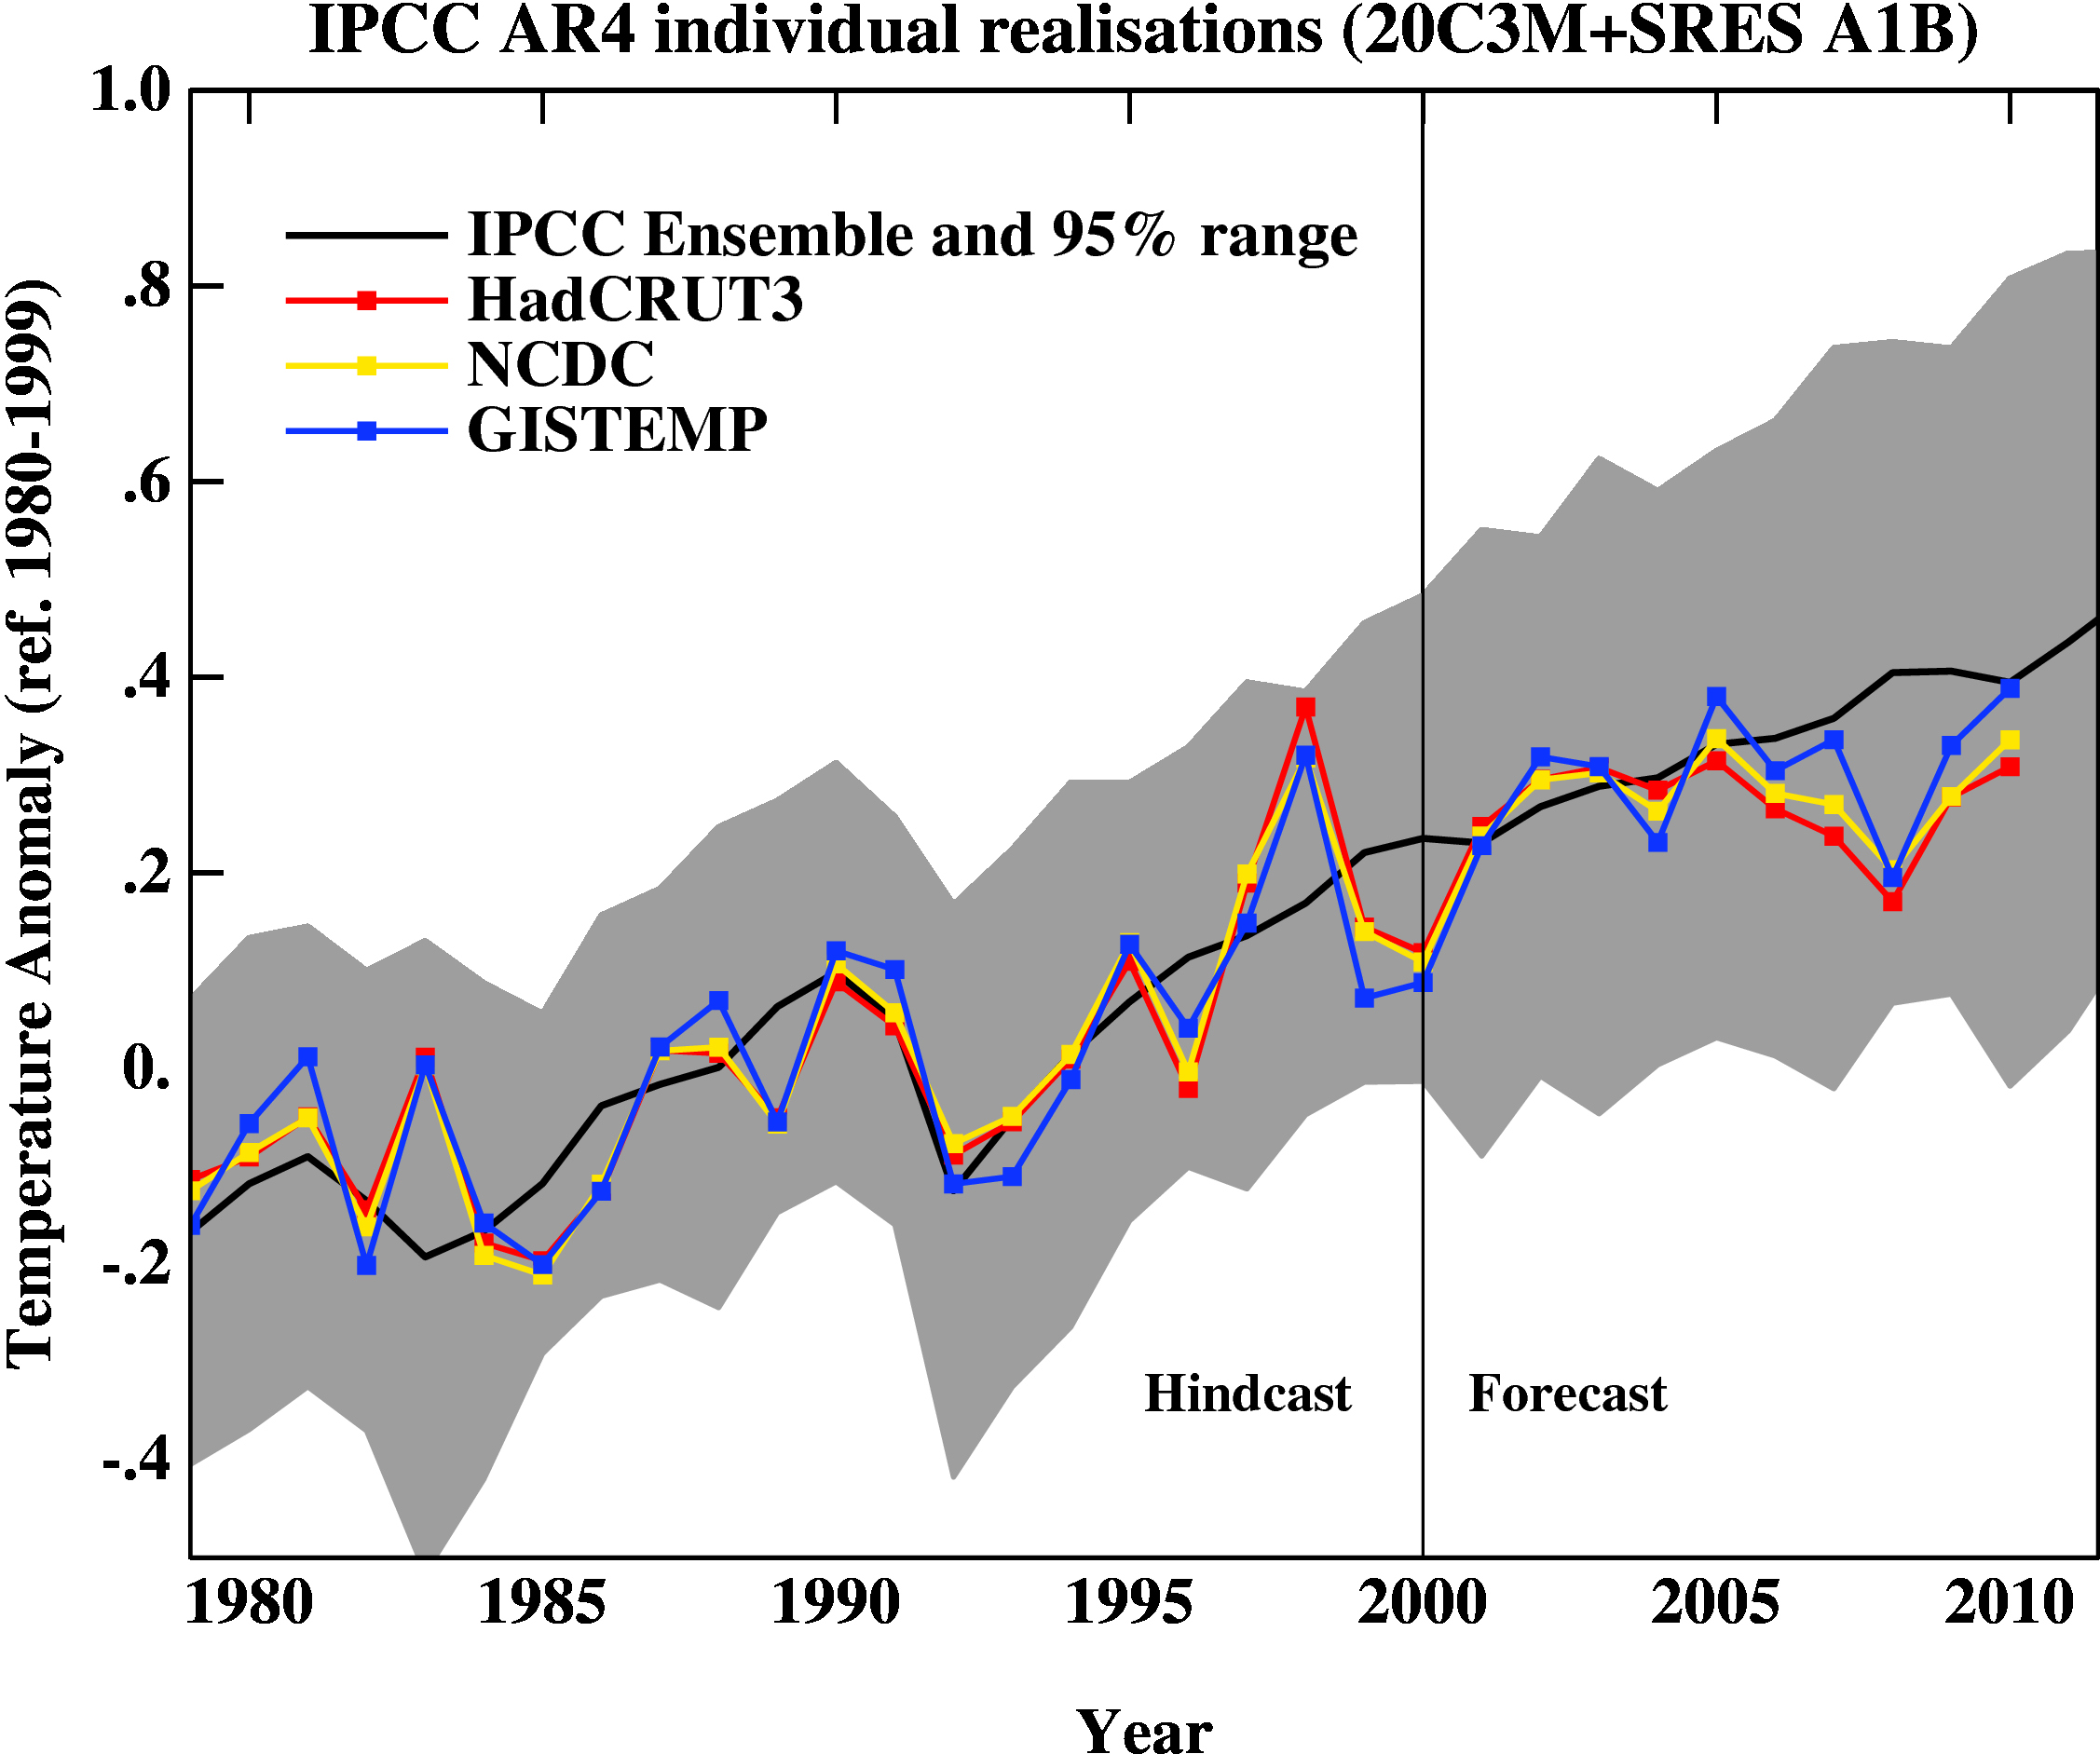
There is another comparison between models and observations, the models are doing just fine thanks....but this line of argument is all just a red herring anyway. Solid blue and red lines are trends from GISS and HadCRU data, dashed lines are IPCC projections included in the TAR.
[Source]
This is the proper way to compare the models and projections. Looking at rates from ~1980-2010, and comparing those with rates of warming predicted for the various SRES scenarios beyond 2000 is not comparing apples to apples.
Anyhow, Dana has addressed Lindzen's claim in his post here, what is being presented here by so-called 'skeptics' are red herrings. This is a no win for Lindzen, but rather than accept that fact, loyal 'skeptics' have to do their best to obfuscate the truth.
Solid blue and red lines are trends from GISS and HadCRU data, dashed lines are IPCC projections included in the TAR.
[Source]
This is the proper way to compare the models and projections. Looking at rates from ~1980-2010, and comparing those with rates of warming predicted for the various SRES scenarios beyond 2000 is not comparing apples to apples.
Anyhow, Dana has addressed Lindzen's claim in his post here, what is being presented here by so-called 'skeptics' are red herrings. This is a no win for Lindzen, but rather than accept that fact, loyal 'skeptics' have to do their best to obfuscate the truth.
-
dana1981 at 08:15 AM on 14 May 2011Lindzen Illusion #7: The Anti-Galileo
CW #60 -"OK, but that won't change the fact that warming is taking place at a rate lower than the IPCC best estimate for the "low scenario".
You misspelled the word "fiction". -
Albatross at 08:07 AM on 14 May 2011Lindzen Illusion #7: The Anti-Galileo
Actually Rob @61, if there is an outlier, stats analysis by Tamino has shown the outlier is the Christy and Spencer's problem plagued "skeptic" UAH satellite product, see also here. -
ClimateWatcher at 08:06 AM on 14 May 2011Lindzen Illusion #7: The Anti-Galileo
61. What is the time period of reference? and are the RSS & UAH LT? or are they MT? -
ClimateWatcher at 08:04 AM on 14 May 2011Lindzen Illusion #7: The Anti-Galileo
56. Chris - the problem with "the warming is in the pipeline" is that were this the case, one might expect an accelerating temperature increase. Instead, what we find from the CRU data is a decelerating temperature increase. Decelerating to an actual cooling trend since 2001. (see CRU graphic above) -
Rob Honeycutt at 07:55 AM on 14 May 2011Lindzen Illusion #7: The Anti-Galileo
CW... I'm not sure how you can deem ANY of the data sets as an "outlier." They're pretty much all saying the same thing.
-
ClimateWatcher at 07:53 AM on 14 May 2011Lindzen Illusion #7: The Anti-Galileo
Do you really believe that Lindzen has it all right, and everyone else has it all wrong? You will note, I only gave credit to Lindzen for #1. On most of the other issues, I took exception or made nuance about the statements at least attributed to Lindzen. 1. The earth hasn't warmed... You completely and totally missed the point. Go back and re-read the post, several times. OK, but that won't change the fact that warming is taking place at a rate lower than the IPCC best estimate for the "low scenario". 4. climate sensitivity is low Well, the lower warming rate from 1. indicates this to be true. But nobody can be sure. Your understanding of this issue is abysmal. Please study more. Start here, but there is a whole, whole lot more to this than what is posted on that page (and certainly more than your minimalist treatment of the subject). You didn't bother to look at the images. What is earth's albedo? Is it the 33% used in the GISS model? Is it 31% cited by Trenberth's first paper? Is it the 29.8% in Trenberths recent paper? How might it have varied over the centuries? What is the outgoing energy from earth? Is it the 232 W/m^2 and rising as measured by satellites? Is it the 230 W/m^2 and falling as modeled by Hansen's GISS model? Is it the 235 W/m^2 assessed by Trenberth's first paper? Is it the 238 W/m^2 assessed by Trenberth's second paper? These differences are more than two times larger than the estimated forcing from a doubling of CO2. If one can't answer what earth's energy budget is, then one cannot even say if there is a surplus or deficit. -
ClimateWatcher at 07:25 AM on 14 May 2011Lindzen Illusion #7: The Anti-Galileo
#58, Albatross: The IPCC fourth predicts the best estimate for the "low scenario" to be 1.8 K per century. Since 1979, GISS, which is of course the high outlier among temperature data sets, indicates a trend of 1.6 K per century. Note the 0.52 temperature trend. Multiply by 100 for a century and divide by the 32 years of the trend and get the 1.6. According to the IPCC definitions, global warming is occurring at a rate less than the best estimate for the 'low scenario'. This rate, we should observe, is not necessarily abnormal, given that a similar period of warming occurred from 1910 through 1945: Response:
[dana1981] You are incorrect. The warming trend is well within the range of IPCC model projections.
-
Rob Honeycutt at 07:15 AM on 14 May 2011Infographic: 97 out of 100 climate experts think humans are causing global warming
The sheer level of maintenance required for a high performance aircraft engine is astonishing. Even on a new aircraft you can spend $10k a year just to keep it airworthy. Add in any AD's (airworthiness directives) and that number goes up. Then the babysitting you have to do en route and in decent adds a ton of complexity to the already complex flight environment. If aircraft engines were electric motors... all (or most) of that goes away. I know of one incident where the owner of an older twin let his aircraft sit on the ramp too long without operating the aircraft - not long, maybe 6 months - and a small amount of corrosion built up in the cylinders... the aircraft was essentially totaled. An aircraft worth close to half a million dollars... gone. But had those been electric motors... Crap. Sorry. This is WAAAAY off topic. -
trunkmonkey at 07:13 AM on 14 May 2011Models are unreliable
CBDunkerson 374. Perturbing the THC by jumping on one end and finding the other end rises does not mean that DO events funtion to balance hemispheric temperatures. I see your point that universally higher SST's would contraindicate DO as an explanation for current warming. Bear in mind that the deep water now upwelling is very old. Much of it emerging now began sinking during the Medieval Warm Period as the Vikings sacked England, and some may be 1600 years old. There is a lot of cold salty water in that pipeline that is insulated from warming at the surface. -
dhogaza at 06:32 AM on 14 May 2011Infographic: 97 out of 100 climate experts think humans are causing global warming
"The list goes on and on." Designing the powerplant to maintain power while flying upside down is easier, too ... -
Albatross at 06:30 AM on 14 May 2011Lindzen Illusion #7: The Anti-Galileo
Dana @55, "I'm not really interested, honestly. He clearly didn't read the article, which contains all the necessary info to refute his arguments, so why waste the time?" No worries, I understand. I was wanting to allow you to have the first rebuttal, being the author of the piece and all. From what I have read with Hansen, the observed rate of warming in GISTEMP for 1980-2010 is comparable/in agreement with the values reported in the IPCC. I found this statement (wikipedia, sorry, I'm in a rush): "A temperature rise of about 0.2 °C per decade is projected for the next two decades for all SRES scenarios." From Hansen et al. (2010): "On the contrary, we conclude that there has been no reduction in the global warming trend of 0.15°C–0.20°C per decade that began in the late 1970s." And from RealClimate for 1984-2010: "For the GISTEMP and HadCRUT3, the trends are 0.19+/-0.05 and 0.18+/-0.04ºC/dec (note that the GISTEMP met-station index has 0.23+/-0.06ºC/dec and has 2010 as a clear record high)." And, point 1 @50 is not a score for Lindzen, as you know: [Source]
-
Stephen Baines at 06:16 AM on 14 May 2011CO2 has a short residence time
DM and I differ in subtle ways in out terminology, but we are saying exactly the same thing. Just to be clear.. DMs "exchange" is what I would call equal and opposite gross fluxes between reservoirs. Gross fluxes are used to calculate residence time of a reservoir - for CO2 about 5 years. A residence time of 5 years implies that 1/5th or 20% of the atmospheric CO2 molecules passes into other reservoirs every year. That 20% is largely replaced by movement of CO2 into the atmosphere from other reservoirs. My "net exchange" is DMs "flux" -- i.e. net movement of material from one reservoir to another. This net movement between reservoirs is what matters for rate of change in the size of the atmospheric CO2 reservoir. The annual net movement of atmospheric CO2 into oceanic and terrestrial reservoirs are half the size of anthropogenic CO2 emissions. That's the atmospheric CO2 increases at only half the rate of anthorpgenic emissions. The bank account analogy is perfactly a propos here. If my income amounts to 20% of my balance per year and my costs amount to the same, I am not going to see an increase in my balance. If I get a new source of income that amounts to only 3% of my balance every year, but I only spend half of that new income, my balance will increase by 1.5% per year. If I lose that income and don't reduce my costs, my bank account will decline slowly as well. Its that simple. Come to think of it. My bank account looks too much like the C cycle for my liking.Moderator Response: [Dikran Marsupial] Yes, that is absolutely correct. The reason that the airborne fraction is approximately constant is because we are forcing an approximately first order dynamical system with an approximately exponential perturbation. The result is an approximately exponential increase in atmospheric CO2 with a time constant virtually the same as the perturbation, so if you divide input by output you get approximately a constant value. It is nothing to do with differential absorbtion rates, which as you correctly point out is about 20% for both natural and anthropogenic CO2. -
les at 06:06 AM on 14 May 2011Lindzen Illusion #7: The Anti-Galileo
48 Camburn Well done rather than defend your point from post 39, you grab the wuwt branch and swing off in another direction. A professionally executed "skeptical" argumentation technique (aka "quick, change tghe subject") often used to mice quickly away from a point if view which can't be defended. Yup. That really worked. -
Tracking the energy from global warming
Tom@137, I have to respectfully disagree with your specific criticism of BP's math (having the sign wrong) though note I'm not agreeing with BP's analysis in general. By way of example, here is a graph of y = x - 10. Note that the function is negative until x=10, and represents a constant positive linear trend: And here is the integral of that function:
 Note that the value of the integral is negative with increasing absolute magnitude until x=10, after which the absolute magnitude decreases though the actual value remains negative. Also note the similarity in shape to BP's graph, with x=10 being roughly equivalent to 2008.
Again, the key to his analysis was how he baselined the anomaly data. As an example if I take my sample function above, and move the baseline down by 10 (y = x), then we see a very different story when we take the integral:
Note that the value of the integral is negative with increasing absolute magnitude until x=10, after which the absolute magnitude decreases though the actual value remains negative. Also note the similarity in shape to BP's graph, with x=10 being roughly equivalent to 2008.
Again, the key to his analysis was how he baselined the anomaly data. As an example if I take my sample function above, and move the baseline down by 10 (y = x), then we see a very different story when we take the integral:
 >"...definitely shows total incoming energy in 2008 to be less than total incoming energy in 2000."
By taking the integral, BP is basically showing the "running total" of energy in the system from t=2000 to the point in question. So his graph is showing that total energy in the system mostly decreasing from 2000 to 2008, and then mostly increasing in 2008 and onwards. Overall his graph shows that energy lost from 2000-2008 was greater than energy gained in 2008 and onwards. This does not contradict the fact that the net anomaly was higher in 2008 than it was 2000.
>"...definitely shows total incoming energy in 2008 to be less than total incoming energy in 2000."
By taking the integral, BP is basically showing the "running total" of energy in the system from t=2000 to the point in question. So his graph is showing that total energy in the system mostly decreasing from 2000 to 2008, and then mostly increasing in 2008 and onwards. Overall his graph shows that energy lost from 2000-2008 was greater than energy gained in 2008 and onwards. This does not contradict the fact that the net anomaly was higher in 2008 than it was 2000.
-
chris at 05:04 AM on 14 May 2011Lindzen Illusion #7: The Anti-Galileo
Oh dear ClimateWatcher; that’s really poor. It’s tedious to go through your full set of weak logic but a couple of things stand out: 5. water vapour feedback is negative: Your “argument”: ”there are reasons to believe this is so” But we’ve just seen higher up in the thread that you’ve completely misrepresented the science on this. You provided one flawed analysis to support your point, and are now ignoring the multitude of data that completely opposes your assertion, as if you didn't happen to notice it. The evidence indicates rather strongly that the water vapour feedback is positive. If your evidence doesn’t support your “argument”, what’s the point of attempting to maintain the “argument”? Why bother entering the debate at all, if you're simply going to ignore the information you receive that would allow you to come to a reasonably informed decision?? 1. earth hasn’t warmed as much as expected/4. climate sensitivity is low The climate sensitivity is defined as the Earth surface temperature response at equilibrium in response to a doubling of atmospheric [CO2]. We know that one cannot assess climate sensitivity from the earth temperature evolution during a short period (Kirk-Davidoff, ex-Lindzen lab, who Chris G mentions in post @ 14, recently published a paper that reinforces that climate sensitivity is underestimated when using short-term analyses). Lindzen's own flawed analyses have shown the mess you can get into trying to assess climate sensitivity by analysis of short term relationships between temperature fluctuations and TOA outward radiation. If we consider more appropriate time periods that allow the Earth to come closer towards the equilibrium response, the warming is certainly as much as expected. We've warmed by around 0.8-0.9 oC since the middle of the 19th century, while [CO2] has risen from around 286 ppm then to 389 ppm now. A climate sensitivity of 2 oC should then give an equilibrium warming of: ln(389/286)*2/ln(2) = 0.86 oC We know that we haven’t had the full warming from this enhancement of greenhouse gases, since it takes the earth many decades to come to equilibrium with the current forcing resulting from raised greenhouse gases. Likewise we know that a significant part of the warming from this enhancement of greenhouse gas levels has been offset by manmade atmospheric aerosols. On the other hand some of the warming is due to non-CO2 sources (man-made methane, nitrous oxides, tropospheric ozone, black carbon). Non greenhouse gas contributions to this warming (solar, volcanic) are known to be small. Overall, it’s rather unlikely, given the warming since the mid-19th century, that climate sensitivity is less than 2 oC. This is expanded on in more detail in Knutti and Hegerl (2008), in Murphy et al. (2009), in Lean and Rind (2008), in Hansen et al (2005). -
Dikran Marsupial at 04:49 AM on 14 May 2011CO2 has a short residence time
drrocket@55 wrote: "If the rate of absorption of ACO2 is only 50% of the rate of emission, that should be true of nCO2 also. " This is incorrect, the IPCC do not say that the rate of absorption of ACO2 is only 50%. They say that the annual increase in atmospheric CO2 is about half anthropogenic emissions, but that doesn't mean that half the anthropogenic CO2 emitted each year is absorbed by the biosphere. In fact about 20% of the ACO2 in the atmosphere is shunted into the other reservoirs each year, and that rate of absorption is the same as it is for NCO2. That is because the residence time for both ACO2 and NCO2 is about five years. However, as has been pointed out to you, residence time is not what controls the rate of growth or decline of atmospheric concentrations, that is decided by the adjustment time. The residence time depends on the volume of the flux of CO2 out of the atmosphere (which is vast, hence the residence time is short). The rate of growth of atmospheric CO2 however also depends on the volume of the flux into the atmosphere. To be specific, the rate of increase is proportional to the difference between total emissions and total uptake. This difference is much smaller (about half anthropogenic emissions), hence the adjustment time is much longer. The thing you don't seem to understand is that the atmosphere exchanges vast quantities of CO2 with the oceans and terrestrial biosphere each year. However, this is an exchange, with natural emissions approximately balanced by natural uptake, so even though it make residence time very short, it has very little effect on atmospheric concentration. Our emissions have altered the balance by increasing the partial pressure of CO2 in the atmosphere, which increases uptake by the oceans (and it is plant food, so some extra goes into the terrestrial biosphere), and hence the natural environment has become a net carbon sink. That is why the observed rise is only about half anthropogenic emissions. Do the differential equations for a one-box model of the carbon cycle and you will find this is correct. -
dana1981 at 04:31 AM on 14 May 2011Lindzen Illusion #7: The Anti-Galileo
Albatross #52 -"I'll let Dana and others point out the obvious problems with some of your claims."
I'm not really interested, honestly. He clearly didn't read the article, which contains all the necessary info to refute his arguments, so why waste the time? -
Albatross at 04:25 AM on 14 May 2011Lindzen Illusion #7: The Anti-Galileo
ClimateWatcher, "Lindzen's research has greatly advanced meteorology and the understanding of the atmosphere." That may be true, but it certainly doesn't seem to apply to his foray into climate research. And it does not make him infallible as some 'skeptics' would believe-- just look at the findings from the "Lindzen Illusions series", and his thorough (and multiple) debunkings of some of his work in the scientific literature. His insistence on repeating debunked myths, some for over 20 years now, and thereby misleading policy makers (and you) is simply bad science. Denial is a very strong trait in humans, and we are very apt about convincing/deluding ourselves that there is not a problem, even when we are already in the midst of experiencing that problem. Lindzen is free to do that, but I find it despicable that he uses (abuses?) his credentials and authority to delude, misinform and mislead others on such an important issue. But I thought appealing to authority, as you seem to be doing, is something that 'skeptics' accuse those who understand AGW to be a legitimate concern of? -
Bob Lacatena at 04:24 AM on 14 May 2011Lindzen Illusion #7: The Anti-Galileo
50, ClimateWatcher, Your diatribe would have been more effective if you didn't try to deconstruct every single aspect of climate science. Do you really believe that Lindzen has it all right, and everyone else has it all wrong? 1. The earth hasn't warmed... You completely and totally missed the point. Go back and re-read the post, several times. 3. global warming is not a concernAnd we know that humans and all the other species of life on earth evolved through all the glacial/stadial changes.
Humans, yes. 6 billion of them, no. Civilization, no. Modern, technological civilization, definitely not. This is about the most pathetic argument you could muster. 4. climate sensitivity is lowWell, the lower warming rate from 1. indicates this to be true. But nobody can be sure.
Your understanding of this issue is abysmal. Please study more. Start here, but there is a whole, whole lot more to this than what is posted on that page (and certainly more than your minimalist treatment of the subject). 5. the water vapor feedback is negativeThere are reasons to believe this to be so.
Yes, but not good reasons. Just reasons you can throw around with people who don't understand the issues, so they get lost in your misrepresentation of the details, and pretty much the fabrication of your own personal brand of climate science. 6. the cloud feedback is negative Try reading Dessler.I have a difficult time with any theory predicting any change in cloudiness.
Yes, you seem to have a difficult time with all of climate theory. 7. global warming is just due to internal variability...pretty much all attribution is a fairy tale.
That's just plain making stuff up. Simply saying it doesn't make it true. -
Rob Honeycutt at 04:20 AM on 14 May 2011Infographic: 97 out of 100 climate experts think humans are causing global warming
This is OT but in response to the aviation thing... The electric vehicle market should help aviation out quite a bit. Currently there are a couple of two seater electrics out that can fly for about 1.5 hrs on a charge. Battery technology is supposed to improve in efficiency by 3-5X this decade. That means the same plane will be able to fly up to 7 hours on a charge. That's longer than most small aircraft even with extended range fuel tanks. Electrics also have some huge advantages over ICE engines. Simplicity. You wouldn't believe it if I told you how much it costs to keep up a modern small aircraft engine. There's also the elimination of pressure altitude issues with normally aspirated engines. Service ceiling goes up significantly without adding complexity. The list goes on and on. My sense is small personal aircraft will go all electric in the coming decades, while larger corporate aircraft and commercial aircraft will move to algae based bio fuels as that becomes economical. -
Albatross at 04:14 AM on 14 May 2011Lindzen Illusion #7: The Anti-Galileo
ClimateWatcher @50, Look, you clearly believe that AGW is non issue. However, the facts and data simply do not agree with you. Thus, attempts to misrepresent the facts and data to support that belief may work well on internet blogs or 'skeptical" sites, but some of your content @50 won't pass muster here. Perhaps your impressions are misguided. If so, please then be willing to listen and learn from not necessarily what people say here, but the peer-reviewed scientific literature that has withstood the test of time is saying. I'll let Dana and others point out the obvious problems with some of your claims. -
ClimateWatcher at 04:06 AM on 14 May 2011Lindzen Illusion #7: The Anti-Galileo
If Lintzen's last name wasn't MIT, who would pay attention to him? Your background is probably not meteorology. Regardless of you opinions on so called 'climate change', you will find from numerous citations in journals and textbooks that Lindzen's research has greatly advanced meteorology and the understanding of the atmosphere. -
ClimateWatcher at 04:00 AM on 14 May 2011Lindzen Illusion #7: The Anti-Galileo
1. Earth hasn't warmed as much as expected Trends since 1979 are all below the IPCC "low scenario" rate. Trends since 2000 are all below the IPCC ".2 C per decade for all scenarios" rate. One for Lindzen. 2. the surface temperature record is wrong SST and MSU are pretty close to land rates ( except for the high outlier GISS ) UHI effect does exist, but it is not a huge part of the temperature averages. 3. global warming is not a concern Concern reflects emotion, not a scientific quantity. But we know the recent rate is quite similar to the early twentieth century rate. We know that Northern Hemisphere temperatures were higher for millenia during the Holocene Climatic Optimum, a time which corresponded to the advancement of human civlization. And we know that humans and all the other species of life on earth evolved through all the glacial/stadial changes. Pretty hard to get worked up about this when there are so many real problems to be concerned about. 4. climate sensitivity is low Well, the lower warming rate from 1. indicates this to be true. But nobody can be sure. Why? Because we don't know how much energy earth is receiving, mostly because we don't know how much the earth reflects away: And we don't know how much earth is emitting:
 The uncertainty in the balance is larger than the projected forcing from a CO2 doubling.
5. the water vapor feedback is negative
There are reasons to believe this to be so.
There is great uncertainty as to whether or not water vapor is increasing or decreasing ( the sonde data indicate drying aloft, but are subject to instrumentation changes over time, some satellites indicate increasing, some indicate decreasing humidity )
But beyond that, water vapor is a dynamic quantity.
It gets pushed around in the atmosphere, mostly pushed toward the equator by polar air masses.
And water vapor, by its mere presence, works against an increase. That's because if water vapor injects into the upper atmosphere, which was previously arid, that region of atmosphere then radiates more effectively and cools. This cooling allows subsidence to occur. And subsidence then dries this layer.
The total column water vapor might increase, but the top of this layer would emit just as effectively as with a lower total column water vapor.
6. the cloud feedback is negative
Since the meager attempts to create a long term trend of cloudiness disagree in sign ( some indicate increasing cloudiness, others indicate decreasing cloudiness ) I don't think anyone can justify a conclusion on what has actually happened. And since cloud formation depends on some many processes from the macro ( synoptic scale convergence ) to the micro ( condensation nuclei ) and in between, I have a difficult time with any theory predicting any change in cloudiness.
7. global warming is just due to internal variability
Since we don't actually know the energy balance well enough ( see above ) pretty much all attribution is a fairy tale.
On the other hand, look at the 97-98 El Nino. Temperatures changed by almost 1 degree C, but oceanic heat content didn't show a pimple. This was internal variability. The warming rate from 1910 through 1945 is about the same as the recent rate. And that was natural variability.
8. water vapor is the most important greenhouse gas
CO2 is significant, largely because of the band from which emissions to space leave from the stratosphere. That's a big deal because that makes the energy level that leaves from CO2 much lower and mostly (though not completely) independent of the surface temperature.
H2O vapor, on the other hand, diminishes with height. It is the vertical variation of temperature coupled with the vertical variation of the emitting constituent that determines the energy that leaves earth.
In this regard, forcing from water vapor is constrained and coupled to the surface temperature while CO2 emissions are not, and in this way CO2 is more 'important'.
On the amount of 'greenhouse effect', my understanding is the relative importance goes:
Clouds > Water Vapor > CO2
The question of 'importance', we might agree, is secondary to what will actually happen with changes in CO2.
The uncertainty in the balance is larger than the projected forcing from a CO2 doubling.
5. the water vapor feedback is negative
There are reasons to believe this to be so.
There is great uncertainty as to whether or not water vapor is increasing or decreasing ( the sonde data indicate drying aloft, but are subject to instrumentation changes over time, some satellites indicate increasing, some indicate decreasing humidity )
But beyond that, water vapor is a dynamic quantity.
It gets pushed around in the atmosphere, mostly pushed toward the equator by polar air masses.
And water vapor, by its mere presence, works against an increase. That's because if water vapor injects into the upper atmosphere, which was previously arid, that region of atmosphere then radiates more effectively and cools. This cooling allows subsidence to occur. And subsidence then dries this layer.
The total column water vapor might increase, but the top of this layer would emit just as effectively as with a lower total column water vapor.
6. the cloud feedback is negative
Since the meager attempts to create a long term trend of cloudiness disagree in sign ( some indicate increasing cloudiness, others indicate decreasing cloudiness ) I don't think anyone can justify a conclusion on what has actually happened. And since cloud formation depends on some many processes from the macro ( synoptic scale convergence ) to the micro ( condensation nuclei ) and in between, I have a difficult time with any theory predicting any change in cloudiness.
7. global warming is just due to internal variability
Since we don't actually know the energy balance well enough ( see above ) pretty much all attribution is a fairy tale.
On the other hand, look at the 97-98 El Nino. Temperatures changed by almost 1 degree C, but oceanic heat content didn't show a pimple. This was internal variability. The warming rate from 1910 through 1945 is about the same as the recent rate. And that was natural variability.
8. water vapor is the most important greenhouse gas
CO2 is significant, largely because of the band from which emissions to space leave from the stratosphere. That's a big deal because that makes the energy level that leaves from CO2 much lower and mostly (though not completely) independent of the surface temperature.
H2O vapor, on the other hand, diminishes with height. It is the vertical variation of temperature coupled with the vertical variation of the emitting constituent that determines the energy that leaves earth.
In this regard, forcing from water vapor is constrained and coupled to the surface temperature while CO2 emissions are not, and in this way CO2 is more 'important'.
On the amount of 'greenhouse effect', my understanding is the relative importance goes:
Clouds > Water Vapor > CO2
The question of 'importance', we might agree, is secondary to what will actually happen with changes in CO2.
-
dana1981 at 03:47 AM on 14 May 2011Lindzen Illusion #7: The Anti-Galileo
"Bob Tisdale has an excellent post"
Don't hear those words very often :-)"I read what Tamino posted, and will only say that he degrades himself in his response"
I wouldn't call pointing out a textbook example of cherrypicking "degrading oneself". However, this discussion is off topic. Please stick to the content of the article. -
Camburn at 03:41 AM on 14 May 2011Lindzen Illusion #7: The Anti-Galileo
les@46: I had not been to wuwt in ages, but as a result of your post I went there. Bob Tisdale has an excellent post on OHC verses a model. I read what Tamino posted, and will only say that he degrades himself in his response. There is a def divergence, at this time, between observations of OHC and the models. -
Stephen Baines at 03:34 AM on 14 May 2011CO2 has a short residence time
Eric...yes, the red lines are differences in fluxes pre and post industrial. Those differences represent the anthropogenic changes to the fluxes, not the fluxes of anthropogenic carbon. The thing we actually measure/estimate are the current fluxes/pools (the sum of red and black). The natural preindustrial levels are actually backcasts - some of which are well measured and other estimated based on reasonable constraints. Because CO2 was pretty steady during most of this interglacial, those preindustrial solutions are constrained to balance (inputs to atmosphere ~ outputs from atmosphere). That balancing assumption does not hold under current conditions because the system is out of equilibrium. The graph is an attempt to tease apart the effect of humans on the carbon cycle fluxes resulting from this shift to non-equilibrium conditions. There is no indication in that graph that aCo2 and nCO2 behave differently. To measure fluxes of anthropogenic carbon specifically, you would multiply the fluxes by the % of each source reservoir that is anthropogenic carbon. Don't be misled though. That ratio is not related to the red:black pool sizes, as those red numbers in the pools also simply reflect a difference in pool sizes pre and post industrial. If you did that you would find that there is net movement of aCO2 into the oceans simply because the fraction of the atmospheric C that is derived from human activities is larger for the atmosphere than for the ocean. That number is really only interesting to those looking at isotope tracers though. It's the changes in the pool sizes and fluxes that actually matter to the carbon cycle. Why? Precisely because nature does not care if its aCO2 or nCO2. I'll have to say, when I saw this graph before reading the background material, I too was puzzled by what it actually meant. It makes perfect sense from an academic viewpoint, though. Tracing aCO2 is actually less informative in many ways. -
Albatross at 02:56 AM on 14 May 2011Infographic: 97 out of 100 climate experts think humans are causing global warming
This is what the US National Academy of Sciences stated in a 2010 report: "A strong, credible body of scientific evidence shows that climate change is occurring, is caused largely by human activities, and poses significant risks for a broad range of human and natural systems…. Some scientific conclusions or theories have been so thoroughly examined and tested, and supported by so many independent observations and results, that their likelihood of subsequently being found to be wrong is vanishingly small. Such conclusions and theories are then regarded as settled facts. This is the case for the conclusions that the Earth system is warming and that much of this warming is very likely due to human activities." -
Eric (skeptic) at 02:54 AM on 14 May 2011CO2 has a short residence time
Stephen, they are in fact not fluxes? IOW, the red arrows are differences between natural and present fluxes, but do not represent actual fluxes.drrocket, what I gave as an argument (I am mostly just paraphrasing Englebeen's argument) and what Dikran Marsupial and others said previously in no way depends on prefential absorption. The IPCC's misleading diagram does not form the basis for what I said or what Dikran said, we simply observe the total ACO2 estimate (from reliable estimates of power generation and fuel sources, transportation uses, cement making, etc); and the total atmospheric buildup from reliable measurements. The ACO2 is about double the atmospheric increase. There is no isotope ratio argument or any references to carbon fluxes other than those two.
Moderator Response: [Dikran Marsupial] Indeed, I downloaded data on land use and FF emissions from the Carbon Dioxide Information and Analysis Center, and CO2 data from the MLO so I could verify the mass balance argument is correct (which it is). The story is similar if you use the other monitoring stations - even WUWT had a post a while back explaining that the MLO data were reliable, which puts into perspective how far out on a limb you have to be not to accept it! -
Tom Curtis at 02:41 AM on 14 May 2011Tracking the energy from global warming
e @131, if the graph of the function has a positive slope, then once it goes above zero it cannot go below zero (without changing slope) at a larger value of x. Therefore, while it may be below zero and have negative values for some x', for all x" > x' it will either be negative with a smaller absolute magnitude, or positive. And of course, -4 < -2 < 1. Hence I do not see how your point can refute my claim. Returning to his original calculation as shown in the second graph of 109, we see that it definitely shows total incoming energy in 2008 to be less than total incoming energy in 2000. The original data, however, shows that throughout 2008, the TOA radiative balance for 2008 was higher in Watts/meter squared than that for 2000. Therefore the Earth must have retained more energy in 2008 than in 2000 given the accuracy of the data. Despite this BP shows the reverse. Therefore he has made an error, and his ability to parrot the words "integrate", "convex function" and "concave function" cannot alter that. You cannot reduce the Joules received over the whole year by increasing the Joules received every second, but that is what BP would have us believe in his post @109. In his post 132 he suddenly changes tune without acknowledging the previous error and now wants to claim he has determined a rate of change (acceleration) in the satellite data from a linear trend. A constant rate of increase of the change between each year of 0.182 ± 0.023 × 10²² J/year^2 (not the years squared) does not result in a linear function, and so cannot be derived from a linear trend. I am not saying BP could not (or even has not) fit the data to and exponential function and hence derived an acceleration from the data. But he has certainly not shown us the fit, nor the correlation to the fit. Consequently he has not justified his claims about the "acceleration" of the satellite data; or even told us he has used a method that could justify it. To the extent that I can check BP's mathematics, it is garbage. It shows every indication of being stuck onto the analysis to convince the mathematically illiterate that he is making some profound analysis whereas he is really just spouting nonsense.
Prev 1738 1739 1740 1741 1742 1743 1744 1745 1746 1747 1748 1749 1750 1751 1752 1753 Next


