


 Arguments


Recent Comments
Prev 1760 1761 1762 1763 1764 1765 1766 1767 1768 1769 1770 1771 1772 1773 1774 1775 Next
Comments 88351 to 88400:
-
chris at 19:21 PM on 2 May 2011Frauenfeld, Knappenberger, and Michaels 2011: Obsolescence by Design?
Have to say I think this is one you haven't got quite right, and IMHO Dr. Box doesn’t come out of this in a particularly good light. The reason it’s worth pointing out the following is to counter the speculative theorizing about AGU/JGR editorial policy and the actions of the editor who dealt with this paper. 1. You should remove the quotation marks from the apparent quotation in the sentence in the top post:”Had the authors considered all available data, their conclusion that ‘Greenland climate has not changed significantly’ would have been simply insupportable.”
Nowhere in FKM2011 does that quotation appear. On the contrary the very first two sentences of FMK2011 read:“Observations indicate that in recent years, surface air temperatures over and around Greenland have been considerably higher than during the previous four decades [Hanna et al., 2008], with record high temperatures during 2010 [Box et al., 2010b]. Likely as a result, Greenland’s cryosphere has been significantly altered.”
So FKM2011 do state both that 2010 had record high temperatures and that the cryosphere has likely been significantly altered. That doesn't sound like a conclusion that "Greenland climate has not changed significantly". 2. You should correct the statement that ”Their selective ‘findings’ were obsolete at the time the paper was submitted for publication in December of 2010.” The paper was submitted for publication in August 2010, and so the findings (why ‘findings’?) weren’t obsolete when the paper was submitted. 3. The reason that the editor didn’t consider that FKM2011 should update their analysis to include 2010 is likely rather different to what your article indicates. FKM2011 determined historical and contemporary melt using a model based on S. Greenland temperature/ice melt that was compiled from three separate groups. According to the authors this data doesn’t become available until 6-9 months following the previous year’s melt season (I guess one might want to check whether this is actually the case). If FKM2011 were to have waited to update the analysis in their paper to include 2010, they would have effectively had to wait a year, and would be left in the same situation of a referee saying: ”come on, why don’t you include the data for 2011?”. In my opinion it was appropriate that the editor over-ruled Dr. Box’s recommendation on this point. 4. The most problematic statement in FKM2011 is the one in the abstract that is reproduced in the top article, viz:”The greatest melt extent over the last 2 1/4 centuries occurred in 2007; however, this value is not statistically significantly different from the reconstructed melt extent during 20 other melt seasons, primarily during 1923–1961.”
This shouldn’t have been allowed. And yet Dr. Box didn’t make any specific recommendation on this. He was offered the opportunity to re-review the paper on Dec 27th 2010 and declined to do so. It was very easy for the editor to over-rule Box’s main point [see (2.)] above following submission of Dr. Box’s review in September (after all the melt season was barely over). However Box was in a very strong position to make extremely forceful recommendations if he had taken the opportunity to re-review in early Jan 2011. But he didn’t. If I were reviewing the paper I would have insisted at this point that that sentence be removed from the abstract, since it was now clearly factually incorrect. Sadly Dr. Box chose not to do so. 5. Dr. Box’s review of the paper (he’s dumped it on his blog) is poor and sends a mixed message to the editor. Box rated the paper as “good” which is a clear indication to the editor that the paper is likely to be publishable. Clearly he doesn’t think it is “good” at all, as indicated by the storm he’s brewing up on his blog – so why give it a pass on that score in his review??. The review is a mess of grammatical errors, sentences lacking consequent clauses and gives the impression that he (Dr. Box) couldn’t be bothered to spend half an hour putting together a carefully thought out and convincing set of recommendations. He didn’t bother to address what seem to be dubious statistical analyses in FKM2011. He just threw his hands up in the air. 6. Dr. Box wrote a paper on a similar topic in 2009 [L.M. Wake et al (2009) Surface mass-balance of the Greenland ice sheet since 1866, Annals of Glaciology 50, 178]. The abstract concludes: (concerning Surface Mass Balance = “SMB”):All SMB estimates are made relative to the 1961–90 average SMB and we compare annual SMB estimates from the period 1995–2005 to a similar period in the past (1923–33) where SMB was comparable, and conclude that the present-day changes are not exceptional within the last 140 years.”
One might argue that FKM2011 is rather more accurate in its conclusions (at least they say that Greenland’s cryosphere has likely been significantly altered!). If present day changes in Greenland were unexceptional in Box’s own words in 2009, then FKM2011 merely serves to reconfirm Box’s own conclusion. Clearly 2010 is anomalous. It remains to be seen whether this is a blip or the start of a greater period of rapid melt. Box’s own analysis from his (Box’s) excellent 2009 paper on historical Greeenland ice sheet surface air temperatures supports the latter conclusion, and I personally think his arguments are quite convincing in this respect. 7. Overall I think Box is playing into the hands of those that misrepresent the science. He was in a strong position to address some serious problems with FKM2011 and declined to do so. He indicated to the editor that the paper is "good" when it clearly isn't - considering that the paper is a purely descriptive and rather unenlightening confirmation of Wake et al (2009) [see (5)] above, I'm surprised Dr. Box didn't recommend it's rejection on that basis. Now he’s turned the issue into exactly the form of nonsense that the misrepresenters are more than comfortable with – a blog circus. He's made it all the easier for those that dump confidential reviews on their blogs as part of a complaint about unfair treatment during review - they can now say "well Dr. Box did it". To answer the “lingering questions” posed in the top post: 1. ”Why did Frauenfeld, Knappenberger, and Michaels not include year 2010 data when they were asked to and when the data were readily available, yet the other papers containing the 2010 data published before theirs did?” The answer is (see [2] above), that data to include 2010 in the FKM2011 model for Greenland melt based on independently compiled S. Greenland temperature data wasn’t available either at the time of submission or right through the review process, and may still not be available. 2. “Why did the journal publish this paper without the requested revisions?” The answer is because the major requested revision was considered unreasonable (a justifiable decision in my opinion), and because other obvious revisions that would have improved the paper apparently weren’t requested (at least by Dr. Box). It’s a little late in the day to complain about this now, and isn’t very professional to do so on a blog! And one might as well point out that it's bleedin' obvious that Greenland temperatures were extremely high during 2010, and that this was the (so far) record melt season. It's not as if this can be hidden! An unnecessary storm in a teacup... -
damorbel at 18:14 PM on 2 May 2011Renewables can't provide baseload power
This thread presents a false dichotomy. The problem with renewables - except for hydro - is that they cannot provide peak load either. Hydro, in the form of pumped storage, is used where possible right now, it is not likely to be expandable to meet the difficult volatility problems arising from wind, wave and solar renewables and the slightly more tractable tidal variability.Moderator Response: [muoncounter] Before we get going with multiple-hundreds of comments, please note that unsubstantiated claims have little or no value. Your statement about pumped storage not likely to be expandable falls into that category.Note the older version of this thread also addresses many of these points.
-
chris1204 at 17:38 PM on 2 May 2011How climate change deniers led me to set up Skeptical Science website
DB: Thank you for your courteous response. Wouldn't the Judith Curry citation alone (admittedly from another Skeptical Science thread) qualify under the Comments Policy as an ad hominem remark? I guess so much of reality is in the eye of the beholder. However, Ken's integrity was fiercely attacked especially in the Flanner thread. I've never met Ken, have never corresponded with him, and indeed know nothing about him save what I have gleaned from his comments. I really don't want to regurgitate the arguments. However, looking at the Miriam-Webster definition of “ad hominem,” I note two meanings: 1) appealing to feelings or prejudices rather than intellect 2) marked by or being an attack on an opponent's character rather than by an answer to the contentions I suspect rightly or wrongly that the website moderators might be relying on the literal meaning as in (2) sometimes referred to as “Play the man and not the ball.” However, I think there has been evidence aplenty of appeals to feelings (if not prejudices) rather than intellect on this and other threads. Marcus' most recent comments ("I will simply continue to dismiss [Ken] as a one-eyed contrarian") possibly fall into this latter category. As someone who has spent the better part of a professional lifetime writing reports and giving expert evidence in court, I've learnt that courtesy and politeness even towards people with whom you strongly disagree is integral to good argument. Knowing and acknowledging the weaknesses of your own position/ hypothesis is equally vital. In relation to the latter, I don't recall any sceptic here citing Plimer or Monckton in support of their positions both of whom I find somewhat an embarrassment (but I'm happy to stand corrected). I've also learnt that labelling others' arguments as "ridiculous" or "bad" invariably spills over into an inference that the proponents of these arguments are being deliberately obtuse or posting only to make trouble. It is far better to state that an argument is "flawed" and to point out the flaw without rhetorical flourishes. Simple formulae on the lines of "With respect" are essential lubricants of a genuine civil discourse. Other formulae on the lines of "You may have overlooked this" or "Have you considered such and such?" are equally helpful. It takes a patience and consideration but it’s always worth it in the end. I note a couple of contributors have suggested that I ought to look at what takes place on other sites. With respect, I’m not that naïve. I know the blogosphere is all too often a feral place. However, it doesn't need to be.Response:[DB] Thank you, Chris, for taking the time to make your reply.
I don't know who brought Judith's home on the webs into play here, but the only difference between that & CA or WUWT is the spelling of the URL. I simply do not care for the lack of respect, invective and abandonment of science and the scientific method expressed daily there.
WRT Skeptical Science and the dialogue on the various threads: it is an on-going work-in-progress keeping the conversation on-topic and focused on the science and not on the individual. The moderators are human and sometimes miss things. Nor is there any wish to stifle the conversation or dictate its direction.
That being said, certain individuals have taken it upon themselves to derail discussions on various threads. Some refuse to adhere to the Comments Policy, treating it as an optional practice not only not applicable to them, but raise a fuss and commotion when they force the moderators to intervene (further derailing the dialogue). Please realize that what the reader sees is but the tip of the moderation iceberg: the 90% of comments you don't see simply beggar belief. And yes, some of the most egregious were written by active contributors to SkS.
So it's a no-win scenario.
While I appreciate the candor and the striving for calm, invective-free dialogue you call for, please realize we are trying, and that Skeptical Science is one of the best places to interact in its online community of all the various climate science blogs on the Internet.
If you choose to remain & participate here, your contributions are welcome. If you choose not to, then I'm sorry to say that you will be the one depriving yourself of some of the best science dialogue available anywhere on the Internet. And I will miss the moderating example you have set.
-
Marcus at 16:31 PM on 2 May 2011How climate change deniers led me to set up Skeptical Science website
"This last seems largely in response to Ken’s tongue in cheek references to belief in the angelic qualities of human nature and the apocalyptic tone underlying the predictions of the Club of Rome with a mild jibe recycling a chestnut relating to angels dancing on pinheads (none of this sounded even mildly religious in tone)." No Chris, my comments were in relation to Ken's *constant* insinuations-& outright accusations-that the consensus regarding AGW are some kind of religious belief-even though its clearly backed up by more than 100 years of physics & chemistry. Now had his comments been deleted, I'd have said nothing, but there's only so much denigration of the scientific community that I can stand-from Contrarians-before I'll step forward & say my peace, even if that involves intemperate language. Now, if Ken would like to stop making unfounded attacks on the proponents of AGW, & offer a more credible theory for the last 30 years of warming, then I'll be quite happy to respond in a civil fashion. Heck, I'd even like to see him take a break for long enough to make a criticism of the massive errors made by the more prominent members of his own side of the debate. Until he does so, then I will simply continue to dismiss him as a one-eyed contrarian. -
johnd at 14:28 PM on 2 May 2011CO2 is plant food? If only it were so simple
Ian Forrester at 12:29 PM, whilst the paper you referenced studied the relationship between the maximum and minimum temperatures, as well as measured solar radiation, to rice yields, it also allows comparison to be made between how solar radiation over the trial period, which steadily increased from about 15.5MJ/m2/day to about 18MJ/m2/day, correlates closer with the minimum temperatures than the maximum. What do you think the connection is and what mechanism might link the increasing solar radiation to the rice yields given the physiological mechanisms that might link any decrease in yields and the night temperatures are unknown. One thing I feel the study has missed including is cloud cover given clouds are most relevant the radiating off of heat at night. Not having data regarding cloud coverage means yet another assumption has to be made. -
chris1204 at 14:23 PM on 2 May 2011How climate change deniers led me to set up Skeptical Science website
I had originally decided not to make any further posts on this topic. However, the sheer weight of ad hominem argument levelled at Ken beggars belief and can't go unremarked. Even more astonishing is the seeming inability of so many contributors to discern in themselves the very behaviours they attribute to Ken. Then again, it shouldn't surprise me knowing what I know about human nature. For my part, I was bemused when taken to task for describing this as a "warmist" site. I don’t see anything wrong in such a portrayal. If you look at Newcomers, Start Here, you will read: If you're new to the climate debate (or are of the mind that there's no evidence for man-made global warming), a good starting point is 10 Indicators of Global Warming which lays out the evidence that warming is happening and the follow-up article, 10 Human Fingerprints on Climate Change which lays out the evidence that humans are the cause. More detail is available in empirical evidence that humans are causing global warming. Contrary to what you may have heard, the case for man-made global warming doesn't hang on models or theory - it's built on direct measurements of many different parts of the climate, all pointing to a single, coherent answer. This sounds very "warmist" to me if by "warmist" you mean (as I do) being of the belief that we are facing an era of unprecedented global warming (and the holder of that belief is rightly characterised by Ken as “a believer” in AGW). I see nothing pejorative in such a description just as I see nothing pejorative in calling Richard Dawkins a 'believer' in Evolution, and Stephen Hawking a 'believer' in the Big Bang Theory. I also happen to think a "warmist" outlook is a perfectly legitimate and very necessary standpoint. Without a coherent hypothesis, science becomes merely an incoherent amalgamation of interesting facts. "Warmism," however is not the only standpoint. While the physics behind CO2 as a greenhouse gas and the impact on temperature in a simple black body radiative transfer model are unassailable, robust debates exist as to the role of other competing forcings and feedbacks. Judith Curry’s Climate Etc has managed to create a very civilised forum with vigorous contributions from “warmists,” “lukewarmers,” sceptics,” and “deniers” alike all treated with equal courtesy and respect. Oh dear, I forgot: Curry is going to be reviled 20 years from now as the scientist who abandoned her profession, her beliefs, and her integrity in order to become a professional concern troll for denialism. Moreover, we take for granted courtesy of Marcus @ 50: …its [sic] Denialism that seems closest to a religion in its nature… [with its] complete inability to acknowledge even the most glaring errors on the part of their High Priests, & what you've got is something that looks increasingly like a *cult*. This last seems largely in response to Ken’s tongue in cheek references to belief in the angelic qualities of human nature and the apocalyptic tone underlying the predictions of the Club of Rome with a mild jibe recycling a chestnut relating to angels dancing on pinheads (none of this sounded even mildly religious in tone). Still, I must make allowances for the sensitivities of those like Sphaerica for whom [t]hese subtle little jabs, meant to prey on people's perceptions of the scientists, do not go unnoticed. Of course, all this is somehow compatible with the comments policy about ad hominem attacks stating: Attacking other users or anyone holding a different opinion to you is common in debates but gets us no closer to understanding the science. For example, comments containing the words 'religion' and 'conspiracy' tend to get deleted. Comments using labels like 'alarmist' and 'denier' are usually skating on thin ice.Response:[DB] Chris, I have long considered you to be one of the few "real" skeptics participating in this forum (along with Eric (Skeptic)). While I'm glad to see you occasionally participating again, I feel I must step in here.
First of all, what definition are you using for ad hominem? The issues I have seen revolve primarily around KL's continual running afoul of the Comments Policy (which I no longer consider accidental) and the reactions that engenders in others. This is not to excuse the comments from others in reply to KL, for those receive moderation too. However, most differentiate between attacking KL and his beliefs/motives and focus on his arguments. The former is a violation while the latter is not. If you can point to examples of the former for me, I will gladly revisit those comments.
I hope you will reconsider your inactivity & continue to be an active contributor here, for I feel you have long been a moderating influence.
-
angusmac at 13:57 PM on 2 May 2011Lindzen Illusion #2: Lindzen vs. Hansen - the Sleek Veneer of the 1980s
Moderator Response @35 Yes there was a robust discussion but there was no misubnderstanding on my part. Your arguement basically is that Scenario C is irrelevant because it does not follow actual emmissions. Therefore, it is a coincidence that real-world temperatures follow it. It is possible that the accuracy of Scenario C is a coincidence. However, if real world temperatures continue to follow it then we will need to re-evaluate our current theories/hypotheses on climate forcing. Scenario B would then become irrelevant. Hansen (2006) suggests that we should be able to differentiate between Scenarios B and C by 2015.Response:[DB] You are basing your misinterpretations on a graph. Real life follows physics. Hansen based his modeled projections for the various scenarios (A, B and C) on a climate sensitivity factor that was too high - for each of the scenarios.
Adjustment of the sensitivity to what our current understanding shows it to be yields a much tighter fit to the Scenario B track for actual temperatures than it does for Scenario C. And for down the road, actual emissions diverge widely from the assumptions for Scenario C, so temperatures in the real world will track emissions because of physics, diverging even more widely from those in Scenario C.
You were told all of this before in the thread referenced in comment #35. Why you refuse to understand any of it is beyond me.
-
Marcus at 13:56 PM on 2 May 2011CO2 is plant food? If only it were so simple
The only ones grasping at straws here, DLB, are you & your fellow Contrarians. You're all so desperate for there to be some "silver lining" attached to rising CO2 emissions that you're blindly grasping at an incredibly poor understanding of High School Biology. We've already highlighted here that plant growth will-ultimately-be limited by factors *other* than CO2, & that rising CO2 emissions will have several highly detrimental impacts on crops even *before* we consider the effects of climate. -
Marcus at 13:38 PM on 2 May 2011Frauenfeld, Knappenberger, and Michaels 2011: Obsolescence by Design?
"Global Warming and Global Cooling are natural unstoppable cycles. There have been much hotter global temperatures than the present, as late as 1100 years ago when the Arctic ocean was navigable and Greenland was indeed a green temperate land." Wow, talk about 'Garbage In, Garbage Out'. For the record, temperatures during the height of the MWP were *lower* than what they are today-& it took several centuries for temperatures to reach that peak. Also, Greenland was *never* a green & temperate land. Springs/Summers on the Southern Coast of Greenland were certainly more temperate during the MWP than in the periods before & after it-but Winters were still extremely harsh & cold, & there is little evidence that Glacier retreat in 1100AD ever reached levels like those we've been seeing over the last 40 years. -
Marcus at 13:33 PM on 2 May 2011Lindzen Illusion #2: Lindzen vs. Hansen - the Sleek Veneer of the 1980s
...and here we have another denialist trick courtesy of RW1-namely the "appeal to authority". However, given Lindzen's total lack of credibility, appeals to *him* as an authority are liable to receive nothing but gales of laughter from those who treat science more seriously than those in denial. Also, RW1, according to GISSTemp-which actually incorporates polar temperature-temperatures for January to March have averaged around +0.5 degrees above the 1951-1990 mean temperature. This, in *spite* of record cold winters along the Atlantic Coasts, & in spite of an ongoing La Nina. As we've now come out of the La Nina, & are now approaching the NH Summer, I think its fair to say that average temperatures for 2011 will almost certainly be equal to-if not greater than-the average temperature for 2010. -
Albatross at 13:26 PM on 2 May 2011Lindzen Illusion #2: Lindzen vs. Hansen - the Sleek Veneer of the 1980s
Regarding the rather bizarre quote posted @50. It so perfectly demonstrates the inanity and fallacy of Lindzen's opinion on this serious issue :) Ironically he is falsely accusing others of the very things that he is guilty of. Lindzen managed to squeeze in at least four misp-representations of the facts and the science in that quote. Whenever he made that quote, he had clearly long since abandoned (and turned his back on) serious science... -
kdkd at 13:14 PM on 2 May 2011Frauenfeld, Knappenberger, and Michaels 2011: Obsolescence by Design?
BP #21 Nope, sorry. You can still estimate 0 from that, without having a precise measurement of 0. Your argument is invalid, as it is a variant of the old so-called-skeptic canard that inexact knowledge is equivalent to no knowledge. -
dana1981 at 13:04 PM on 2 May 2011Video and podcast about confusing the hockey stick with the 'decline'
Well if you read the end of the rebuttal, you'll see a couple plans for producing 100% energy from renewable sources using existing technology. So I disagree with it not being ready for prime time. And you also have to add this to the list of renewable pros, or at least take it off the cons. -
scaddenp at 12:52 PM on 2 May 2011Models are unreliable
"Don't you expect some surface cooling with the fresh meltwater that won't sink? Isn't this heat redistrubution?" That would be why DO have climate effects coming out of interglacial but not now? -
RW1 at 12:50 PM on 2 May 2011Lindzen Illusion #2: Lindzen vs. Hansen - the Sleek Veneer of the 1980s
"The fact that the developed world went into hysterics over changes in global mean temperature anomaly of a few tenths of a degree will astound future generations. Such hysteria simply represents the scientific illiteracy of much of the public, the susceptibility of the public to the substitution of repetition for truth, and the exploitation of these weaknesses by politicians, environmental promoters, and, after 20 years of media drum beating, many others as well. Climate is always changing." - Richard LindzenModerator Response: [DB] RW, it is simply unacceptable here to post a quotation without providing both context for the quote and a linked source for the quote. That part of Skeptical Science ain't a-changin', despite the clamor of "skeptics". -
trunkmonkey at 12:37 PM on 2 May 2011Models are unreliable
354. I was rounding up. The models are initialized at 280ppm in 1750 or whatever, but humans have been burning since fire was domesticated. How much CO2 would you figure was released by the burning of the European oak forest (much of it to slake lime)? It is believed neolithic (and probably paleolithic) hunters routinely set uncontrolled fires to promote savannah at the expense of forest and chapparal. DO/Bond Don't you expect some surface cooling with the fresh meltwater that won't sink? Isn't this heat redistrubution? Why is the Atlantic deepwater way more oxygenated than the Pacific?Moderator Response: [DB] As for your first part, if I see where you're going with that, you should look into Ruddiman's Hypothesis. Ruddiman himself has a recent (and still active) thread over at Real Climate where Ruddiman has been answering questions. -
Ian Forrester at 12:29 PM on 2 May 2011CO2 is plant food? If only it were so simple
DLB said:Imagine a wetter world, crops like rice would boom
Unfortunately, a warmer climate will reduce rice yields. Rice is particularly susceptible to a rise in minimum temperatures, which is what happens with AGW i.e. minimum temperatures will rise faster than maximum temperatures:Grain yield declined by 10% for each 1°C increase in growing-season minimum temperature in the dry season, whereas the effect of maximum temperature on crop yield was insignificant. This report provides a direct evidence of decreased rice yields from increased nighttime temperature associated with global warming.
This is why it is much better to actually see what the science tells us rather than making predictions based on the hope that CO2 pollution will result in positive effects. -
Dan Moutal at 11:55 AM on 2 May 2011Video and podcast about confusing the hockey stick with the 'decline'
I may need to clarify something here in regards to renewables and baseload power. I probably oversimplified things in the podcast, but it seems to me that most of the solution presented in the "Renewables can't provide baseload" article have yet to be tested at the required scale. Nuclear has. What I see see with renewables and baseload power is a bunch of interesting solutions to a tough problem that are almost but not quite read for prime time. I may be overly pessimistic here (actually I hope I am), but I have seen little evidence to support that yet. But arguing this point is a little besides the point. We need to look at energy generation and properly weight the pros and cons of of all available technologies. -
Bernard J. at 11:55 AM on 2 May 2011CO2 is plant food? If only it were so simple
DVB. You obviously haven't comprehended the explanations of the ecophysiological responses of plants such as rice, or the implication of temperature increase in the future. The whole point of this thread is that many of the "winners" are likely not to be of human benefit, and many of the "losers" will be profound in their loss to humans. Your comment about rice explicitly demonstrates that you know not about what you speak. If you disagree with this assessment, you will of course be able to support your statement that "undoubtedly there will be more winners" with actual peer-reviewed science. Your time starts now. -
scaddenp at 11:46 AM on 2 May 2011CO2 effect is saturated
BTW. Science of Doom has just done interesting article question of how much absorbance is in the weak lines versus the "far wings" of individual lines. Illuminating. -
Rob Honeycutt at 11:33 AM on 2 May 2011Frauenfeld, Knappenberger, and Michaels 2011: Obsolescence by Design?
Sorry... I just read what I wrote. It came off a little more gruff than I had intended. -
HumanityRules at 11:23 AM on 2 May 2011Frauenfeld, Knappenberger, and Michaels 2011: Obsolescence by Design?
The Tendesco link seems to be broken so it's difficult to comment on that paper. The Mernild paper was accepted on 8 April 2011 while the FCM paper was accepted on 31 January 2011. The 2+ month intervening period seems sufficient for the fully QC'd data to become publically available for Mernild to be able to introduce the 2010 data. It's also notable that the FCM review process took 5 1/2 months while the Milnild took 2 1/2 months. I think FCM have responded to these allergations, it would have been useful for the sake of balance to have seen what they had to say. Knappenberger explanation of the situation is provided in the link below, it seems fairly convincing even given the fact these are the bad guys! It's telling that he thinks 2010's data would not have changed the overall conclusion. http://rankexploits.com/musings/2011/reviewer-outs-himself/ Rather than make allegations about the authors motives it strikes me the more scientific thing to do would be to take the authors methodlogy and data and apply the 2010 data to it. Then tell us if the 2010 data has had any impact on the FCM conclusions. It seems Jason Box would have been in a perfect position to do this rather than write a less satisfactory blog post full of difficult to prove allegations. In fact such work would surely be publishable as a comment on the FCM paper if it added anything new. An attempt at a 226 year Greenland ice melt seems like a worthy attempt at extending our knowledge of the climate system. I think it's the general conclusions of the paper that is upsetting some people not the inclusion or not of one years data.Moderator Response:[DB] The Tedesco & Fettweis paper can be found here. Dr Box is an expert on Greenland glaciology. As for Knappenberger's thoughts on 2010 not making a difference, perhaps you both should read the original post at top, where it clearly DOES make a difference, to the point of completely invalidating the FKM paper's conclusions.
Any worthy attempt at extending our knowledge of the climate system would surely have included the latest data (especially considering the record melt of the GIS was common knowledge, widely known even in the lay community by September), which was available to the authors of the FKM paper. Which they opted to not use.
Science:Fail.
-
DLB at 11:19 AM on 2 May 2011CO2 is plant food? If only it were so simple
Increasing any growth limiting factor is going to increase primary productivity and of course there are going to be resultant winners and losers. Imagine a wetter world, crops like rice would boom while dryland crops like wheat would fall prey to fungal attack. A similar scenario would happen with CO2 for other species but undoubtedly there will be more winners. Sorry, this article is grasping at straws, if you (AGW community) want to spar with the sceptics find an argument with a lot more uncertainty like CO2 and climate. -
Rob Honeycutt at 11:18 AM on 2 May 2011Frauenfeld, Knappenberger, and Michaels 2011: Obsolescence by Design?
Raymond @ 22... Can you please explain what any of that has to do with the topic of this article? Please read the comments policy.Moderator Response: [DB] Raymond is a new commenter. -
GCNP58 at 11:13 AM on 2 May 2011Frauenfeld, Knappenberger, and Michaels 2011: Obsolescence by Design?
Liu, the assoc. editor for this paper, was a post-doc of Judy Curry's. The same Curry that decried "tribalism" in science. Do I need to spell this out for anyone in more detail? -
scaddenp at 11:10 AM on 2 May 2011CO2 effect is saturated
Are you seriously unaware of problems with the Paltridge paper? (The re-analysis is not up to doing trends - this is widely reported). -
Raymond F. Smith at 11:09 AM on 2 May 2011Frauenfeld, Knappenberger, and Michaels 2011: Obsolescence by Design?
Global Warming and Global Cooling are natural unstoppable cycles. There have been much hotter global temperatures than the present, as late as 1100 years ago when the Arctic ocean was navigable and Greenland was indeed a green temperate land. Our Western way of living is dependent on using far more energy than is our share. But everybody demands the same quality of living which they reasonably equate with the amount of energy we use. It is the available energy that we have now that provides for the energy-dependent foods we squander. By 2060, that is only fifty more years, this abundant energy will have been used up. The consequences of this is that we will be dependent on the food we grow ourselves within walking distance of where our one-room house is. Perhaps you might believe the people who constantly tell us that by then we will have found some new energy source. But consider this: in 1950 the wisest scientists predicted that fusion energy would cater for all future energy needs, and so squillions of dollars have been spent in the past 60 years trying to get it to work, without success. We are no nearer to achieving it than we were 60 years ago. That is probably because of the physical problems of containing and using the pressures and heat of fusion energy. Remember, it was less than a kilogram of hydrogen that produced the largest ever explosion. There is some questionable evidence that the temperature rise which we are experiencing now, may be faster than we might expect. However, this would more likely be due to the heat caused by our energy-dependent lifestyle, because practically all energy sources are fossil fuels which produce heat and electricity which is eventually converted to heat. So if is that extra heat you want to get rid of, you must reduce the demand for energy, and that consequently means reducing the number of people demanding energy — one of those kinds of difficult problems that politicians just don’t have the guts to tackle, so they create imaginary scapegoats like carbon dioxide. Raymond F. Smith Retired, formerly: Senior Lecturer in Communications Media at the Regional Centre for Education in Science And Mathematics, Malaysia. Area Specialist with the Australian Science Education ProjectModerator Response: [DB] Raymond, let me first say "Welcome to Skeptical Science!" However, your comment is riddled with misunderstandings and errors; it is obvious you've been misinformed. Fortunately you've come to a place where you can get the "straight story" on climate related questions and issues. There is an immense amount of reference material discussed here and it can be a bit difficult at first to find an answer to your questions. That's why we recommend that Newcomers, Start Here and then learn The Big Picture.I also recommend watching this video on why CO2 is the biggest climate control knob in Earth's history.
Further general questions can usually be be answered by first using the Search function in the upper left of every Skeptical Science page to see if there is already a post on it (odds are, there is). If you still have questions, use the Search function located in the upper left of every page here at Skeptical Science and post your question on the most pertinent thread.
Remember to frame your questions in compliance with the Comments Policy and lastly, to use the Preview function below the comment box to ensure that any html tags you're using work properly.
As a communicator, I'm sure you understand the need to be properly informed on an issue before speaking on it.
-
scaddenp at 11:01 AM on 2 May 2011Lindzen Illusion #2: Lindzen vs. Hansen - the Sleek Veneer of the 1980s
Some days in winter are warmer than some days in summer - so why cant I grow tomatos in winter then? Oh and if 0.3C was nothing to get concerned about then I guess 0.4 colder (LIA) is also no problem? -
dana1981 at 10:50 AM on 2 May 2011Video and podcast about confusing the hockey stick with the 'decline'
By the way, I just updated that rebuttal to include the 100% renewable energy production by 2050 posts. -
dana1981 at 10:43 AM on 2 May 2011Video and podcast about confusing the hockey stick with the 'decline'
Dan's podcast was mostly good, but John is right that he should read "Renewables can't provide baseload". -
scaddenp at 10:42 AM on 2 May 2011Models are unreliable
"I care deeply about this. It may be the defining issue of our time." How about reading Ch6 (Paleoclimate) of the WG1 then? I think you will find what want in the referenced papers. Nature of DO's. Well DO events appear to only have strong climatic effect when exiting a glacial. Its not the adding of CO2 that changes things but loss of the ice sheet. Candidates for Bond/Heinrich/DO events - solar and changes to thermohaline circulation. Any of those happening to explain the current warming? Nope. -
Berényi Péter at 10:34 AM on 2 May 2011Frauenfeld, Knappenberger, and Michaels 2011: Obsolescence by Design?
#17 kdkd at 09:00 AM on 2 May, 2011 Yes, that should probably read "Satellites have helped infer an energy imbalance at the top of the Earth's atmosphere". As Trenberth puts it "the satellite measurements are sufficiently stable from one year to the next, so that by measuring incoming solar radiation and outgoing infrared radiation it is possible to track changes in the net radiation". That's all. One only has to integrate net radiative imbalance (the derivative of heat content anomaly) for an extended period. It could help infer an energy imbalance at the top of the Earth's atmosphere if the offset is given. But it is not given. Therefore there is an unknown additive linear term in the energy content, that is, no trend can be determined this way. Which means it does not even help to infer the imbalance.Response:[DB] Anyone who wants to respond to this needs to do so on the Tracking-the-energy-from-global-warming thread, where this subject more properly belongs. Thanks!
-
Ken Lambert at 10:13 AM on 2 May 2011A Flanner in the Works for Snow and Ice
Sphaerica The 4.14 - 5.69E20 number relates to the Arctic which is the area Tom Curtis has been calculating with the reduction in sea ice and decreased albedo. Remember the 1-2 million sq.km lost each summer? Tom then threw in Greenland ice loss - so I added that in the above number for comparison. Are you suggesting that Tom's 9.17E20 Joules applies to snow and ice for the whole northern hemisphere? -
Marcus at 10:08 AM on 2 May 2011Lindzen Illusion #2: Lindzen vs. Hansen - the Sleek Veneer of the 1980s
Ah, I see RW1 uses all the typical Denialist tricks-first by trying to make a trend out of a single month of data (apparently he is unfamiliar with monthly variability), ignores the fact that March still lay within a relatively strong La Nina & also relies on data that specifically excludes the polar regions-those parts of the globe that are warming the fastest. I think this guy has achieved the Denialist Trifecta. -
Marcus at 09:57 AM on 2 May 2011Frauenfeld, Knappenberger, and Michaels 2011: Obsolescence by Design?
Yes, very good point Eveningperson. After all, if 'the market' were so Omniscient, then how did they so epically fail to see the GFC before it hit? I find it interesting how people like Mozart place so much faith in "the market", yet appear totally distrustful of hard science! -
Marcus at 09:55 AM on 2 May 2011How climate change deniers led me to set up Skeptical Science website
Yes, I've noticed that its Denialism that seems closest to a religion in its nature. How often do we see the various Contrarians blindly repeating the Mantras of their various High Priests (Monckton, Lindzen, Christy et al) even when those Mantras have no scientific evidence to back them up. Throw in their complete inability to acknowledge even the most glaring errors on the part of their High Priests, & what you've got is something that looks increasingly like a *cult*. -
Berényi Péter at 09:51 AM on 2 May 2011CO2 effect is saturated
#162 KR at 07:06 AM on 2 May, 2011 But, quite frankly, we have plenty of data on relative and absolute humidity from other sources over the last 50-70 years Really? Other than balloon radiosonde data? Because on face value those show decreasing specific humidity above the 700 hPa level (between 1973 and 2007). If you have other data, please show us. The conclusion from all these papers? That CO2 is not saturated, and that the last quarter century of satellite data shows increasing effects at the GHG frequencies expected from GHG concentrations and the spectroscopic physics. If you look at the raw brightness temperature data, you can see that average brightness temperature change in the high frequency wing of the main CO2 emission band (wavenumber 710 - 760 cm-1) between 1970 and 1996 is negligible. You can suppose there is a large decrease masked by changes in atmospheric temperature and moisture fields and you can assume those fields behaved just like that, but that is not measurement. If average specific humidity in fact shows a decreasing trend above 700 hPa (as measured), that is inconsistent with masking. If a computational climate model like CRUTEM3 indicates otherwise, it is still not measurement, but a theoretical result contradicted by measurement. If average brightness temperature decreased by 1°C in said band, that would decrease OLR (Outgoing Longwave Radiation) by about 0.2 W/m2. However, raw brightness temperature data show it was less than 1°C (and possibly zero). The low frequency wing was not measured, but that's already outside the main atmospheric window and overlaps with pretty strong H2O absorption lines, so its effect is probably even less pronounced. The question is not whether the CO2 effect is saturated or not, but if it is saturated enough to exclude a strong effect. The same way as in the case when one has to choose between a spherical vs. flat Earth model. Then the differences between a sphere and the geoid are surely negligible. -
werecow at 09:35 AM on 2 May 2011Rescue Climate Data
These data are neatly typed and, with a bit of preprocessing, should be conducive to using automated character recognition! Has anyone considered automating part of this? You could do an OCR scan on the images, use that to fill in the appropriate columns a priori, and then have several volunteers check the results. That should make their lives much easier. You can even make the OCR "trainable" to extend it to other type writer fonts, and possibly enhance it further by using some outlier detection. I have only limited experience with OCR myself, but it looks like this would be a pretty good option here. -
eveningperson at 09:25 AM on 2 May 2011Frauenfeld, Knappenberger, and Michaels 2011: Obsolescence by Design?
@mozart: "It seems the market, distilling all the information available, is not particularly worried." One might think that, after the experiences of the last few years, people would realise that "the market" does not magically distil all available information. In fact the behaviour of "the market" is determined by the prejudices and misconceptions of those individuals acting in it. And, as is only too clear there are powerful, moneyed forces intervening in particular markets to create confusion and misinformation. The clearest thinking on climate change, outside the climate scientists themselves, appears to be in the insurance industry, which stands to lose badly from climate change if it gets the facts wrong. And it takes the science seriously. -
David Horton at 09:08 AM on 2 May 2011Frauenfeld, Knappenberger, and Michaels 2011: Obsolescence by Design?
What kind of "scientists", having written a paper on what they believed was a trend (or lack of trend) to the year 2009, would, on discovering that the year 2010 totally reversed their conclusions, go ahead and publish their original hypothesis anyway? Is there a word for the complete opposite of normal scientific process? -
kdkd at 09:00 AM on 2 May 2011Frauenfeld, Knappenberger, and Michaels 2011: Obsolescence by Design?
BP #16 Yes, that should probably read "Satellites have helped infer an energy imbalance at the top of the Earth's atmosphere". There are many things in the science of measurement that we can not observe directly for a variety of reasons. I assume that you're not suggesting that none of these things exist. -
Berényi Péter at 08:02 AM on 2 May 2011Frauenfeld, Knappenberger, and Michaels 2011: Obsolescence by Design?
"Satellites have measured an energy imbalance at the top of the Earth's atmosphere". This proposition is not true. See e.g. Trenberth 2009: "There is a TOA imbalance of 6.4 W m-2 from CERES data and this is outside of the realm of current estimates of global imbalances that are expected from observed increases in carbon dioxide and other greenhouse gases in the atmosphere". Or Trenberh 2010: "The difference between the incoming and outgoing energy -- the planetary energy imbalance -- at the top of the atmosphere is too small to be measured directly from satellites".Moderator Response: [DB] Your criticism more properly belongs on the thread you reference: Tracking-the-energy-from-global-warming (you will find several of your comments there already). This thread is about FKM's publishing of an obsolete paper. -
Albatross at 07:57 AM on 2 May 2011How climate change deniers led me to set up Skeptical Science website
John C., I very much look forward to reading your book. The psychology of those who deny the reality of AGW and its potentially serious consequences for humanity is fascinating. I will be placing a request for the city's main library to buy a few copies of your book-- close to a million people have access to the library :) -
Albatross at 07:53 AM on 2 May 2011Lindzen Illusion #2: Lindzen vs. Hansen - the Sleek Veneer of the 1980s
RW1, Please stop trolling. -
Daniel Bailey at 07:53 AM on 2 May 2011Video and podcast about confusing the hockey stick with the 'decline'
Careful, Peter, of the little "yippers" or their leader, the "Grand Poohbah Yipper" might send you a terse email. It IS their MO...anyway, loved the vid & the not-pulling-of-punches. The denialarati won't like it, of course; most are unlikely to even click on the link, however. I'll listen to Dan's piece tonight. The Yooper -
muoncounter at 07:33 AM on 2 May 2011Lindzen Illusion #2: Lindzen vs. Hansen - the Sleek Veneer of the 1980s
d82 #45: "trend is up, and natural variability is out." It's also relevant that the temperature anomaly curve is strongly concave up. That behavior is impossible to duplicate with low sensitivity to CO2, as some claim, usually without benefit of any evidence such as these graphs. -
dana1981 at 07:27 AM on 2 May 2011Video and podcast about confusing the hockey stick with the 'decline'
Great job by Peter Sinclair. A very thorough and clear summation of the 'hide the decline' confusion. No sleight meant to Dan, I haven't listened to his show yet :-) -
KR at 07:06 AM on 2 May 2011CO2 effect is saturated
Berényi - Thank you, that does clarify matters. - You were not insinuating data manipulation by Anderson, but rather accusing Harries of overprocessing their data and reaching unwarranted conclusions. Which by implication is also an accusation against Griggs 2004 and Chen 2007, as their results agree with Harries. - Secondly, the Anderson data was indeed inappropriate to compare directly to Harries, as you did earlier. Finally, I will note that Anderson has stated that he cannot make conclusions about moisture from the data points. I don't have a copy of Harries readily available, I don't know what they wrote on that subject. But, quite frankly, we have plenty of data on relative and absolute humidity from other sources over the last 50-70 years, and adjust accordingly. The conclusion from all these papers? That CO2 is not saturated, and that the last quarter century of satellite data shows increasing effects at the GHG frequencies expected from GHG concentrations and the spectroscopic physics. -
d82 at 06:33 AM on 2 May 2011Lindzen Illusion #2: Lindzen vs. Hansen - the Sleek Veneer of the 1980s
RW1@42, There is more than UAH data to look at. See the NOAA webpage of the tropospheric data up to 2010. Taking the decadal averages of these data since 1958 (including the balloon data) and comparing them with the decadal averages of the combined Land-Ocean data and the predictions of the NASA/GISS group of Hansen et al. in 1981, 1988 (solution B) and the 2007 update (red square for the 2010's) gives the following picture:
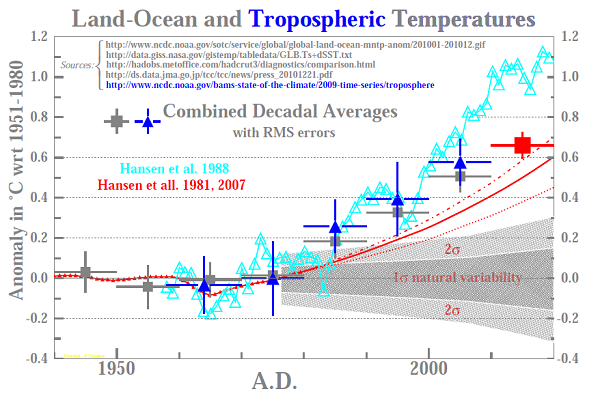 The trend is up, and natural variability is out. For more details click here.
-
RW1 at 06:28 AM on 2 May 2011Lindzen Illusion #2: Lindzen vs. Hansen - the Sleek Veneer of the 1980s
The point is the amount global average temperature can fluctuate from year to year is greater than the whole of the 30 year trend. This means the trend is well within the range of natural variability and not statistically significant. Furthermore, the 0.3 to 0.4 trend is barely even outside the margin of error. Talk about trying to make Mt. Everest out of a mole hill. No wonder Lindzen has trouble taking any of this kind of stuff seriously.Moderator Response:No, you are incorrect. You need to learn the basics of statistical trend analysis.
[dana1981] Indeed, it's hard to take you seriously when you can't seem to learn the difference between signal and noise.
Prev 1760 1761 1762 1763 1764 1765 1766 1767 1768 1769 1770 1771 1772 1773 1774 1775 Next


