


 Arguments


Recent Comments
Prev 1787 1788 1789 1790 1791 1792 1793 1794 1795 1796 1797 1798 1799 1800 1801 1802 Next
Comments 89701 to 89750:
-
Adam at 21:17 PM on 15 April 2011It warmed just as fast in 1860-1880 and 1910-1940
Dikran Tamino used several datasets in his graph, using more more surface station data than satellite data. The fact that his graph used mainly surface data (which showed higher warming trends), would cover up the smaller trends shown in the satellite data. Once again, I suggest you read the paper I gave you.Moderator Response: [Dikran Marsupial] If the satellite trends lie within the spread of the surface station data, that means the satellite and surface station trends are statistically similar (within their respective uncertainties). If there was a meaningful difference between the surface station trends and the satellite trends, the satellite trends would not be covered up by the surface station trends. -
Adam at 21:14 PM on 15 April 2011It warmed just as fast in 1860-1880 and 1910-1940
Dikran once again, blog posts (real climate) are not published and do not warrant a reply. Only published criticism counts. Anyway, the real climate article in question has indeed been refuted. See here and here.Moderator Response: [Dikran Marsupial] Very few papers that are incorrect are ever the subject published comments, generally the just get ignored and end up with few citations. It is also too early to be sure that any comments papers have appeared yet, they take time to write and to get through peer review. If you are only going to accept published refutations then it is obviously disingenuous to raise a paper for discussion before there has been a proper chance for those refutations to have appeared. Besides that, if blog posts don't count, that means you will not accept any refutation given here anyway, so what is the point in anyone discussing it with you? -
Alec Cowan at 21:11 PM on 15 April 2011The e-mail 'scandal' travesty in misquoting Trenberth on
@Ken Lambert #113 Be so gracious of providing the links. About Purkey & Johnson, do they (and you) mean this? [Which is one of many works showing warming in abyssal waters and in southernmost basins]. Most of published works go that way, but I'm waiting for Gilles to completely explain/expose himself on this subject prior to provide the links and comment the conclusions. I suppose, as your appear to be commenting this in a knowledgeable manner, that you have downloaded and installed the interface to Argos data to do your own checks. How did it go? Also, when you checked Hansen's 0.9W/m2 against the black body, what ΔT did you get? What conclusions did you reach? And the supposedly cooling oceans and sea level variation, what conclusion did you get from your reality check? It speaks volumes about a person whether he or she did that or didn't. This kind of forums or comment sections are plenty of polemicists amateurs, would-be dialecticians and assorted dilettanti. One would better think it twice before asserting that salmons disprove that rivers flow from mountains to seas. -
Adam at 20:51 PM on 15 April 2011It warmed just as fast in 1860-1880 and 1910-1940
Daniel Bailey Tamino's graph was indeed a mixture of all the datasets, but the satellite trends were mostly covered up by the surface temp trends. I am not 'goal shifting'. I was focusing on Greenland temps, but Albatross was the one who made the claim that the sun could not have caused post 1970 climate change. I was simply answering, and providing a paper counter to his opinion, which simply involved tropospheric data. KR if CO2 was having at least some effect, then you would expect there to be a correlation. You're argument that there is no correlation because co2 is not the only driver of climate, pretty much shows that natural forces will always overwhelm the effect caused by CO2. The Greenland warming of 60 years ago was just the same as the current warming. They were exactly parallel to each other. I don't believe that it just a simple coincidence. Once again could you please state what forcing caused the previous Greenland warming of 60 years ago, and why you don't believe it is causing the current one?Moderator Response: [Dikran Marsupial] If the satelite trends were mostly covered up by the surface trends, does that not imply that the satelite tends are essentially the same as the surface trends? You might want to clarify that. -
Adam at 20:40 PM on 15 April 2011It warmed just as fast in 1860-1880 and 1910-1940
Daniel Bailey and Albatross, if there is no warm bias in the surface temperature record could you please explain why there is such a huge difference between satellite data and thermometer readings? Read the following paper: 'An alternative explanation for differential trends at the surface and in the lower troposphere' by Klotzbach et published in the 'Journal of Geophysical Research (2009)Moderator Response: [Dikran Marsupial] This has been discussed elsewhere, see e.g. this RealClimate article and links therein. -
Lassesson at 20:06 PM on 15 April 2011David Evans' Understanding of the Climate Goes Cold
I'm just qurious about Evan's argument saying "Even if we stopped emitting all carbon dioxide [...] it would be cooler in 2050 by about 0.015 degrees." Compared to what? Compared to today? But how much warmer will it be if we do nothing? -
David Horton at 19:54 PM on 15 April 2011David Evans' Understanding of the Climate Goes Cold
It is every piece of nonsense from every thread on every blog, all combined into one. I don't know what kind of mental process allows someone to keep copying and repeating these mistakes, without also reading the answers to them. And just on one old familiar line "evidence showing that the earth responds to the warming due to extra carbon dioxide by dampening the warming" - perhaps he should be asked to explain, in that case, how the climate has changed so radically in the past? Or does the "dampening" only happen when humans insist on burning all the stored carbon? -
Gilles at 19:53 PM on 15 April 2011David Evans' Understanding of the Climate Goes Cold
"As these figures show, estimates from both models and observational data consistently find that the most likely climate sensitivity value is approximately 3°C for a doubling of CO2. " Sorry again, but the concept of "likelihood" is totally irrelevant when aggregating a number of heterogeneous measurements and computations, none of which being really strictly speaking validated. Basing a theory of the motion of planets on the number of proposals and texts and giving a "likelihood" to the geocentric hypothesis on this criterion would have been utterly wrong - they all have been ruined by some minutes of observations of the phases of Venus by Galileo. What is worth is irrefutable scientific facts - not the number of erroneous proposals that have been made here and there. Because if the climate sensitivity has really a meaningful physical value (which is not granted) , the vast majority of all values is wrong, and if it hasn't, they're all wrong.Moderator Response: [Dikran Marsupial] Trollometer reading; |=========_|The use of "likelihood" and "likely" in either the subjectivist or objectivist Bayesian sense is perfectly reasonable. The theory of AGW is based on well understood physics: Gilles, please go and read this book to get an idea of the historical development of the theory (it is a collection of the foundational papers with commentary) and then this book to get an overview of the basic concepts. Climate sensitivity is a well-defined physical concept, whether you grant that or not, see the IPCC WG1 report. I suggest otherwise DNFTT is the correct approach here.
-
David K at 19:45 PM on 15 April 2011David Evans' Understanding of the Climate Goes Cold
Credibility or accuracy seems to not be of importance to climate deniers - they know that people will continue to cite their posts long after they get debunked. Exposing Climate Denialism -
José M. Sousa at 19:21 PM on 15 April 2011David Evans' Understanding of the Climate Goes Cold
Maybe it is worth saying that he is not a climate modeler nor has he published a single peer-reviewed article on climate change according to desmogblog: http://www.desmogblog.com/who-is-rocket-scientist-david-evans -
Gilles at 18:13 PM on 15 April 2011Video on why record-breaking snow doesn't mean global warming has stopped
so as DM reminded us several times, a scientific theory cannot be proved, but it can be disproved-actually it *is* scientific only if it *can* be disproved. So in your opinion, what could disprove AGW theory ?Moderator Response: [Dikran Marsupial] Trollometer reading: |========--|The IPCC WG1 report is full of falsifiable predictions, pick one. Additional hint, a theory about climate is unlikely to be falsified by an observation of weather; they are not the same thing. I'm glad to see you have got the idea of falsificationism at last though, and are talking about disproving rather proving theories. That at least is some progress.
-
Gilles at 18:07 PM on 15 April 2011How I lived through a carbon tax and survived to tell the tale
so 1t C producing 3t CO2, what Jaccard proposes is about 600 $/t C China currently burns about 3 Gt C/yr. What you propose is to tax them up to 1800 G$/yr The average income of chinese people is about 3000 $/yr/cap, giving about 4000 G$/yr what you propose means taxing half of the income of people much poorer than western ones. I'm sure this will impact their consumption - I'm not sure they will accept it. -
Dikran Marsupial at 18:07 PM on 15 April 2011Monckton Myth #16: Bizarro World Sea Level
Denial Maris is still just trolling, however it is good to see he has looked at a scientific paper, if not actually read it, at least he has scanned it for comments he can use out of context. This does show one of the difficulties scientists will face communicating with the general public, namely the issue of statistical significance. Very few in the general public really understand it, Daniel certainly doesn't. The increase in the rate of sea level rise that you might get from a model based calculation is going to be very small, compared with the uncertainty in the observations (see the figure). At this point, even if you were exactly correct, you would not expect the increase in rate to be statistically significant. The scientists will almost always test for statistical significance anyway and honesty report the outcome. This makes it very easy for denialists to make a hyperbolic claim as Daniel just did, that ignores that point. For another example, see the dishonest reporting of Prof. Jones' comment about statistical significance, he was honest and straightforward, and completely misrepresented by the skeptic blogs and media. I suggest we just ignore him, at least until he can demonstrate that he is not simply a denialist troll, but going back and acknowledging (including a clear statement of his position) the answers given you the previous questions he has posed. -
Arkadiusz Semczyszak at 17:56 PM on 15 April 2011Christy Crock #3: Internal Variability
Let me add a quote from this website: “Ultimately, breakthroughs in our understanding of Earth's climate evolution will come from close interactions between paleoproxy experts, paleoclimate modelers, and climate dynamicists. It is time to train a new generation of scientists familiar with all these fields.” -
Dikran Marsupial at 17:49 PM on 15 April 2011Earth hasn't warmed as much as expected
Rovinpiper I expect you are referring to the old "no warming since 1998" canard and its variants. Yes, the models do predict there will be occasional periods of a decade or two with little or no warming (or even slight cooling), even in the presence of a long term warming due to e.g. CO2 radiative forcing (i.e. AGW). See the paper by Easterling and Wehner. The models can't predict when this will happen (as it is "weather" rather than "climate") but they clearly do predict that it will happen. Yes, this does get pointed out on a regular basis, but skeptic blogs have a tendency to keep trotting out the same tired canards again and again, even though they have been debunked on a regular basis. -
RSVP at 17:37 PM on 15 April 2011Waste heat vs greenhouse warming
MichaelM 382 "Why do you stop at 200 years? " I said "generally approaches zero" just for the reason, otherwise I would have said "reaches" zero. As long as it has been growing, you are right. And the issue (I believe) is not overall climate change, but that part which is due to humans. -
RSVP at 17:29 PM on 15 April 2011Waste heat vs greenhouse warming
KR 379 "You're still claiming that energy use is somehow qualitatively different from greenhouse gas entrapment, that the heat from energy use doesn't radiate IR like the heat from the sun " Remember the form of the Stephan Boltzmann's Law that relates to what you are talking about contains the letter A. A is for area. What is the surface area when you are talking about energy delivered in a reciprocating internal combustion engine, or ocean water cooling a nuclear power plant? -
Arkadiusz Semczyszak at 17:15 PM on 15 April 2011Christy Crock #3: Internal Variability
@Albatross “So I am afraid that your papers are irrelevant to this discussion.” Nothing could be further from the truth. The changes described in the cited papers that I was rapidly and quickly - today are identical. External factors described for the past - are discussed, eg a direct effect of the TSI and volcanoes - not to prove. If past IMP was able to cause rapidly and quickly changes, perhaps eg as stochastic remainder D.-O. ... Abrupt glacial climate changes due to stochastic resonance, Ganopolski and Rahmstorf 2002., Centennial-to-millennial-scale Holocene climate variability in the North Atlantic region induced by noise, Prange, Jongma and Schulz, 2010., Holocene temperature records show millennial-scale periodicity, Loehle &Singer, 2010. Sure you can say that so much the worse for current warming - a small impulse - RF CO2 - a powerful change ... Therefore, you can also say, however, and that a further increase p.CO2 in the atmosphere is insignificant when all process of feedback has been running ... “The NIPCC is not a credible source of scientific information. It is propaganda and nothing more than a elaborate misinformation document.” 1. Please prove it on the example cited by me - instead of using "ad hominem” and invective. 2. NIPCC says the same about the IPCC. Christy is an eminent scientist - to discredit him, have done better. @Stephen Baines “... paleo climate changes and are consistent with GHE and AGW ...” - with very, very large range of possible error - yes. I think we detailed "to discuss” the Holocene Optimum and its abrupt end - in a separate post. -
MichaelM at 17:11 PM on 15 April 2011Waste heat vs greenhouse warming
RSVP 381 Why do you stop at 200 years? Prior to that the energy released must have been smaller but had been accumulating for 1000's of years surely? Why is visible light not accumulating also? -
RSVP at 16:48 PM on 15 April 2011Waste heat vs greenhouse warming
pbjamm 377 "How much energy are we talking about here? " If the value 0.028 W/m2 is correct, simply multiply this by the surface area of the Earth and then multiply by the years for which this value is the case. The total time is around 200 years, while the value 0.028 generally approaches zero as you go backwards. -
RSVP at 16:41 PM on 15 April 2011Waste heat vs greenhouse warming
muoncounter 378 "Can't argue with you there. Summers are hotter than winters; late-afternoon is the hottest part of the day. Is this news? Was this in need of an explanation?" Depends. Someone might want to believe that a day temperature high was higher (in late Spring for instance) due solely to the extra minutes that the Sun had radiated that day, when in fact it is in the main due to heat that was progressively accumulating throughout the season. As long as the pulse is ON, the energy is building, and idea that is perfectly consistent with the 1st Law of Thermodynamics. -
Dan Moutal at 16:39 PM on 15 April 2011How I lived through a carbon tax and survived to tell the tale
per tonne of CO2 equivalent emissions, I think... hmmm, might have to do some digging, but for now lets assume my memory isn't completely bonkers. -
scaddenp at 15:30 PM on 15 April 2011Monckton Myth #16: Bizarro World Sea Level
Umm, the amount of carbon is greater and sealevel is higher. The RATE of change is another story. The closest thing you can get to prediction of rate from climate response that I know of is Vermeer and Rahmstorf. Nothing unexpected here. Your use of 'catastrophic' has no meaning without definition. Perhaps a better way to approach the problem is to ask what predictions from WG2 do think is not going happen with respect to sea level rise? -
Gilles at 15:11 PM on 15 April 2011Christy Crock #3: Internal Variability
77 - but weren't 2010 conditions "implausible" in 1880, since conditions of 2010 were never met 100 years ago ? "Who cares about the "characteristic relaxation timescale for an "implausible" initialization to reach quasi-steady state?"?" I care, and I think you should. This is not trolling : its give an indication of the maximum period of variability that the model is able to simulate. 76 - Albatross : if the relevant citation is ""When you look at the possibility of natural unforced variability, you see that can cause excursions that we've seen recently", I think it's perfectly true in computer simulations since some runs show sometimes variations of 0.6 °C in three decades - but anyway as I said it not really a proof of anything.Moderator Response: [Dikran Marsupial] Sorry I am not going to respond to your trolling anymore. If you think there is a problem with the initialisation of the models, download some code and see if you can demonstrate it. Report back here when you are done. I suggest others do likewise and DNFTT. -
Gilles at 15:00 PM on 15 April 2011How I lived through a carbon tax and survived to tell the tale
sorry is your $200 per t CO2 or per t C ? -
villabolo at 14:53 PM on 15 April 2011CO2 is plant food
Did the title change on the twin post,"Too much of a good thing is a bad thing. Increasing Carbon Dioxide, as 'plant food', is not good for plants." -
villabolo at 14:45 PM on 15 April 2011CO2 is plant food
Correction on the above post. Should read: 1. CO2 is plant food. 2. CO2 is good for agriculture. They're the same idea but the layman might search for one phrase versus the other. Hence the possible title change to incorporate both phrases. -
villabolo at 14:36 PM on 15 April 2011CO2 is plant food
John (JC); I really don't see the need for redundant posts. It's somewhat like the multiple "planets warming" posts that can and have been incorporated into one rebuttal. The general public may have heard of both statements (titles): 1. CO2 is plant food 2. Too much of a good thing is a bad thing. Increasing Carbon Dioxide is not good for plants. Nonetheless, for the sake of streamlining, there should be one rebuttal. Perhaps the title could be changed, in order to capture the attention of the layman whose mind might be more focused on one phrase rather than the other. If you think that re-titling, for the sake of removing redundant posts, is recommended please let me know and I will think of something. -
Daniel Bailey at 14:20 PM on 15 April 2011Earth hasn't warmed as much as expected
Found it. The last month with below-average temperature was February 1985. That makes 313 consecutive months with temperatures above the 20th Century average. Not that anyone expected that... Betcha that streak continues for some time. The Yooper -
Daniel Bailey at 13:54 PM on 15 April 2011Earth hasn't warmed as much as expected
Thanks for that. That Chevelle pic brought back memories (we had a '71, retrofitted as an emergency response vehicle: 375 engine, glass packs, skid plate, everything...hit the gas & watch the oil companies profits spike on the tach). -
muoncounter at 13:42 PM on 15 April 2011Earth hasn't warmed as much as expected
Looks like some time in the late '70s: [source]
But everything was cooler in the '70s.
[source]
But everything was cooler in the '70s.
-
Daniel Bailey at 13:31 PM on 15 April 2011Earth hasn't warmed as much as expected
Hey, muoncounter, do you remember offhand the last month that was cooler than normal? IIRC, it was sometime in 1985, but I can't remember exactly (and am too tired to look it up). Been toying with writing a post on that subject. Like the odds on throwing "heads" with a coin 300+ consecutive times... Thanks, The Yooper -
muoncounter at 13:28 PM on 15 April 2011Earth hasn't warmed as much as expected
Rovinpiper#3: "failing to explain the relatively low amount of warming that we've seen?" Apparently you missed the point of this post? Its in the large blue letters at the top of the last paragraph: Warming is Consistent with What We Expect As if that wasn't enough, there are half a dozen other threads on climate sensitivity, which all say the same thing. And a few on predictions made as far back as 1988 which pretty much called it. If you've been paying attention, this isn't news. -
Rovinpiper at 13:14 PM on 15 April 2011Earth hasn't warmed as much as expected
Thanks for the reply, Dikran. So are these AOGCMs that incorporate aerosols also failing to explain the relatively low amount of warming that we've seen? If not, why don't mainstream climate scientists simply respond to the claim that, "Earth hasn't warmed nearly as much as the models predicted..." with "That's not true, the model of lead author et al. (year) accurately portrays the warming of the past 35 years." ?Moderator Response: [DB] Given that we've just exited the warmest decade on record, which was warmer than the 90s, which was warmer than the 80s, etc, what "relatively low amount of warming" do you refer to? -
daniel maris at 12:57 PM on 15 April 2011Monckton Myth #16: Bizarro World Sea Level
Marcus - Sorry - that was a quote from the Church and White Paper (2011) cited by Scaddenp. It doesn't seem to accord with the impression given by various posters here of an inexorable increase in the rate of sea level rise ending in catastrophic inundations. However, I think you've been instructed by DB not to engage with me on this, so be careful.Response:[DB] Church and White 2011 make no attempt to project future SLR trends; you'd know this if you'd have read it. A look at their trends:

And the overall trends in global MSL:

The overall trend is greater than linear; in order to hit the expected rise of 0.8 to 1.2 (or more) meters rise by 2100, the trend will also have to continue to increase in greater-than-linear fashion. This will have great implications for various countries around the world, something the "various posters" here have tried to convey. Why? A non-linear increase in trend won't stop on a dime...
-
Tom Curtis at 12:02 PM on 15 April 2011Muller Misinformation #2: 'leaked' tree-ring data
Steve McIntyre's "documentation" leaves a lot to be desired. After arguing strenuously that the data was not available until after September 08, he admits in an update that evidence clearly shows it was available on Sept 12th, 08. From that he concludes that it was updated on Sept 9th, on no other evidence than that that date post dates his FOI inquiry; and despite information from the website administrator (Osborne) that it was updated in August 08. Curiously, the NCDC cache of data for Briffa 98 was last updated on "Wednesday, 20-Aug-2008 11:23:45 EDT", which is consistent with a decision to publicly release the data in August of 08. Thus McIntyre is shown to follow his consistent pattern of promulgating the most negative possible view of the "hockey crews" actions which are not actually contradicted by the facts. Muller, in the meantime, misinterprets the facts presented by McIntyre to create an even more negative fantasy. -
Daniel Bailey at 11:48 AM on 15 April 2011Solar Hockey Stick
Re-reading Trenberth's rede, I think he actually used the word "tapestry"... Anyway, I'm sure Spencer & Christy can figure it out, given a decade or two to parse it. -
muoncounter at 11:44 AM on 15 April 2011Solar Hockey Stick
Yooper#68: "observed tendencies in S at a global scale were much smaller" I don't understand this: using satellites to estimate surface solar flux and the estimate (S) doesn't match the actual surface data? Sounds like a travesty to me. -
Daniel Bailey at 11:39 AM on 15 April 2011Solar Hockey Stick
From Pinker et al 2005: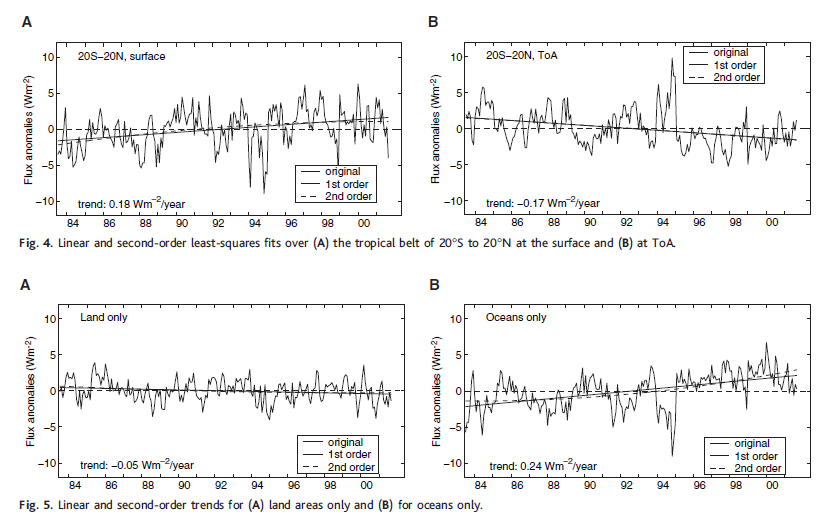 "The satellite-based record of surface solar fluxes from 1983 until 1992 does suggest some dimming, followed by an increase after 1992, as seen in numerous ground observations."
And
"The magnitudes of the observed tendencies in S at a global scale were much smaller in magnitude than those reported from ground observations."
The Yooper
"The satellite-based record of surface solar fluxes from 1983 until 1992 does suggest some dimming, followed by an increase after 1992, as seen in numerous ground observations."
And
"The magnitudes of the observed tendencies in S at a global scale were much smaller in magnitude than those reported from ground observations."
The Yooper
-
Ian Forrester at 11:33 AM on 15 April 2011Solar Hockey Stick
Eric said:Sensitivity is not a constant, it varies as a function of weather. It is likely that sensitivity was higher in the 1990's and enhanced the CO2 warming. It lowered in 2000's to amplify less.
Where on earth did you find that nonsense? Sensitivity is dependent on physics and the laws of physics do not change on decadal time frames. -
Ken Lambert at 11:29 AM on 15 April 2011A Flanner in the Works for Snow and Ice
Tom Curtis #62 Moderator: This is from #54 "The average change in sea ice area since 1978 during the summer is a reduction of 2 million square kilometers, or 2*10^12 square meters. That means the average additional energy received in the arctic summer due to global warming induce melt back is 2.2*10^21 Joules, or about a third of my rough estimate." I need to see how Tom Curtis calculated the original 2.2E21 Joules. I see how he got from 2.2 down to 1.7 in #56. -
Marcus at 11:25 AM on 15 April 2011Monckton Myth #16: Bizarro World Sea Level
"the most recent rate of rise over these short 16 year windows is at the upper end of a histogram of trends but is not statistically higher than the peaks during the 1940s and 1970s." Care to cite your source Mr Maris, or is that too much to ask of you? -
Dan Moutal at 11:23 AM on 15 April 2011How I lived through a carbon tax and survived to tell the tale
@ Giles Depends on the specific resource. As I recall the tar sands became viable when oil was roughly 30-40 dollars a barrel. But lets do a back of the envelope calculation: According to wikipedia tar sands are estimated to emit about 67 megatonnes by 2015. So a $200/tonne tax would increase the oil sands extraction costs by almost 13.5 billion. And that is only half the story, because energy consumers will emit more GHGs when they burn the oil, so they will also have to pay the carbon tax. All of a sudden low/no carbon technologies begin to look really attractive. -
daniel maris at 11:20 AM on 15 April 2011Monckton Myth #16: Bizarro World Sea Level
Scaddenp, If sea level rise is supposed to track carbon, how do you explain the following: "the most recent rate of rise over these short 16 year windows is at the upper end of a histogram of trends but is not statistically higher than the peaks during the 1940s and 1970s." Surely the amount of carbon is far higher now in the post 2000s with China and other countries' industrial expansion than was the case in the 40s and 70s but we seem to have the same sort of pattern of rises. Why?Moderator Response: [DB] Let us all observe Dikran's sage advice and refrain from enabling daniel's apparent trolling until he states an unequivocal position on the Telegraph article in question. Daniel's comment above, without any context to the topic of this thread, is off-topic. -
scaddenp at 11:09 AM on 15 April 2011Monckton Myth #16: Bizarro World Sea Level
Michael, update to Church and White (2011), at Church & White 2011. Data for paper here. -
scaddenp at 11:01 AM on 15 April 2011Monckton Myth #16: Bizarro World Sea Level
Daniel, you do realise that sealevel rise is just one of the negatives from rapid warming that concern us? (see global warming, positives and negatives for more). Disruption to water cycle is probably the worst but also the hardest to forecast accurately at regional level. Population growth is a problem for the future too but rapid warming will compound it. -
muoncounter at 10:58 AM on 15 April 2011Solar Hockey Stick
"Pinker (2005) finds that from 1992-2001 TSI at the earths surface increased" Sounds like this Pinker et al 2005: Sustained decreases in [solar radiation at the earth's surface] S have been widely reported from about the year 1960 to 1990. Here we present an estimate of global temporal variations in S by using the longest available satellite record. ... We observed an overall increase in S from 1983 to 2001 at a rate of 0.16 watts per square meter (0.10%) per year; this change is a combination of a decrease until about 1990, followed by a sustained increase. Using satellites to estimate surface; yet somehow the estimate differs from the actual surface data?Moderator Response: [DB] Scooped by the muoncounter, a fried keyboard (long story) and the need to re-register with Science online...full copy here (requires free registration with AAAS). -
Alexandre at 10:55 AM on 15 April 2011Solar Hockey Stick
Agnostic at 09:52 AM on 15 April, 2011 Do you have a link or more complete reference to that paper? It is at odds with the known TSI time series... unless he means the rising side of the Schwabe cycle. Source: NASA
-
michael sweet at 10:34 AM on 15 April 2011Monckton Myth #16: Bizarro World Sea Level
Daniel, Please cite scientific papers when posting on this site. A denier eyeballing the data with no numerical analysis does not add up to anything believable. This real scientific paper was cited earlier in the thread, obviously you missed it. Recent satalite data shows greater sea level rise.Moderator Response: [DB] Fixed URL (missing equals sign). -
Riduna at 09:52 AM on 15 April 2011Solar Hockey Stick
The article notes that Vieira et al report that TSI has not increased over the past 50+ years. However Pinker (2005) finds that from 1992-2001 TSI at the earths surface increased at a rate of 0.16W/m2/y. Are Pinkers findings relevant?
Prev 1787 1788 1789 1790 1791 1792 1793 1794 1795 1796 1797 1798 1799 1800 1801 1802 Next


