


 Arguments


Recent Comments
Prev 1912 1913 1914 1915 1916 1917 1918 1919 1920 1921 1922 1923 1924 1925 1926 1927 Next
Comments 95951 to 96000:
-
Same Ordinary Fool at 05:31 AM on 13 February 2011Monckton Myth #10: Warming in the Pipeline
#9 Marcus and #17 dana 1981..........There's a lesson here. I wasn't researching Monckton, I was just browsing through the blogrolls on several websites. "We are a service for journalists and the online climate community. Our team of researchers will provide a rapid response service for climate science stories. We go straight to peer-reviewed science and the relevant scientists to get their opinions. Right now we are in the early stages of developing the site." "We (at carbonbrief.org) are a project of the Energy Strategy Centre." "The Energy Strategy Center...is the communications unit at the European Climate Foundation." "(The) Energy Climate Foundation aims to provide climate and energy policies that greatly reduce Europe's greenhouse gas emissions, and help Europe play an even stronger international leadership role in mitigating climate change." And, there's a second lesson here. Some of what is said in Europe, stays in Europe...when just doing standard googling, stateside. -
johnd at 04:26 AM on 13 February 2011Guardian article: Australia's recent extreme weather isn't so extreme anymore
Daniel Bailey at 02:08 AM on 13 February, 2011, it often amuses me how the 30 year period is used by some to make a point about climate trends. A few years ago when Australia was in the midst of a drought, time and time again alarmists would trot out a graph showing the decline in rainfall over the preceding 30 years. As I argued back ad-infinitum, the beginning period, the mid 1970's, was likely the wettest period Australia wide since first settlement. I constantly had to point out that Australia in fact, was not getting drier, but instead getting wetter as indicated by comparing the second half of the 1900's to the first half, and that in turn to the entire 1800's. Now I expect the see the 30 year period being trotted out again, probably by the same people, to support arguments that Australia is now getting wetter given both the current conditions and the fact that 1982 was a bad drought year. :-( -
mozart at 04:15 AM on 13 February 2011Monckton Myth #10: Warming in the Pipeline
Oops...and "site" should read "cite". I'm humbled. -
johnd at 03:58 AM on 13 February 2011Guardian article: Australia's recent extreme weather isn't so extreme anymore
Ken Lambert at 23:36 PM on 12 February, 2011, I agree, one of the problems with climate analysis is the reliance on a relatively short data set, and a notion that it all can be analysed through a number of formulas or graphs. In Australia there exists a much larger "data base", that being the unofficial information that has been accumulated by both anecdotal evidence and personal records, especially in the agricultural sector. This information is relevant and should be accurate as it documents how the weather and climate manifested itself where it really matters, in the production of food. Historic crop production records are very good proxies that covers broad areas, but more importantly are indicators of whether we are capable of adjusting to any changes the climate has visited upon us now or in the past. With regards to the Brisbane floods, whilst there seems to be discussion about the effects of cyclones or otherwise, the bottom line is that it is the terrain that is the ultimate determining factor, and it is irrelevant whether the next flood will be cyclone induced or otherwise. Interestingly, the first "extreme" weather event apparently occurred when the first fleet arrived at Botany Bay. Whilst still on board the vessels, the arrivals were subjected to a week of 100 degree temperatures. -
johnd at 03:58 AM on 13 February 2011Guardian article: Australia's recent extreme weather isn't so extreme anymore
Albatross at 15:39 PM on 12 February, 2011, perhaps you need to go back and carefully read my post that you were replying to, in particular the second last paragraph, and you will see that my post was in fact a response to your comment "Yes, something very different is going on alright." As I indicated, I find it prudent when considering any such analysis that compares trends over specified time frames, especially very short time spans such as the one in question, to consider the prevailing conditions at both ends of the surveyed period, and if those conditions were in a state of oscillation, give careful consideration as to whether similar outcomes would be achieved by adjusting the survey period forward or back to a point where the oscillating conditions had changed. Rather than passing judgment on the paper itself, I instead indicated the state of the IPO and ENSO cycles at the relevant points, and that doing a due diligence rather than blindly accepting the results, you, or anyone, would be better able to evaluate the value of any conclusions reached. If you want to discuss aspects of the paper referred to by you then perhaps one of those aspects that I am giving some thought to is the use of percentiles in determining extreme events. In itself it would normally be acceptable, however in the case of precipitation, and specifically precipitation over Australia, as you may or may not be aware, there are large areas with minimal rainfalls as well as areas with tropical rainfalls, and as is well documented, whilst the higher rainfall areas are generally subject to a reasonably regular pattern, in the marginal areas rainfall is both sparse and irregular with long completely dry cycles. Whilst it is often made as a joke that there have been kids 10 years old that had never seen rain, it needs to be considered that it is based on fact. Getting back to precipitation percentiles, does identifying the extremes from large areas with say a historically irregular 5" rainfall with those from a regular 40" rainfall allow a valid analysis to be made regarding extreme events, and even it was acceptable for the purpose of the analysis, could any worthwhile conclusions be drawn as to what is actually occurring over such a large and diverse land mass? -
RickG at 03:53 AM on 13 February 2011There is no consensus
@281 Interesting! with that in mind, what is you opinion concerning the "petition project" signed by some 31,000 scientists stating, "there is no convincing scientific evidence that human release of carbon dioxide will, in the forseeable future, cause catastrophic heating of the Earth's atmosphere"? -
mozart at 03:51 AM on 13 February 2011Monckton Myth #10: Warming in the Pipeline
Apologies...."Maybe a 0.35% rise" should read "Maybe a 0.35 degree rise". An edit function would be helpful. -
mozart at 03:47 AM on 13 February 2011Monckton Myth #10: Warming in the Pipeline
Thanks dana I appreciate that answer, and it makes sense. But I guess the net of all of that is the 20th century relationship CO2 to temperature is somewhat weaker than a 23.7% rise in CO2 produces a 0.57 degree C rise. Maybe a 0.35% rise? Conversely it has to increase the CO2 response for the last 30 years. Muoncounter my only problem with the link you site is the solar response is in fact derived from an assumed CO2 response. Given that's the variable most in dispute....the reasoning seems a bit circular. "So now to calculate the change in temperature, we just need to know the climate sensitivity. Studies have given a possible range of values of 2 to 4.5°C warming for a doubling of CO2 (IPCC 2007), which corresponds to a range of 0.54 to 1.2°C/(W-m-2) for λ. We can then calculate the change in global temperature caused by the increase in TSI since 1900 using the formulas above."Moderator Response: Also use the Search field to find the Post "Climate time lag." -
dana1981 at 03:40 AM on 13 February 2011Monckton Myth #10: Warming in the Pipeline
SOF #8 - nice article, thanks. Good to see Monckton Myths mentioned there! Mozart - two things. 1) The solar radiative forcing over the past century has been about 10 times smaller than the CO2 radiative forcing. A smaller forcing means thermal inertia causes less of a lag. 2) Solar irradiance hasn't increased in over 60 years now. Even with a radiative forcing as large as CO2, most of the warming is realized within that timeframe. But with changes as small as the solar irradiance increase, most of the warming is realized within 5-10 years. -
SamPatt at 03:20 AM on 13 February 2011There is no consensus
The study mentioned in this article, Doran and Zimmerman 2009, is a very poor study. The survey questions asked are so crafted that nearly everyone, regardless of opinion on AGW, would answer yes. To prove it, Dr. Lindzen and Dr. Michaels both answered positively to the survey, even though they are routinely considered 'deniers'. Details are in this article: Study claiming ’97% of climate scientists agree’ is flawed -
Bob Lacatena at 02:14 AM on 13 February 2011Coral Reef Baselines
'Type'? Looks like a misteke to me.Moderator Response: [DB] Gud wun. -
Daniel Bailey at 02:08 AM on 13 February 2011Guardian article: Australia's recent extreme weather isn't so extreme anymore
KL @ 24 wants to have his cake and eat it too. The established length of time series for climate significance is typically 30 years or more. With a robust enough dataset, shorter periods may also be significant. Numerous times on various threads here at SkS he has proclaimed about the lack of oceanic warming since 2003, but never has that trend risen to the level of statistical significance. Now he would have us ignore the results of a dataset going back 100 years for...why, again? I would humbly suggest, Ken, that you refrain from characterizations of other people's comments as you have just done with that of Albatross (note the 2nd "s"). That tends to get you in trouble here, as you well know. The Yooper -
muoncounter at 02:00 AM on 13 February 2011Monckton Myth #10: Warming in the Pipeline
#15: "To simply ignore the effects of solar... " No one is ignoring the effects of solar (where did I hear that before?) See How we know the sun isn't or any of the threads that show all the forcings are used in warming calculations. "As always, a little reading and research shows that climate scientists aren't ignoring these obvious questions." -
mozart at 01:48 AM on 13 February 2011Monckton Myth #10: Warming in the Pipeline
I'm referring to the relationship between CO2 and temperature for the 20th century. The 0.57 degrees centigrade rise, is linked to a 23.7% rise in CO2. But the solar irradiation number in 2000 was higher than in 1900, which should account for some of the rise? So is the basic relationship weaker? To simply ignore the effects of solar, because it doesn't correlate well in the last 30 years seems unwise....particularly as it was solar irradiation fluctuations that took us in and out of the little Ice Ages. Let me pose the question in a different way. If a new Carbon level has a delayed response, do we believe a step to a new plateau level in solar irradiation is played out immediately, over ten years, over 50 years? -
JMurphy at 01:46 AM on 13 February 2011It hasn't warmed since 1998
protestant, you need to look at Monckton Myth #2: Temperature records, trends and El Nino to learn more about the different datasets and how global their coverage is. You also need to look at Are surface temperature records reliable?, before backing up your accusation of "unjustified interpolation". -
muoncounter at 01:35 AM on 13 February 2011Guardian article: Australia's recent extreme weather isn't so extreme anymore
#25: "the indigenous reports of flood high levels" Something suggests to me that if those indigenous reports were to the effect of "It never used to flood here," KL would be discounting them entirely. -
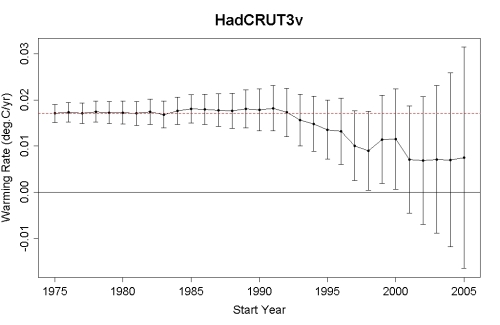
muoncounter at 01:27 AM on 13 February 2011Ten temperature records in a single graphic
#131: "look only at data for the past 15 years, there is no statistically significant trend ..." Ah, the fine art of the cherrypick. Something about the statement "When I look at data only for this statistically insignificant period, I find no statistical significance," should give you pause. See Global warming stopped in ... and any of several threads about statistical significance. And here's a most excellent graph by Tamino, which should change your outlook: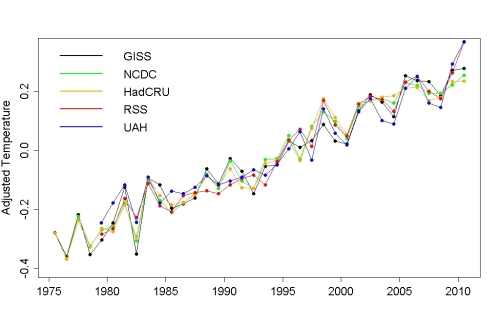 That's about 0.17 degrees C/decade.
-
adelady at 01:18 AM on 13 February 2011Guardian article: Australia's recent extreme weather isn't so extreme anymore
kl Did anyone check whether the indigenous reports of flood high levels were associated with cyclones? afaik, none of the highest water events recorded before 2011 occurred in the absence of a cyclone. -
Kevin C at 01:14 AM on 13 February 2011Climate Data for Citizen Scientists
How about adding predicted sunspot numbers for the next cycle? Data here: http://solarscience.msfc.nasa.gov/predict.shtml http://solarscience.msfc.nasa.gov/images/ssn_predict.txt Given that the next maximum is currently looking to be very weak indeed (ssn of 58 vs 118 in 2000) this is very relevent to climate over the next 5-10 years. -
muoncounter at 01:14 AM on 13 February 2011Monckton Myth #10: Warming in the Pipeline
#10: "Why has this rise in solar levels ... not played a part in the rise of temperatures over the last 200 years? " It did play a part. See It warmed before 1940 and Human fingerprint in the seasons, among other threads dealing with solar warming. As always, a little reading and research shows that climate scientists aren't ignoring these obvious questions. -
mozart at 00:34 AM on 13 February 2011Monckton Myth #10: Warming in the Pipeline
I'm simply referring to the total solar irradiation number, which is still well above 1900 levels. Because of the breakdown in correlation between this number and temperature in the second half of the century, "something else" had to be causing the warming. That something else is CO2, and the argument is made here that we have more to come from the existing CO2 increase. But in calculcating the base temperature increase for the 20th century,which creates the parameter for CO2 response, is it really reasonable to assume the solar effect is zero? Put another way, is it more likely that the solar effect is being amplified and/or supressed....or is it more likely changes in solar irradiation are simply irrelevant. -
Ken Lambert at 23:36 PM on 12 February 2011Guardian article: Australia's recent extreme weather isn't so extreme anymore
Johnd #16 and albatros#18 Good points Johnd. Albatros has gone right over the top in his piece at #18. I have read a fair bit of Karoly's stuff over the last 18 months and would put it in the 'advocacy science' part of the library catalogue. Back to 1911 is too short a period to establish any robust background noise level for climate variation, I would humbly suggest. -
Ken Lambert at 23:28 PM on 12 February 2011Guardian article: Australia's recent extreme weather isn't so extreme anymore
Bern #17 Brisbane 2011 surely was a major event - the question is whether it has happened before and with what frequency. I would have thought 100-200 years is too short a period to define the range of flood events - and if no-one is prepared to discount the report of John Oxley's 12m as unreliable Aboriginal folklore - then 12m in the last 200 years is the best estimate of the range of natural flood height in the Brisbane river. Wivenhoe and Somerset dams were not around in 1893 - so this remains the worst measured 'natural' flood height at about 8.2m - although the overall 1893 rainfall event might have been smaller than 2011. 1974 had different aspects - there being much higher creek flows in greater Brisbane itself, and less from upstream. The point remains that all these events are unique, chaotic and periodic manifestations of the climate system (particularly La Nina) and very difficult to prove are driven outside the range of natural variation by GW or AGW. -
rhjames at 23:24 PM on 12 February 2011Ten temperature records in a single graphic
Bibliovermis - to be fair, I must admit that when I check Hadcrut and RSS, and look only at data for the past 15 years, there is no statistically significant trend up or down that I can find. That's not to say that global warming has stopped - we need another 15 years of no trend before such a claim could be made. However, we can't just draw a straight line through curved data, in the hope that extrapolation will follow that line. Basically, we really don't know what it's doing - the hottest year based on most data sets was 1998, and there's the chance that it may have peaked - only time will tell. 2011 is certainly off to a colder start. -
John Bruno at 23:13 PM on 12 February 2011Coral Reef Baselines
Thanks MattJ and isn't it Rob! Kind of like looking for warming by starting in 1998. -
Bibliovermis at 22:51 PM on 12 February 2011Ten temperature records in a single graphic
"It's cooling" is currently the #4 argument because enough self-proclaimed skeptic are still asserting that the warming stopped at some point; e.g. 1998. -
protestant at 22:51 PM on 12 February 2011It hasn't warmed since 1998
"2005 was the hottest year globally, and 2009 the second hottest." According to majority 1998 was warmest on record (Hadley, RSS, UAH) and 2005 not even close. 2010 was the second warmest and tied only in UAH. GISS record years are just artifacts due to homogenization and unjustified interpolation. Again, "Skeptical" Science does cherry picking and pickes the only dataset which shows any warming on this ENSO-neutral interval which is 1998-2010.Moderator Response: [DB] Incorrect. According to the WMO, which uses data from NASA,NOAA/NCDC and MET/UEA, the year 2010 was jointly ranked with 2005 and 1998 as the warmest year on record. Hansen 2011 indicate we have reached the levels of the Holocene Maximum/Altithermal. Removing ENSO and other exogenous factors from the records yields (using monthly averages) this, from Tamino: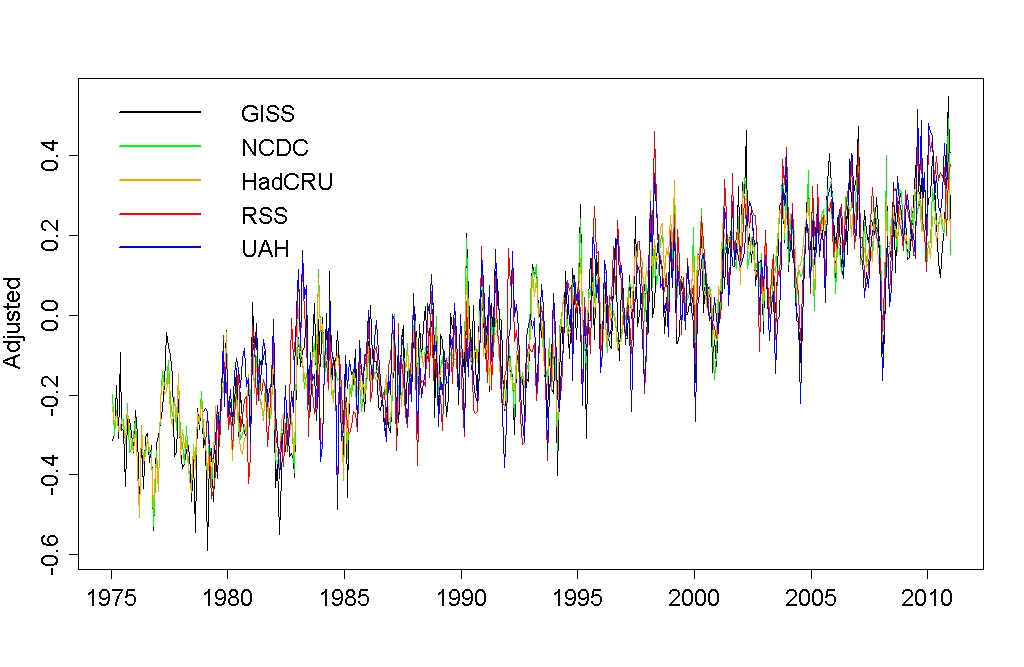 And now this, using annual averages:

-
Bibliovermis at 22:39 PM on 12 February 2011A Case Study of a Climate Scientist Skeptic
Are you claiming that what we cannot observe trumps what we can observe? -
Ken Lambert at 22:28 PM on 12 February 2011A Case Study of a Climate Scientist Skeptic
Gentlemen The essential point to this discussion is whether or not there is energy added to the whole Earth system (oceans, atmosphere, land, ice melt, evaporation). This is then an 'external' energy imbalance. Exchanges between oceans and atmosphere etc within the system are 'internal'. Thermal inertia is only relevant to the Temperatures showing in various parts of the system. The overal energy added or subtracted from the system is the time integral of the forcing imbalance 'prior' to the point in time we are considering - which in this discussion is NOW. There might be temperature rise in some part of the system from heat energy already absorbed there or transported there by circulations from elsewhere. However future rise in temperature of the whole system can only come from future energy gain from a forcing imbalance. The heat energy 'in the pipeline' is in fact in the 'time tunnel' looking forward, assuming there is an ongoing imbalance (currently claimed as about +0.9W/sq.m). But if this heat keeps eluding researchers in the measurement of ocean heat content for too much longer, we might conclude that the imbalance is small or non-existent. -
MattJ at 21:26 PM on 12 February 2011Guardian article: Australia's recent extreme weather isn't so extreme anymore
The failure to deal with climate change is THE massive failure of democracy. Why? Because though China is denying it too, it is the 'democratic' nations of the world, the US, UK and others, who are leading the charge into denialism, and giving free reign to denialists under the -cover- of "freedom of speech" and "freedom of commerce" -- even though this is destroying those freedoms along with more basic freedoms for all those who have to grow up in that ruined world full of war, famine and pestilence. -
RSVP at 20:16 PM on 12 February 2011Crichton's 'Aliens Cause Global Warming'
Marcus #40 "That's not word-play or contradiction-that's scientific FACT." I find it very unfair to qualify a spirit of open mindedness as word play, especially only as applied to ideas that might appear contrary to the status quo, or using the more popular, "peer consensus". And there may actually be some level of "greenhouse" warming associated with elevated CO2 levels, in other words, this may also be having some effect. What I find going on here, as also seemed to bother Crichton, an attempt to establish scientism as opposed to science. Wordsmithing is not word play. Words are the means to convey ideas, and sometimes it is necessary to invent new words to better understand what is going on. It might be very true that CO2 is affecting climate to some degree, but to stop short there, entrenched in only one idea seems very limiting indeed, especially in times as complex and dynamic as the one we are living in. -
Marcus at 19:18 PM on 12 February 2011Monckton Myth #10: Warming in the Pipeline
Also, Mozart, sunspot data shows that the highest average sunspot numbers were actually around the 1930's to 1950's. Every decade since has seen lower average sunspots than at this earlier time. -
Marcus at 19:15 PM on 12 February 2011Monckton Myth #10: Warming in the Pipeline
@ Mozart-all I can suggest is that you look at a comparison of 20th century sunspot numbers vs 20th century temperatures. You'll see that sunspots & temperatures match extremely closely for at least the 1st half of the century, then get increasingly separate as you proceed into the 2nd half of the century. Fact is, if we were going to see any thermal inertia from the sun, we would have seen it around the 1950's & 1960's-after sunspots peaked-yet warming during this period was relatively slow. The rate only picked up *after* the period where we'd expect that thermal inertia to no longer be in effect (about 10 years). If I've got this wrong, then I hope someone will correct me. -
Rob Painting at 19:06 PM on 12 February 2011Coral Reef Baselines
Fancy that, GBR coral cover was in it's pristine state when the AIMS survey began. What a lucky coincidence!. -
Marcus at 18:58 PM on 12 February 2011Guardian article: Australia's recent extreme weather isn't so extreme anymore
@ farrowed. Wow, that's *really* scary. Given WA has also seen a significant drop in their aquifers as well, it makes you wonder how much longer WA will be able to sustain its current population-let alone expand. South Australia is eventually going to run into problems too-though maybe later than Western Australia. Though we definitely got some excellent rain in late 2010, it doesn't really compensate for the more than 30% decline in Autumn rainfall that we've seen since the 1970's. -
MattJ at 18:39 PM on 12 February 2011Coral Reef Baselines
'Palontological'? Looks like a type to me. -
farrowed at 18:36 PM on 12 February 2011Guardian article: Australia's recent extreme weather isn't so extreme anymore
In addition to the extreme weather on the Eastern seaboard, this graph of stream flows in the west is worth a look. -
rhjames at 17:23 PM on 12 February 2011Ten temperature records in a single graphic
I agree - more data showing much the same thing (though GISS is a bit out from the others) is better, rather than trying to average it all. But, as I said, warming isn't really in question anyway - it's the cause of the warming. -
nigelj at 17:13 PM on 12 February 2011Guardian article: Australia's recent extreme weather isn't so extreme anymore
It certainly is a remarkable year or so in Australia and globally, I tend to think too many events to dismiss as purely natural variability. Scientific scepticism in every area of science seems to go thru several phases: Robust and often compelling. Necessarry but difficult to quite maintain Missleading, tedious, whining, and desperate Stupid and despicable. What stage are we at with cimate change I wonder? -
mozart at 16:49 PM on 12 February 2011Monckton Myth #10: Warming in the Pipeline
Could one not make the same delayed response argument for solar activity that still remains above the levels seen at any time in the first 50 years of the 20th century. Why has this rise in solar levels ( even though they are lower now than they were 20 years ago) not played a part in the rise of temperatures over the last 200 years? -
Albatross at 15:39 PM on 12 February 2011Guardian article: Australia's recent extreme weather isn't so extreme anymore
JohnD @16, So you are suggesting that they are cherry picking? Do you realise that means that you are essentially accusing them of scientific misconduct? I though the house rules did not permit that. I understand the findings are inconvenient and troublesome for you, but you trying to hand wave away a paper published in a leading climate journal is pretty ridiculous. Do your own analysis, and demonstrate that shifting the start date renders the trends statistically insignificant. You would also have to argue why you selected your particular start date. you can conclude nothing, because all you have done here is present some musings, some hypotheticals, no data analysis. Had you made the effort to read the paper, you would have found the reasons for them selecting the 1911 and 1957 start dates. Why am I do all the work, you are the one making accusations of nefarious goings...read their sections 3 and 4 which describe the data and methods they used, respectively. In fact, please read the entire paper. Also note that this paper does not stand on its own, it forms part of a coherent and much larger body of evidence. From their introduction: "Changes in the frequency and severity of some extreme events during the twentieth and early twenty-first cen- tury have been recorded globally (Frich et al. 2002; Alexander et al. 2006) and throughout Europe (Klein Tank and Ko ̈ nnen 2003), North America (Karl et al. 1996; Vincent and Mekis 2006), South America (Vincent et al. 2005; Haylock et al. 2006), Asia (Manton et al. 2001; Zhai et al. 2005; You et al. 2008), and Oceania (Plummer et al. 1999; Alexander et al. 2007). These changes have in- cluded increases in the occurrence of hot extremes and decreases in the occurrence of cold extremes of mini- mum and maximum temperature during the second-half of the twentieth century for the majority of global land area (Frich et al. 2002; Alexander et al. 2006). Reported changes in extreme precipitation are regionally depen- dent. However, there has been a global trend toward increases in extreme daily precipitation during the second-half of the twentieth century and into the twenty- first century (Alexander et al. 2006)." Yes, La Nina's are typically associated with heavier rainfall events over Queensland and NSW, nothing new there. ENSO is, as the name suggests, an oscillation-- it cannot cause a trend unless there is a systematic increase in the intensity and/or frequency. Also, the BOM has also said that the record high ssts around Australia probably played a role. and Trenberth (and others) has shown that the precipitable water vapour content has risen by about 5% since the 70s over the global oceans-- providing more latent energy for storms (and which will also incidentally increase the liquid water content of the convective clouds). there are several papers on that which I can refer you to if you like. You are entitled to your own opinions johnd, but not your own facts. Feel free to deceive yourself, but ignoring the huge and overwhelming body of evidence won't make the reality go away. -
Bern at 15:37 PM on 12 February 2011Guardian article: Australia's recent extreme weather isn't so extreme anymore
Ken Lambert - there may have been 12m floods in the city reach way back when. But don't underestimate the mitigation effect that Somerset & Wivenhoe dams had. Peak flow was estimated at a bit over 7,000 m3/s past the city gauge. There were reports that inflows to Wivenhoe alone topped 1 million megalitres per day, or close to 12,000 m3/s. And that was at the same time that Somerset was rapidly filling as well, in addition to the floods coming down the Lockyer & Bremer catchments. If all that had come down the river at the same time, then a peak around 6 or 7 metres (i.e. 1.5-2.5 metres higher than we got) would have been out of the question. And while, yes, there has been additional development over recent decades, that's not where the water was coming from - the land where the rain fell is largely agricultural or, indeed, native forest. So I regard this as a fairly extreme rainfall event. Sure, it may not be the most extreme Brisbane has ever had, but it wasn't associated with a cyclone or tropical low, which *does* make it somewhat extraordinary. @Agnostic: IMHO, the one step that will *really* make a difference to Australia's emissions is to announce that no more coal-fired power stations will be permitted to be built. That will get the power companies thinking seriously about alternatives to replace the plants that are approaching retirement. Maybe just start with a ban on brown-coal, with a phase-out of black coal power. Now, its possible that the only practical option to replace that much generation in the next 10-20 years is nuclear, but with enough incentive, I'm sure we'd see enormous effort put into developing alternatives (like solar thermal or geothermal). -
Marcus at 13:20 PM on 12 February 2011Monckton Myth #10: Warming in the Pipeline
@ #8-that was a very interesting article. It seems that the Denialist Cult's "Broad Church" approach to membership is beginning to come back & haunt them. After all, how else can we explain Monckton being attacked-by his own camp-for going "too far" & simultaneously "not going far enough". Oh, the Schaudenfraude of this moment is too great to pass up :)! -
Marcus at 13:05 PM on 12 February 2011Crichton's 'Aliens Cause Global Warming'
RSVP, I do apologize for the error in my post, but it should have been obvious-even to you-that as the stratosphere is the UPPER atmosphere, & that it is cooling, that the warming I previously mentioned must have referred to the troposphere & near-surface layers. The fact that the troposphere is WARMING, whilst the Stratosphere is COOLING is one of the clearest indicators that heat is increasingly being trapped in the lower atmosphere. That's not word-play or contradiction-that's scientific FACT. Now, unless you & your fellow denialists can come up with a SOLID explanation of some natural phenomenon that can simultaneously warm the troposphere whilst cooling the stratosphere, I'd be *really* interested in hearing it. Instead, I'm sure we'll just hear the usual pseudo-scientific bunkum coupled with the old "grand scientific conspiracy" delusion that you usually provide. -
StElias at 12:26 PM on 12 February 2011Articgate: perpetuating the myth that Arctic sea ice has recovered
I’m new here, I do appreciate this S.S. site and the climate discussion. Does wonders for my blood pressure, nice to read and listen to folk with brains, for a change. I’m not a scientist, lifelong Alaskan though, 71 years. We travel lots. Last February we were in Antarctica. Sent this note home when there: “Three biologists (naturalists) on board, all Brits. one guy spent most of his life here, since shortly after War ll. They’re really concerned over lack of sea ice impact on marine life. We have an "Ice Captain" on board too. He is retired US Coast Guard and had captained our nation’s largest ice breaker, the Polar Star, on scientific expeditions in the Antarctic for years. He spoke to us a couple of times. Right after we left and headed into Drake's Passage he said something interesting "I don't get into these "Global Warming" arguments because I am not a scientist. However, I will tell you this, my first summer here was in 1984, no way we could have taken a ship this size, back then, into the areas where we have just been. There was so much ice then that even a consideration of doing so would have been ridiculous." -
scaddenp at 12:24 PM on 12 February 2011We're heading into an ice age
stephenwv - a couple of other points for you to ponder when you compare what is going on now, to what happened in ice ages. Rate of temperature change is around 10 degrees in 20,000 years or 0.05C/century. Rate of warming now is around 0.8C/century (more than 10 times faster). And from an earlier post. "The milankovitch forcing that drives ice age is due to change in forcing that is about 0.25W/m2 per hundred years at 65N. Globally, its maybe a tenth of that. By comparison, anthropogenic GHG is about 2.5-3W/m2 over last 100 years globally, not just at 65N." Do you think natural factors are going to trump that? -
MattJ at 12:22 PM on 12 February 2011The Scientific Guide to Global Warming Skepticism
BTW: every time I see the statement, true though it is, that "Scientific skepticism is healthy", I want to follow it immediately with "unscientific skepticism is unhealthy, even poisonous." That way, the point of your first paragraph could almost fit on a Prius bumper sticker;) -
muoncounter at 12:19 PM on 12 February 2011Newcomers, Start Here
Here's a reference that shows meltwater from ice takes up atmospheric CO2 -- and that an ice-free Arctic will lose that ability, making things even worse. Talk about feedbacks! “The total loss of summer sea ice from the Arctic, predicted to occur within the next few decades, may have dramatic effects on the ability of the Arctic Ocean to sequester CO2 from the atmosphere. “We could see further increases in CO2 accumulation in the atmosphere, if reductions in this “the sea-ice pump” are not compensated for elsewhere.” -
johnd at 12:17 PM on 12 February 2011Guardian article: Australia's recent extreme weather isn't so extreme anymore
Albatross at 04:02 AM on 12 February, 2011, regarding the Gallant and Karoly paper you recommended, whenever I see such analysis I always consider how or why the beginning and ending points have been selected as often it becomes apparent that such points often sets a stage that puts a bias on the outcome, especially when considering trends. The year 1911 was at the end of 3 consecutive La-Nina years with the IPO (Inter-decadal Pacific Oscillation) in the midst of a relative short negative (wetter) phase, with SOI reaching a value of 16. Three longer phases of the IPO subsequently occurred during the 20th century, a positive (dryer) phase (1922-1944), a negative (wetter) phase (1946-1977) and another positive (dryer) phase (1978-1998) with another change of phase in the process of forming since then. The year 1957 in the midst of long negative (wetter) phase happened to be an El-Nino year preceded by again 2 consecutive La Nina years during which the SOI value again peaked at about 16. Therefore before one can conclude that something very different is going on, other than some short term aberrations, one needs to consider if the beginning and ending points of the study were firstly moved back, say a nominal one decade, and then secondly moved forward one decade, would the same conclusions be reached. A matter of further interest regarding the recent floods is that PROFESSOR Stewart Franks, a hydrologist at NSW's University of Newcastle, warned in a peer-reviewed scientific article published in 2006 that the risk of serious flooding in southern Queensland and NSW increases significantly when a negative phase of the Interdecadal Pacific Oscillation corresponds with a La Nina event. -
MattJ at 12:14 PM on 12 February 2011Portuguese translation of The Scientific Guide to Global Warming Skepticism
The article says in its title, that it has already been translated, but the penultimate paragraph says Portuguese is "currently in the works".Response: Oops, thanks. German version coming very soon too...
Prev 1912 1913 1914 1915 1916 1917 1918 1919 1920 1921 1922 1923 1924 1925 1926 1927 Next


