


 Arguments


Recent Comments
Prev 1967 1968 1969 1970 1971 1972 1973 1974 1975 1976 1977 1978 1979 1980 1981 1982 Next
Comments 98701 to 98750:
-
Miriam O'Brien (Sou) at 17:46 PM on 12 January 2011The Queensland floods
As a further addendum, much (most) of Victoria in south eastern Australia has suffered drought for the last decade or more. It is expected to continue to get warmer and drier in Victoria as global warming progresses. A desalination plant is under construction to provide Melbourne with improved water security. Melbourne water storage is currently at 53.7% capacity gaining about 300 gigalitres since June 2010 (about twice the water of 2009 but only a bit more than half the amount of water held in storage in 1997). Yet across the state and in Melbourne this summer we've had a lot of rain, record precipitation events and major floods with this season's La Nina. http://www.melbournewater.com.au/content/water_storages/water_report/zoom_graph.asp A lot of people are commenting on the 'cool' summer. But it only feels cool by comparison with the record heat of recent years. In actual fact, the mean monthly maxima and minima for Melbourne this summer are still above 30 year averages (including the 1981 to 2010 average). Compare recent months in Melbourne here (scroll down for links to recent months): http://www.bom.gov.au/climate/dwo/IDCJDW3050.latest.shtml With monthly averages here (you can select the period): http://www.bom.gov.au/climate/averages/tables/cw_086071.shtml Melbourne and Victoria are not the world and therefore that data on its own does not allow inferences to be drawn about what is happening at a global level. Nevertheless what's happening here in Victoria does illustrate the local climate change that is already occurring, in line with what Australian scientists have been telling us will happen with global warming. -
Tom Curtis at 17:00 PM on 12 January 2011The Queensland floods
As an addendum, the drought is still continuing in the South West of West Australia (around its capital) with dams at 30% of capacity, and 15 - 20% of Perth's water coming from desalination. -
Tom Curtis at 16:54 PM on 12 January 2011The Queensland floods
sout @4, I believe it was November of 2009 that the drought broke in Brisbane with rains that restored Wivenhoe to capacity within a week or so. For comparison, in just 24 hours yesterday Wivenhoes stored water increases by 40% of rated storage capacity whilst letting enough water through its floodgates to cause lead to the expected '74 plus level floods in Brisbane tomorrow. Its maximum capacity is 220% of its normal storage capacity to allow for flood mitigation. Last I heard, it was at 175% of normal storage capacity, or one more days rain had it not (very thankfully) relented. -
Tom Curtis at 16:48 PM on 12 January 2011The Queensland floods
Hi John, I did not know that you were a fellow Brisburnian. I'm glad to here that you are safe. garythompson @2, the CSIRO has been predicting since at least 2003 that the main effect of global warming on subtropical Queensland and NSW would be longer, hotter, and drier droughts, BUT that when rains came it would be more likely to flood, and to flood more severely (check my blog for links). The reason that global warming will increase the duration of droughts is because it makes it more likely that any given year will be an El Nino year, and El Nino years bring droughts to Australia. It will be drier because it is hotter, which results in more evaporation of moisture stored in the soil. Of course, though it is more likely that any given year will be an El Nino year, La Nina's can still occur, and strong La Nina's bring floods. Hence the current flood. The reason global warming results in more rain when it floods is because warmer Sea Surface Temperatures (currently at a record level in Australian Waters). Warmer sea surfaces means more evaporation, which in turn means more rainfall. Knowing this, it was no surprise to me that the ten year drought we have recently been through was broken by record breaking floods in Queensland in March, with that record now in turn shattered. Brisbane's highest levels of flooding all occured in the 19th century, with river peaks up to 4 meters above what is currently expected. What has changed since the 19th century was the construction of the Summerset Dam which provided for a large measure of flood mitigation. That couldn't prevent '74, so they built the Wivenhoe Dam with an even greater capacity for flood mitigation, and greatly enhanced Brisbane's drainage system. These have greatly helped us, for without them floods in Brisbane would have hit '74 levels last week, well before Toowoomba's "instant inland tsunami". It has still not been enough. What nobody is yet commenting about is that Brisbane's previous episodes of mass flooding have been the result of cyclone remnants hitting Brisbane after a preceding season of massive rainfall. This time we have had the preceding season of rainfall, but no cyclone remnant. Absent global warming, Brisbane would probably only be experiencing minor flooding now, but global warming has been a game changer in the amount of rainfall we can expect from a normal rain depression. http://bybrisbanewaters.blogspot.com/2011/01/under-brisbane-waters.html -
Chris G at 16:45 PM on 12 January 2011Could global warming be caused by natural cycles?
BKSea, I don't know of any researcher willing to go out on that limb. But, I don't know all. It's a pretty thin branch no matter which side you believe. However, the same question has come to my mind more than once. Looking at ice core data, there appear to be upper and lower limits to "natural" perturbations. At times, there appear to be plateaus of relative stability at the top and bottom of these limits, with rapid changes between them. However, there is also a PETM event which is outside of these limits, as well as broad expanses of geologic time where the temperature has been outside of the recent glacial band. My two cents: We are off the map. There has never been a time like the one we are in the process of creating in terms of layout of the continents, amount of C sequestered in clathrates and permafrost, rate of climate forcing introduced, etc. We can't just can't tell whether the change will be smooth or abrupt. Looking at the forces and feedbacks involved, there's nothing that acts linearly; so, my out-on-a-limb guess is that there will be an abrupt tipping point. Heck, from a geologic time-scale perspective, the recent change in progress would look like some abrupt discontinuity on the graph. Actually, I think the number would be a) too big to be meaningful, and b) depend a lot on how deep you wanted to go in the ocean and land; atmosphere, not so much. I once did a back-of-the-napkin estimate of just the latent heat difference in the loss of Arctic ice. It was huge, and that is just a fraction of the change in heat content of oceans. -
Miriam O'Brien (Sou) at 16:34 PM on 12 January 2011The Queensland floods
@ garythompson #2 - flood and drought are not mutually exclusive. You are correct regarding drought predictions for Australia but you might have missed the predictions of record rain events as the higher levels of water in the atmosphere fall as rain. What you may not know is that Australia has suffered extensive drought of extremely long duration and record high temperatures over the past decade. Only a couple of years ago (or less?) the Brisbane water supplies were as low as 16%. Now they are at almost 200% stated capacity, even though the flood mitigation section of the Wivenhoe Dam was emptied in preparation for the current wet season. When it rains it rains more intensely. Many parts of Australia have had unprecedented rain intensity with this summer's La Nina, causing major flooding in Victoria, New South Wales, north west Western Australia and Queensland. This intense rain follows years of drought. -
Miriam O'Brien (Sou) at 16:12 PM on 12 January 2011The Queensland floods
John, it's good to hear you and your family are safe on higher ground. I hope things are not too difficult for you. I know there are power outages, phone outages, disruptions to transport and grocery shops sold out or closed from flooding. Today climate specialist Professor David Karoly, on ABC News 24 television, said quite clearly that because the oceans are progressively warming as a consequence of human induced global warming, the strong La Nina is stronger than it would otherwise be. From what I can research looking at flood history of Queensland, larger flood events are occurring more often as is the intensity of precipitation wherever it occurs in Australia (down in the south eastern Australia as well as further north). BTW I hope this does not conflict with comments policy, but anyone who wants to help could donate here: http://www.qld.gov.au/floods/donate.htmlResponse: Thanks for the reminder re the donation link - will add it to the main article. -
garythompson at 16:10 PM on 12 January 2011The Queensland floods
i'm glad you are ok John and i thought about you when i saw this on the news (you being the only "bloke" i know in that country). stay safe. it seems that climate scientists are suffering in the media from conflicting messages and predictions. every weather event from floods to blizzards are being blamed on global warming. a few years ago the news i heard was the global warming would cause drought, not massive rains.Response: Global warming leads to an intensification of the water cycle. Drought severity is increasing in some regions and extreme precipitation is increasing in other regions. These are not merely predictions - an increase in drought severity and extreme precipitation have both been observed. -
villabolo at 16:01 PM on 12 January 2011The Queensland floods
Glad to hear you and your family are ok John. -
actually thoughtful at 15:54 PM on 12 January 2011Could global warming be caused by natural cycles?
Muoncounters (graph #28 as things are now counted) shows roughly .8C of warming since the zero mark (whatever that is for that graph). It just raised the question in my mind - how many BTUs does it take to raise the temperature of Earth by .1C? This number might be a fun one to help people grasp the magnitude of such a tiny change. Every rock, every house, every leaf, every river, etc. .1C hotter than it was - all at once. -
Trueofvoice at 14:12 PM on 12 January 2011Understanding the CO2 lag in past climate change
Pirate, Clark is completely wrong in his assertion of atmospheric gas concentrations being "set", and his timeline is off as well. I'm not going to say more here because I'm already dragging the thread off topic.Moderator Response: Yes, that is off topic for this thread. -
RW1 at 13:51 PM on 12 January 2011The Physical Chemistry of Carbon Dioxide Absorption
KR, "As has been said here, repeatedly, the 3.7 TOA number means that ~7.4 W/m^2 is being absorbed and radiated isotropically from CO2." Wonderful. Point me to source and/or documentation that says the total absorbed power is 7.4 W/m^2 and that only 3.7 W/m^2 affects the surface because only half of the 7.4 W/m^2 absorbed is re-radiated downward. -
The Physical Chemistry of Carbon Dioxide Absorption
RW1 - As has been said here, repeatedly, the 3.7 TOA number means that ~7.4 W/m^2 is being absorbed and radiated isotropically from CO2. I know this - because I'm one of the people who has told you this more than once. Halving that number again is completely incorrect. Until you recognize that you will be starting from some very inaccurate premises. The additional energy not radiated to space from the Earth / atmosphere from a doubling of CO2 is therefore 3.7 W/m^2. That number comes from detailed, line-by-line calculations of IR emission across the full spectrum and through the entire atmosphere. hfranzen has done an excellent job of presenting the basic ideas. -
Daniel Bailey at 12:23 PM on 12 January 2011The science isn't settled
Re: apiratelooksat50 (35) Hmm, good question (no one's ever asked me that). I try to keep up on the literature itself as it comes out while reading older stuff I missed earlier as I find the time. That means reading a lot of stuff from NATURE, AGU, PNAS, GRL, AMS (I'm sure I'm forgetting some of the biggies; that's what links are for). Full studies I have access to or can find a free PDF of somewhere (Google Scholar is your friend in this regard). Abstracts and review articles also. Science sites. As for blogs, I pretty much limit myself to the science-based ones that have proven themselves over time (RC, Open Mind, Skeptical Science, Science of Doom, Chris Colosse's place, Neven's Sea Ice blog, etc). I frequent ScienceDaily and ReportingClimateScience for hints to advance notice of breaking papers. To boil that down: Peer-reviewed articles are the core. Augmented by commentaries in both scientific venues and scientific sites & blogs proven trustworthy. And then distill it down to this: Is it credible? Does it agree with what we have established as foundational? Why or why not? If not, what significance does that have (if any)? If it seeks to overturn established tenets, then exceptional claims require an even greater level of exceptional evidence. Etc. We were all given a mind. Some choose to use it for thinking. Some let others do the thinking for them. Our choice. (Apologies to any here whose site I didn't specifically name; I blame senescence) Oh, I listen to Buffett (and pretty much everything from 1960-2000 or so). And I'm pretty conservative. The Yooper -
Bob Lacatena at 11:47 AM on 12 January 2011Could global warming be caused by natural cycles?
39, BKsea, Off the top of my head, from what I observe and understand, the answer is "both." That is, the ocean is a vast heat/CO2 sink, so it is damping both the warming and the growth of CO2 in the atmosphere. On the other hand, from what we've seen of past events, such as the termination of interglacial periods and other events, there can be spikes when certain tipping points are reached. These don't need to be the same "tipping points" people think of in relation to runaway warming... just points where "slow-and-steady" abruptly transitions to "oh-shi*". But right now I'd say "more slowly and monotonically drifts" is the better description, with the understanding that that same damping will apply to trying to slow things down now that they've started. That is, even if we stopped all CO2 emissions right now, that "slowly and monotonically drifts" would continue for a very, very long while. -
Chemware at 11:40 AM on 12 January 2011Could global warming be caused by natural cycles?
#18, h pierce Sorry, you are wrong about rubber. It does degrade, though it does take a while. Sunlight is pretty vicious to rubber and plastic, and rubber eventually degrades because of the initiators used in its synthesis. -
BKsea at 10:58 AM on 12 January 2011Could global warming be caused by natural cycles?
From a basic systems perspective, a system's response to a perturbation can either be underdamped, in which case the system rapidly changes, overshoots and oscillates to a new equillibrium. Or, it can be overdamped, in which case it more slowly and monotonically drifts to a new equillibrium. Is there any evidence whether climate response to CO2 behaves in either of these fashions? -
Eric (skeptic) at 10:55 AM on 12 January 2011Could global warming be caused by natural cycles?
#18 keithpickering and #21 Sphaerica, I never figured trend was relevant in those variables (AO, etc). The relationship of those to global average temperature is not linear, and the variables themselves are somewhat cyclical (not linear). However, the AO to amplification link that I talked about doesn't seem to be evident. AMO being oceanic rather than atmospheric looks a little more promising. I am only trying to explain fluctuations in the rate of global temperature increase to help determine the factors that control amplification of warming from CO2 or ocean storage of CO2 warming, both of which fluctuate. -
keithpickering at 10:46 AM on 12 January 2011Could global warming be caused by natural cycles?
#20 Robert Way: I quite agree, and I'm in the process of redoing all these graphs with explicit y-scales. See my post from a few days ago, "Graphs from the Zombie Wars" for an example. #28 Rob Honeycutt Please use these any way they might be useful -- if you can get that right-click thing working. #29 H Pierce Yes indeed. One needs to remember that AMO and PDO are temperature indices, i.e., they are detrended subsets of the global temperature dataset. Therefore one expects to see short-term correlations. It's the long-term trend that's the issue. -
climatesight at 10:29 AM on 12 January 2011Could global warming be caused by natural cycles?
Thanks for the suggestions re: images - I am on the lookout for something to visually break up the page and enhance understanding. -
Chris G at 10:15 AM on 12 January 2011Seawater Equilibria
Sphaerica, Yeah, was afraid I was explaining a point already well understood. Mice work as well; the same principles apply, but I like the net as an analogy for a boundary layer. In any event, I think you have hit on the problem being related to timescales. Organic matter decays a lot faster than permanent snow cover advances; I would think. I suspect the Nat. Geoscience article linked by D Bailey was the primary source for the Science Daily article linked earlier. I'd also like to add some more complexity to the model by observing that there is an overturning of benthic ocean with the surface layers. I'm not sure what the rate of that is compared to the rate at which the surface layers find equilibrium with the atmosphere in terms of CO2. But in any event, I'm thinking that the upwelling water went down in a lower CO2 world; so, it might have a higher capacity to absorb CO2 than the water going down now will have when it returns. So, I'm forming a hypothesis that there will be echoes of past CO2 levels as the oceans overturn. Can't claim to sufficient knowledge to know if this hypothesis has any merit. My guess is that any echoes that do exist would be pretty blurry, considering there will be other factors at work and the rates of overturn for the worlds oceans are highly unlikely to be the same. It could also be that it stays down long enough that it is buffered back to a consistent level by chemistry that takes place with the rock and falling organic matter down there. I'll risk exposing a potentially foolish thought. -
GCNP58 at 10:10 AM on 12 January 2011Seawater Equilibria
@#34: Just to be clear, I do not think the rise in atmospheric CO2 since the industrial revolution is due to the ocean outgassing. However, the well-seasoned skeptic will point out that all of the ocean deepwater has very high DIC concentration. Therefore, the observed meridional CO2 distribution with higher concentrations in the N. Hemisphere could be due to upwelling deepwater in the N. Pacific (for example). I doubt that time-dependent CO2 concentration measurements would show the rise in CO2 at Mauna Loa precedes the rise at Cape Gearheart by a few days (or whatever the mean transit time of tropospheric air masses across the Pacific), but that doesn't mean a skeptic wouldn't try to make the case. And it would be a bitch to beat down, in my opinion, because they would provide all sorts of wacked-out measurements showing you needed to bring a relatively small amount of deepwater to the surface and that area could easily be missing by the relatively coarse measurements over that huge area. No doubt this argument from the skeptic would contain several delusional assumptions, and violate some principles of ocean physics, but sorting out all the misconceptions would take days. Furthermore, at each turn the skeptic would layer on another level of scientific weirdness so you would be nearly literally tied in knots sorting out what was factual and what was fantasy. In order to avoid that waste of time (and this whole website is designed so that people will waste less time debating known science with skeptics), it is a good idea to nip it in the bud and understand the isotope argument *before* the whole upwelling line of attack gets started. I say this mainly because whatever you can do to create a latitudinal distribution of atmospheric CO2 from continental sources can also be done with some creative ocean physics and upwelling. -
apiratelooksat50 at 10:04 AM on 12 January 2011The science isn't settled
KR, Thanks for the links. It will take me a while to check them out. Just being curious and not accusatory, do you and/or the other posters here look at other sites that are not pro-AGW? Pirate -
scaddenp at 09:56 AM on 12 January 2011Seawater Equilibria
"Adds a bit of credence to the clathrate-gun hypothesis". I've discussed this a no. of times with our researchers in this area and while clathrates might be important for PETM, what evidence we have is negative for much influence on glacial cycle. If there was a significant contribution from clathrates to atmosphere, then surely you expect a fossil signature in ice core methane? What measurements I am aware of (sorry dont have reference as away from office) show CH4 is swamp origin. -
RW1 at 09:54 AM on 12 January 2011The Physical Chemistry of Carbon Dioxide Absorption
hfranzen "Clarification: The absorption is a process in which carbon dioxide is excited from some rotational level in the ground vibrational state to some rotational level in the first excited vibrational state. The short explanation of the fact that half is returmed to the earth is: absorbed radiation is then reemitted through any of a number of processes and this emission is in all directions, i.e. half up and half down. Thus half the reemitted absorbed radiation returns to the earth as GHG flux. A slightly longer explanation of the reemission follows. Once this excitation has occurred the molecule either relaxes to the ground state or, more frequently, gives up the energy to the translational motion of another molecule (e.g. nitrogen) through collision. In the more probable collisional dectivation case this energy then becomes part of the thermal bath in which the molcules reside, in other words the atmosphere is locally heated above its steady state temperature. This excess bath energy is then lost through any of a myriad of collisional processes, say with the ubiquitous water molecules. This excitation is then lost through emission. In either case - direct emission or collisional deactivation follwed by remission from some other infrared active molecule the remmission is isottropic, i.e. nondirectional, and thus occurs with equal probability up or down." Thanks for the detailed reply, but I was looking for an actual number. The IPCC says a doubling of CO2 results in an intrinsic increase in surface power of 3.7 W/m^2. I've said before on here that if only half of the absorbed power affects the surface, the actual is only 1.85 W/m^2. What are you inputing in your formula? Since we both agree that because the re-radiation is isotropic, only half of the absorbed power can affect the surface and the other half is radiated in the same general direction it was already headed. The question then is specifically how much gross additional power is absorbed from a doubling of CO2? -
apiratelooksat50 at 09:53 AM on 12 January 2011Understanding the CO2 lag in past climate change
To Trueofvoice @215; Nice catch on the JB reference. First person on any of these sites to do that. Do libs not listen to Buffett? ;) Also, Roy Clark was not referring to the climate holding steady, but instead to the establishment of the current climate and it's basic ranges of gaseous concentrations. It took billions of years of photosynthesis from cyanobacteria and blue-green algae to oxygenate the atmoshpere. Thanks for being civil. -
Albatross at 09:49 AM on 12 January 2011Could global warming be caused by natural cycles?
Cruzn46, "Really? Tell me in PPM, like they do with CO2, how much water vapor is in the earth's atmosphere today. Then tell me how much was in the atmosphere in 1800." This is off topic. But how about you do calculations? And absolute WV content is measured in g/kg either as specific humidity or as mixing ratio (r). We know that mean RH is ~70%, and we know that the saturation vapor pressure (es) is determined by temperature alone. Between the equations for r and es and RH, and with knowledge of the mean global SAT (and applying) the assumption for constant global RH of 70% you could probably get an estimate of the mixing ratio circa 1880. It would be an interesting exercise, but completely unrelated to this post. Trenberth et al. (2005) found that from 1988 to 2003 the global precipitable water vapour (PWV; vertical integral of r though the atmospheric column) content increased by about 1.3% per decade over the oceans, and that this increase was in turn because of an increase in air temperature, with about a 9% increase in PWV per Kelvin, again over the global oceans. Results form that paper also offer a clue as to the value of mean r circa 1880. But again the answer would be off topic.Moderator Response: If anyone insists on pursuing this topic further, they should do so on a thread revealed by typing "water vapor" into the Search field at the top left of the page. -
Rob Honeycutt at 09:44 AM on 12 January 2011Could global warming be caused by natural cycles?
Thanks Sphaerica! I just got this new track pad so I'm still learning it. That's a great tip. Sorry for the OT comments. -
RW1 at 09:41 AM on 12 January 2011The Physical Chemistry of Carbon Dioxide Absorption
hfranzen, "I have not accounted for water vapor overlap. Since the absorptions are basically lines in the spectrum (a quantum mechanical effect -see the specrum from the astrophysics group at Ohio State in GWPPT6) it is only the occasional overlap that will have an effect and that to reduce the absorption by CO2 slightly. My guess is that this would result in less than a 10% reduction in the absorption and a far lesser effecct in the change in absorption with increasing CO2 ppm. Since my earth-year temperature increase result fits very well with what is actually observed (see #25 above) I am quite certain that overlap is not serious problem and what GWPPT6 shows is the basic thrust of what is occurring. The increase that I am calculating comes directly from the increase in the broad-band diffuse transmissivity as a result of the increase in the ppm of CO2. The latter is measured by the Keeling curve. The former results directly from the physics of GWPPT6 generalizing Beer's Law from s linear absorption of intensity to a broad-band, diffuse abosrption of flux. I input nothing that is not calculated or observed." With all due respect, you can't just make these assumptions. Water vapor absorbs a significant amount in the CO2 absorbing bands, especially on the high end above 15u but below too. Water vapor also exists in much higher concentrations than CO2. Then you have the issue of clouds as well. That is anywhere that is cloud covered, incrementally more power from additional CO2 would have little effect because the clouds would absorb the increased power anyway. Also, there is generally more water vapor in between the surface and the clouds, which would further reduce any effect from additional CO2 because of water vapor overlap. On top of all this, in really dry and cloudless areas where there is the least amount of overlap - i.e. where more CO2 has the highest potential to increase the total surface power, is also where IR heat energy most easily and quickly escapes out to space. This is easily demonstrated by how cold it gets at night in very dry areas with little water vapor or clouds in the atmosphere, such as the desert. Even during the summer, the nights can be very cold - much colder than more moist and/or cloudy areas at the same latitude. Unless you can properly account for and quantify all these things, your numbers really don't have much bearing on reality. -
Bob Lacatena at 09:32 AM on 12 January 2011Seawater Equilibria
71, Dan Bailey, Not a problem. For safety I only drink Medieval Warm Beverages when reading about climate science. -
Bob Lacatena at 09:30 AM on 12 January 2011Could global warming be caused by natural cycles?
30, 31, Rob Honeycutt, How to right click with a Mac trackpad (without using the dang control key). -
Anne-Marie Blackburn at 09:21 AM on 12 January 2011Understanding the CO2 lag in past climate change
gallopingcamel The problem you have is that while we're talking about global warming, you're only focusing on some regions. And as I've already pointed out to you, regional factors can have a considerable impact on regional temperatures. To suggest that this is not what the theory states only shows that you haven't done your homework. You might want to read this FAQ, and then read the whole of chapter 11 for more information on regional climate change. Note also that uncertainties and difficulties are clearly stated. But by all means, if you can show that the AMO or any other factor can explain recent trends in global temperatures, please provide the evidence.Moderator Response: I deleted GC's comment because it is off topic for this thread, and because he knows perfectly well how to find the appropriate threads. -
Bibliovermis at 09:18 AM on 12 January 2011Understanding the CO2 lag in past climate change
Why are you pointing to 0.6% of an area to refute the effect over the whole? What makes it more important than the other 99.4% -
cruzn246 at 09:16 AM on 12 January 2011Could global warming be caused by natural cycles?
Re: cruzn246 (23) "When the PDO goes negative for a time more ice and snow build over the N hemisphere." Apparently you didn't read the post: PDO has NO long-term trend. Strike one. "That forgotten greenhouse gas that we still can't properly quantify worldwide, either presently or historically" Oh-so wrong. Very well studied, quantified and understood. Really? Tell me in PPM, like they do with CO2, how much water vapor is in the earth's atmosphere today. Then tell me how much was in the atmosphere in 1800. We just went through a summer with record high lows for most of July and August. We also had record high dewpoints, on average, over that period. H2O plays a huge role in a warming cycle that is very overlooked. Strike two. "unless some big old volcano blows up. Then we could get some major cooling" Anthopogenic-derived CO2 releases amount to 100X that of all of the world's volcanoes combined. Humans breath out 10X as much CO2 as those selfsame volcanoes do (but that human CO2 is part of the closed carbon cycle, unlike fossil fuel CO2). Anyway, volcanic cooling imposed on the globe is transient, unlike the documented effects of CO2. That's strike three, you're out. Next batter... (BTW, it's "Milankovitch") The Yooper Yeah, it is Milankovich. Dan, I'm not talking about your run of the mill explosions of volcanoes. I'm talking about the ones that truly alter climate, like Tambora or Mount Pinatubo.Moderator Response: [Daniel Bailey] Please read this post by Tamino. He proves the transient cooling of volcanoes by removing their effects and that of cyclical stuff (like El Nino) to get this (as you can see, no lasting presence of Pinatubo):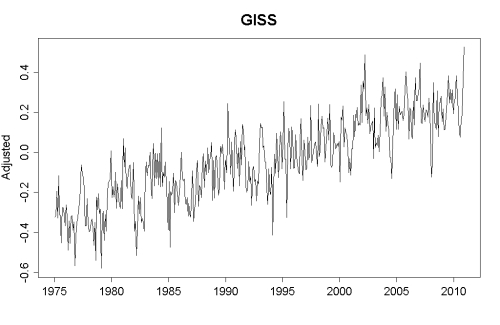
-
Rob Honeycutt at 09:00 AM on 12 January 2011Could global warming be caused by natural cycles?
Heehee... Daniel. I actually know the command (option+click). Just wanted to inject some humor. ;-)Moderator Response: [Daniel Bailey] Sorry, Rob. I'm so completely mouse-dependent I could not use my laptop without one. -
Rob Honeycutt at 08:59 AM on 12 January 2011Could global warming be caused by natural cycles?
Daniel.... Um... Right click?
-
h pierce at 08:58 AM on 12 January 2011Could global warming be caused by natural cycles?
RE: Cyclic Climate Changes: What the Russians Say. The English translation of "Cyclic Climate Changes and Fish Productivity by L.B. Klyashtorin and A.A. Lyubushin can be downloaded for free thru this link: http://alexeylyubushin.narod.ru/Climate_Changes__and_Fish_Productivity.pdf? NB: This mongraph is 224 pages. By analyzing a number of time series of data related to climate, they found that the earth has global climate cycles of 50-70 years with an average of about 60 years with cool and warm phases of 30 years each. They summerize most of the studies that show how this cycle influences fish catches in the major fisheries. The last warm phase began in ca 1970-75 (aka the Great Shift) and ended in ca 2000. The global warming from ca 1975 is due in part to this warm phase. A cool phase has started and they predict it should last about 30 years. Several others studies have found this 60 year cycle. During the cool phase La Nina years usually out number El Nino years as was the case from ca 1940-70. KP @ #18 The 60 year cycle can be seen in the middle figure: 1850-1910 and 1910-70. However note that after 1970-75, the temperature did not decrease as it did at about 1940. Presumably this is due to extra heating caused by CO2 whose concentation began to increase at a greater rate than before that time. There is one other factor that contributes to global warming: Fine black dust from rubber and asphalt. I ask this simple question: Since 1900, where have the many billions (and billions and billions...!) of pounds of rubber and asphlate dust gone? The short simple answer is anywhere and everywhere. Synthetic rubber does not degrade upon exposure to sunlight, oxygen or microbes. A passenger car tire with an A treadware rating will lose about a pound of rubber over it lifetime. Can you imagine how much rubber 18 wheelers shed on the highways? -
Bob Lacatena at 08:55 AM on 12 January 2011Seawater Equilibria
66, Chris G, Before I forget... I explained rate of reaction to my daughter using a different analogy. Imagine a gymnasium full of thousands of mice, and kids with mouse-scoopers and terrariums. The kids have to collect the mice and put them in the terrariums, from which they do occasionally escape. At first, catching mice is easy, because there are so many. With time, there are fewer, and the buggers are fast, so the catching is slower. At the same time, the job is never done, because at some point it gets so hard to find and catch mice that for every mouse they catch, another escapes. One can change that balance point (the rates of reaction) by adding more mice or kids (more reactants of one type or the other), making the terrariums more/less secure (changing the rate of the reverse reaction with an inhibitor), introducing better mouse-scoopers (catalysts) or taking them away and making them catch mice by hand, or by doing the catching when the children and mice are tired (equivalent to reducing the temperature in many reactions). -
Bob Lacatena at 08:49 AM on 12 January 2011Seawater Equilibria
I said "restock" and "emit rather than absorb", but what I really meant was that the ocean/atmosphere would reach a balance in the exchange where CO2 levels in both the ocean and the atmosphere would stay relatively constant until temperatures found a reason to drop. -
Bob Lacatena at 08:46 AM on 12 January 2011Seawater Equilibria
67, Dan Bailey, 69, Me and Dan Bailey, I think my problem was this. The Mathews and Weaver letter says that if CO2 emissions stopped abruptly, CO2 levels would immediately begin to drop, because the ocean would continue to absorb the excess. I'm not sure, based on this post and discussion, that that is entirely true. As the partial pressure of CO2 in the atmosphere drops, the ocean could may well at a certain point "restock" the atmosphere and keep CO2 levels high. The point at which this happens depends partly on the temperature of the ocean when CO2 emissions cease. The warmer the ocean is, the higher the ppm at which it is likely to emit rather than absorb. That would be bad, because it would keep CO2 levels and temperatures elevated, which would in turn help to prevent the absorption of CO2 by the ocean. I'd be curious if Dr. Franzen or anyone else could compute the curve... the ocean temperature vs. CO2 ppm below/above which emission/absorption occurs. Some other process would be needed to get CO2 out of the atmosphere. Could this be an important "tipping point" in our own decision of when to reduce CO2 emissions? Or is the ocean likely to act as a very convenient sponge and clean up any mess that we make, no matter how tardy we are in recognizing our mistake?Moderator Response: [Daniel Bailey] You may want to put down any hot liquids before reading this then. -
Bob Lacatena at 08:32 AM on 12 January 2011Seawater Equilibria
66, Chris G, 68, boba10960, Thanks to Chris for trying... although I am already comfortable with the concept of rate of reaction (and that variables can change the various rates "on either side of the net", resulting in different equilibrium points). My thought was more along the lines that boba10960 responded to... that on the land existing vegetation must be covered by snowfall as a glacial period progresses (perhaps I shouldn't have used the term "ice sheet") over much of the North American and Eurasian continents, and that would necessarily (I think) cover a whole lot of vegetation before it could decay. Subsequent warming would have to eventually reveal that carbon, which could proceed to decay, while the usual "new growth" isn't immediately present to do the opposite, and turn atmospheric CO2 into "wood" at the same rate as the stalled decay could do the reverse. But boba10960's logic about being able to measure this due to changes in ocean acidity makes perfect sense. [That's the part I love about science, that Sherlock Holmesian inference that one can make from seemingly inconsequential details.] At the same time, while walking the dog (through the woods!) earlier I realized that the time scales in my scenario could be very wrong. As much as such vegetation would be covered/uncovered, it would just mean (in geologic terms) a pretty rapid return to the status quo of old/dead vegetation decays and new vegetation grows, resulting in a relative CO2 balance there, maybe even a shift the other way as previously suggested (i.e. new growth extracts more carbon the old decay returns). So that image in my mind's eye was perhaps faulty, or at best uncertain. Thanks much, boba10960. I learned a lot today, and realized where I have big holes in my understanding and need to do more reading. -
Bob Lacatena at 08:18 AM on 12 January 2011Seawater Equilibria
67, Dan Bailey, That was it! Yes! Now I just have to remember why I was asking about it. I know it had to do with this statement from that post:CO2 concentrations would start to fall immediately since the ocean and terrestrial biosphere would continue to absorb more carbon than they release as long as the CO2 level in the atmosphere is higher than pre-industrial levels (approximately).
I just don't know what my train of thought was that wanted to get at that statement.Moderator Response: [Daniel Bailey] Try reading comments 38-47; maybe that'll jog your memory. -
Rob Honeycutt at 08:12 AM on 12 January 2011Could global warming be caused by natural cycles?
Keithpickering @ 18... Wow. Is there a way to link to those graphs?Moderator Response: [Daniel Bailey] Rob, if Keith doesn't mind hosting them, you can just right-click on the desired graphic, select "view image" and then the URL of just the graphic will show in the location pane. -
Klaus Flemløse at 07:47 AM on 12 January 2011Graphs from the Zombie Wars
Co2 and Global temperatures Muoncounter @ 72 Tanks for the link to T.G. Wilson Albatros @ 73 Thanks for the link to Kodre et al – it will take some time to digest this paper Archiesteel @ 75 I was surprise about Soares conclusion from Figures 10/11. Then I found out that taking year to year differences in two independent time series always will produce zero correlation. That my point of view. This can be proven mathematically or by simulation. This will also be true for the time series Keithpickering has used. Given me time and I will produce the graphics. The Soares conclusions in respect of these graphs are either caused by lack of knowledge or bad will. This result will be repeated again and again on skeptical blogs.Be prepared! -
muoncounter at 07:47 AM on 12 January 2011It's the sun
#776: "disagree that average solar activity levels 1950-2000 are higher" Yep. See Deep solar minimum (from 2009) which reports: A 50-year low in solar wind pressure A 12-year low in solar "irradiance" A 55-year low in solar radio emissions -
Bibliovermis at 07:45 AM on 12 January 2011It's the sun
Read the article, not just the one-liner summary. -
Bibliovermis at 07:43 AM on 12 January 2011It's the sun
Please explain how a decreasing solar irradiance yields an increasing global temperature. -
boba10960 at 07:39 AM on 12 January 2011Seawater Equilibria
Sphaerica, #62 Chris G #64 has already noted that there is little organic matter stored under ice sheets. Nevertheless, the hypothesis you mention is still advocated by some people, as described by Ning Zeng . However, we can be certain that the source of the rising atmospheric CO2 as the last ice age ended was the ocean and not on land, either under the ice sheets or in permafrost. If the CO2 had come from a source on land, then it would have acidified the ocean, as is happening today in response to burning fossil fuels. Stated another way, following the chemical equilibria described by Dr. Franzen, adding CO2 to the atmosphere from a source on land would have shifted the chemical reactions in seawater in the direction that dissolves more calcium carbonate in the deep sea. By contrast, extracting CO2 from the ocean by increasing the physical mixing that exchanges gases between the deep sea and the atmosphere (described in my earlier comment) would shift chemical equilibria in the direction that dissolves less calcium carbonate in the deep sea. The geological record indicates that calcium carbonate in deep-sea sediments was less dissolved (better preserved) during the time period that atmospheric CO2 was rising as the last ice age ended. From this, we know that the CO2 (at least most of it) came from the ocean, and not from a source on land. -
thepoodlebites at 07:35 AM on 12 January 2011It's the sun
#775 I did read the "What the Science Says." The article is is not factually correct. Do you disagree with the NASA study? Do you disagree that average solar activity levels 1950-2000 are higher compared to those for 1900-1950?Moderator Response: [Daniel Bailey] Then you should read the Advanced version. Seems obvious to me (graphic from NASA/Solanki/PMOD data):
-
Bibliovermis at 07:14 AM on 12 January 2011It's the sun
Your understanding is incorrect. Please read the article you are replying to. As for a decrease in solar activity trumping the enhanced greenhouse effect, please use the search box to find the article on what would happen if the Sun returned to Maunder Minimum activity levels.
Prev 1967 1968 1969 1970 1971 1972 1973 1974 1975 1976 1977 1978 1979 1980 1981 1982 Next


