


 Arguments


Recent Comments
Prev 2026 2027 2028 2029 2030 2031 2032 2033 2034 2035 2036 2037 2038 2039 2040 2041 Next
Comments 101651 to 101700:
-
mars at 19:39 PM on 9 December 2010Stratospheric Cooling and Tropospheric Warming
Joe Blog 199 18:27 PM The atmosphere at low levels is transparent to nearly all of the incoming radiation. The atmosphere is heated by contact with the surface. As a result a parcel of air close to the ground forms which is warmer than the surrounding air. This parcel then expands making it less dense than the surrounding air and it starts to ascend cooling adiabatically. Simple put in the case of dry air it will cool at the rate 9.8 C per KM but the environmental lapse rate will be less than this so at some height the parcel will reach equilibrium with the local air mass and the parcel will stop rising. Thus heat from the surface is moved into the troposphere. This process is only marginally impacted on by radiation transfers. I hope we are not straying to far from the main topic here. -
Bibliovermis at 19:18 PM on 9 December 20101934 - hottest year on record
2007 is the warmest year based on the GHCN dataset. GHCN summary After the calendar flipping, I'll update that page for 2010. -
Joe Blog at 18:27 PM on 9 December 2010Stratospheric Cooling and Tropospheric Warming
mars at 18:05 PM The point is, if the atmosphere was totally transparent, there wouldnt be convection... because radiation would simply pass through the atmosphere without interacting... So at low altitudes, where the atmosphere is opaque, convection is the dominant means of energy transfer, but as you rise through the troposphere, radiation, moves more and more of this energy, and less is moved through convection. Because the path length for the LW shortens. Put very simply, because there are less and less radiatively opaque molecules per volume. in the stratosphere, the atmosphere is opaque to UV, but less so to LW, so it does heat, and the upper levels do convect, but LW cooling from below causes the inversion, preventing convection. -
mars at 18:05 PM on 9 December 2010Stratospheric Cooling and Tropospheric Warming
Tom the parcel of air in your example cools adiabatically (if non saturated) at a rate of 9.8 deg c per 1km and can rise at rates 300 meters per min. The cooling due to radiation is too slow and is normally ignored in weather forecasting of thermal heights. -
mars at 17:53 PM on 9 December 2010Stratospheric Cooling and Tropospheric Warming
As a glider pilot I spent many hours studying the weather and using convection as a source of lift. I am fairly sure Tom is right as above. -
We're heading into an ice age
NQuest @168, I have responded to your comment here so as not to distract from the topic of this thread. -
Arctic icemelt is a natural cycle
Response to NQuest from the ice age thread> You're missing the point. None of those examples suggest that the changes will be monotonic year-after-year. When discussing global warming we are referring inherently to long term trends. Given the degree of annual variation, you need about 15 years to establish statistical significance. A 2-3 year trend means little to nothing with regard to the long term trends being discussed. This is a common misunderstanding among many skeptics and this same discussion has played out many many times on this site. It is in no way new or "sudden". The natural variation referred to is of the inter-annual short-term variety. If you take a look at the graph provided in this post, you can see clearly that there has been a clear downward trend extending from about 1970. You may also notice that there are many 2-3 year "recoveries" amidst this trend. It is because of this variability in the signal that you must look at 10+ years of data to make any claims about whether the ice is melting or growing over the long term. -
Joe Blog at 17:44 PM on 9 December 2010Stratospheric Cooling and Tropospheric Warming
Tom Curtis at 17:41 exactly ;-) -
Tom Curtis at 17:41 PM on 9 December 2010Stratospheric Cooling and Tropospheric Warming
Joe Blog @191, I think I have completely misunderstood your point. Consequently, much of my discussion in 193 is irrelevant, so feel free to ignore it. If I have correctly understood your point now, it is this: A parcel of warm air in the lower atmosphere is surrounded by other parcels of air of similar temperature. Because the atmosphere is opaque to 15 micron radiation at that level, heat it radiates away is matched by heat absorbed from the neighbouring parcels of air. Consequently cooling by radiation is very inefficient at best, and the only way for the parcel of air to cool is to rise through the cooler air above it, thus driving convection. In constrast, once the parcel of air reaches about 8 km altitude, approximately half of the heat it radiates away radiates to outwards. In return, it receives very little energy from that direction, so radiation now effectively cools the parcel of air. This cooling deprives it of the ability to continue to rise by convection. Is this a fair statement of your view? And what corrections would you make, if any? -
Joe Blog at 17:40 PM on 9 December 2010Stratospheric Cooling and Tropospheric Warming
Tom Curtis at 17:16 PM There is nothing you have written i really disagree with, the inversion is the reason for the cessation of convection, yes. Why is there an inversion? This is what i was getting at, if the atmosphere was optically thick at those altitudes, the downward radiation from the warmer higher layer, would heat the layers below, until they were in equilibrium. And with the continuing up ward flux from the top of the troposphere, it would revert to an adiabatic profile. If you add co2, it increases opacity, decreases radiative efficiency, meaning that you have to go higher, to a lower pressure, where the opacity will enable the transfer of energy...raising the tropopause... we agree on that as well. We are talking past each other, its a question of cause and effect, if there was no O3 absorption of UV, we wouldnt have an inversion, if the air above the tropopause was optically thick, but we had O3 absorption, we also would not have an inversion. There was a good conversation on one of the venus threads over at science of doom, that loosely covers this. -
NQuestofApollo at 17:32 PM on 9 December 2010We're heading into an ice age
To Tom Curtis (164) - I was responding directly to post #127. If you are so inclined, please read #127 then read #161. If you still don't understand the point of my post, I will attempt to provide a better explanation. -
NQuestofApollo at 17:22 PM on 9 December 2010We're heading into an ice age
To CBDunkerson (165) - following are three examples that support (in my opinion) the AGW promoters logic that accumulated CO2 would cause the sea ice extent to continue to decline: IPCC TAR 2001 The systematic decrease in spring and summer Arctic sea-ice extent in recent decades is broadly consistent with increases of temperature over most of the adjacent land and ocean. NASA 2003 "Researchers have suspected loss of Arctic sea ice may be caused by changing atmospheric pressure patterns over the Arctic that move sea ice around, and by warming Arctic temperatures that result from greenhouse gas buildup in the atmosphere. Warming trends like those found in these studies could greatly affect ocean processes, which, in turn, impact Arctic and global climate…As the oceans warm and ice thins, more solar energy is absorbed by the water, creating positive feedbacks that lead to further melting." And my favorite headline: Argentine glacier advances despite global warming June 2009 'We're not sure why this happens,' said Andres Rivera, a glacialist with the Center for Scientific Studies in Valdivia, Chile. 'But not all glaciers respond equally to climate change.' It is interesting to see AGW promoters suddenly embrace the "expected natural variation" explanation. That's pretty much what the "Climate Change Deniers" have been saying all along. -
Tom Curtis at 17:16 PM on 9 December 2010Stratospheric Cooling and Tropospheric Warming
Joe Blog @187, my opinion on the tropopause is based more on my personal reading of the admitedly limited evidence that I have rather than reading any expert on the matter. Consequently, of course, I could be entirely wrong, and if you (or anyone else) could reffer me to an expert disussion of the issue, I would be very appreciative. However, consider the following representation of the thermal profile of the atmosphere: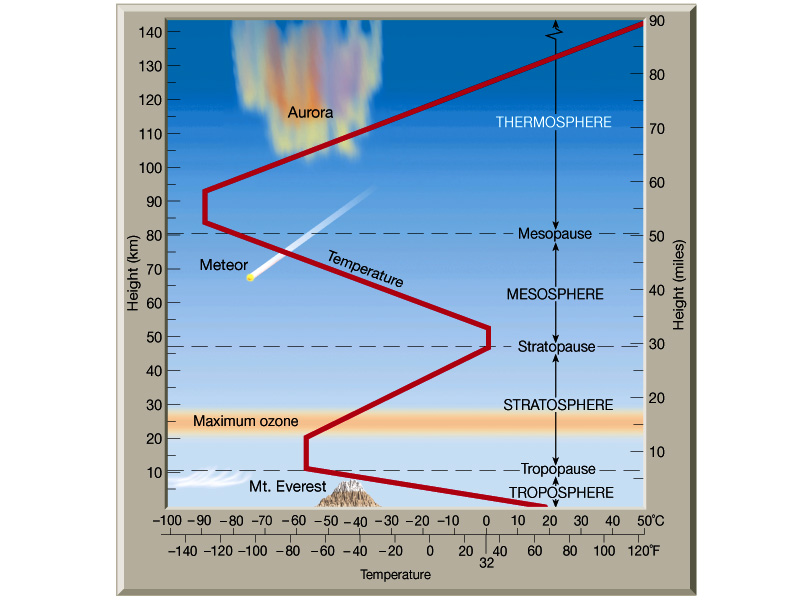 If the tropopause was the location where thermal radiation moved energy faster than convective processes could, then we would expect the effects of that transition to be even greater in the mesosphere, where collisions are fewer and radiation less likely to be absorbed. Therefore, in the mesosphere, we would expect a larger heat differential between layers would be required to drive convection. We would also expect convection to cease being effective at a higher temperature than is the case in the troposphere.
Neither of these is the case. Looking at the diagram, we see that there is a steeper (less temperature difference per unit altitude) lapse rate than in the troposphere, contrary to our expectations. We also see the temperature at which the lapse rate inverts and convection ceases is 30 degrees C less than that at the tropopause. In both cases, we see less energy available to drive convection than exists at the tropopause still managing to drive convection, and this despite the fact that radiation is even more important as a heat transfer mechanism at this level than at the tropopause.
We also see a general pattern of increased surface temperature raising the tropopause, which we would expect if the inversion is the cause of the cessation of convection, rather than its consequence. This even applies to the consequences of global warming. Increasing CO2 concentrations increases the importance of radiation as a heat transfer mechanism. Therefore, if you are correct, we should expect increased CO2 to result in a fall in the altitude of the tropopause. In contrast, if the tropopause is a consequence of differences in heat with altitude, then increasing surface temperature should raise the tropopause, which is what we see.
I do believe the increased relative importance of radiaton as a heat transfer mechanism is relevant. Specifically, by allowing heat to be transfered over long distances, it allows a thick tropopause because air at that altitude can be heated by warmer air several kilometers above and below it. But without the warmer air above, it seems to me that no tropopause would develop.
If the tropopause was the location where thermal radiation moved energy faster than convective processes could, then we would expect the effects of that transition to be even greater in the mesosphere, where collisions are fewer and radiation less likely to be absorbed. Therefore, in the mesosphere, we would expect a larger heat differential between layers would be required to drive convection. We would also expect convection to cease being effective at a higher temperature than is the case in the troposphere.
Neither of these is the case. Looking at the diagram, we see that there is a steeper (less temperature difference per unit altitude) lapse rate than in the troposphere, contrary to our expectations. We also see the temperature at which the lapse rate inverts and convection ceases is 30 degrees C less than that at the tropopause. In both cases, we see less energy available to drive convection than exists at the tropopause still managing to drive convection, and this despite the fact that radiation is even more important as a heat transfer mechanism at this level than at the tropopause.
We also see a general pattern of increased surface temperature raising the tropopause, which we would expect if the inversion is the cause of the cessation of convection, rather than its consequence. This even applies to the consequences of global warming. Increasing CO2 concentrations increases the importance of radiation as a heat transfer mechanism. Therefore, if you are correct, we should expect increased CO2 to result in a fall in the altitude of the tropopause. In contrast, if the tropopause is a consequence of differences in heat with altitude, then increasing surface temperature should raise the tropopause, which is what we see.
I do believe the increased relative importance of radiaton as a heat transfer mechanism is relevant. Specifically, by allowing heat to be transfered over long distances, it allows a thick tropopause because air at that altitude can be heated by warmer air several kilometers above and below it. But without the warmer air above, it seems to me that no tropopause would develop.
-
mars at 17:16 PM on 9 December 2010Stratospheric Cooling and Tropospheric Warming
Re VeryTallGuy 185 Re the temperature profile can not be changed in modtran Modtran assumes that the atmosphere contains oxygen and therefore calculates its effects on the stratosphere via the UV spectrum. So even if you put Zero tropospheric ozone into the model you will still get get a result calculated for the stratospheric ozone. The give away is in the graph for a planet with supposedly no atmosphere where we have dip in emissions around wave number 1300 due to ozone. In fact this is graph for a planet with an atmosphere the same as earths but with no CO2 or water vapor. Whether this invalidates Bobs whole argument or not I don't know but it does explain the temperature profile. -
Joe Blog at 17:10 PM on 9 December 2010Stratospheric Cooling and Tropospheric Warming
mars at 13:11 Yes and no.... if the atmosphere had a layer that absorbed all the SW high up, and we had an optically thick atmosphere, the T profile should be isothermal... We have inversions here at the surface, frosts for example, they are the result of increased transparency, through low humidity/ no clouds, and still air, to prevent the mixing of the layers. So it opens the atmospheric window, and radiation passes up from the surface, cooling the surface faster than the higher layers... this is how inversions happen, the energy must pass up through the higher layers without interacting with it. Because energy cannot be created or destroyed... and radiation is not directional. So if half of the energy from the stratosphere is going down, but cannot escape, why isnt its temperature moving toward equilibrium with its source? -
dana1981 at 16:03 PM on 9 December 2010The Scientific Guide to Global Warming Skepticism
The content of the guide is excellent, but perhaps as important for the general public, it just looks damn good. A consequence of John's considerable graphic arts skills.Response: Wendy did the heavy lifting in the graphic arts department. She's the right brain part of our partnership.
But it is true, her work looks damn good. :-) -
archiesteel at 16:03 PM on 9 December 2010Renewable Baseload Energy
@quokka #1: the article makes a good case against the fallacies about renewables and baseload power #2: Distributed power generation is not a fantasy, it is a inevitable long-term trend. Storage is not the impossible puzzle you describe it to be, as it doesn't need to be stored locally. #3: I'm not assuming that R&D will solve every problems, but it's disingenuous for you to suggest that prices will remain what they are. The fact remains: if Wind and Solar had been as subsidized as Nuclear, imagine how cheap (and distributed) the technology would be today. #4: you make the same fallacious association as Peter Lang, that if someone isn't for 100% Nuclear, one is against Nuclear. That oft-repeated lie alone is enough not to take you seriously. The solution is a mix of techniques and technologies: nuclear, hydro (including tidal power), wind, solar and a little bit of fossil fuels (mostly natural gas). #5: I don't see this happening. Rather, I think we'll continue to see huge gains made by renewables. As I said, we'll have to agree to disagree. You can repeat your sales pitch again, if you want, but until you decide to see renewables as allies instead of rivals, you will not help your overall agenda. -
Daniel Bailey at 15:58 PM on 9 December 2010How to explain Milankovitch cycles to a hostile Congressman in 30 seconds
Alley demonstrates the bald spot schtick, and more: A simply amazing communicator at the top of his game. The Yooper -
Daniel Bailey at 14:39 PM on 9 December 20101934 - hottest year on record
Re: BonIver (35) Looking at this post on the subject, then I'd say you're right. I'll send an email to John asking about this. Thanks for pointing it out. The Yooper -
sailrick at 14:24 PM on 9 December 2010A Cloudy Outlook for Low Climate Sensitivity
Through July 2010, were the warmest 14 months in the temp records, and through May -the warmest 12 months. With less than a month left of 2010, it is still not known if 2010 will set a record, despite the fact that La Nina has already started. 1998 was nearer the top of the 11 year solar cycle and 2010 is closer to the bottom. The 2009-2010 El Nino was nowhere near as strong as 1998-99. And yet - Every year since 2001 has been warmer than any year in the records before 1998. I really don't get why the "warming has stopped" argument keeps getting repeated. -
Leland Palmer at 13:43 PM on 9 December 2010Positive feedback means runaway warming
Here are a couple other very interesting papers on methane hydrates, that Skeptical Science readers likely haven't seen yet: NETL Methane Hydrates PageThe results generated through this project have lead to LBNL and LANL researchers publishing four papers in the peer-reviewed literature. (For more information, see the methane hydrate bibliography document.) The first paper, published in the Journal of Geophysical Research (Vol. 13, C12023, 2008) assessed the stability of three types of hydrate deposits and the dynamic behavior of these deposits under the influence of moderate ocean temperature increases. The results indicated that deep-ocean hydrates are stable under the influence of moderate increases in ocean temperature; however, shallow deposits can be very unstable and release significant quantities of methane under the influence of as little as 1 degree C of seafloor temperature increase. A second paper, published in Geophysical Research Letters (Vol, 36, L23612, 2009)here presented the first results of the 2-D slope-scale modeling, demonstrating that shallow hydrates in sloping systems may, alone, generate significant methane and lead to the formation of gas plumes at the seafloor. The results were consistent with the observation of methane venting along the upper limit of a receding GHSZ [Gas Hydrate Stability Zone- LP] off Spitsbergen. The third paper, published in Geophysical Research Letters (Vol, 37, L12607, 2010) and the fourth paper, in final revision for the Journal of Geophysical Research, present the first results of forward-coupled methane release, water column chemistry, and transport via ocean currents using a 1o version of the POP code. These establish a new paradigm for understanding the response of the oceans to methane release on a large scale. In particular, the work highlights the importance of resource limitations. Large and concentrated methane plumes may deplete the surrounding water of oxygen and other trace nutrients, reducing the ability of methanotrophs to consume the methane and increasing the chance of release into the atmosphere. This is in sharp contrast to previous assumptions of “99% consumption” of methane for all release scenarios.
So, the news from these papers appears to me to be bad. The rate of release from hydrate deposits is limited by the endothermic nature of hydrate dissociation, and by fluid flow limitations, according to the second paper mentioned above, though. So - a crucial point - whether these deposits will lead to runaway warming may be very dependent indeed on their total quantity. An order of magnitude difference in estimates of their total quantity, with one of the estimates coming from Archer, who writes papers with ExxonMobil chief scientist Kheshgi, is just unacceptable. -
Daniel Bailey at 13:42 PM on 9 December 2010We're heading into an ice age
Re: NQ/A (159) I have replied to your comment over here in order to not be a further distraction to this thread. The Yooper -
Daniel Bailey at 13:42 PM on 9 December 2010Guest post: scrutinising the 31,000 scientists in the OISM Petition Project
Re: NQ/A (This is a reply to a comment NQ/A made on another thread, linked above) I presume you have been misinformed on this topic, else you would not have said this:"Daniel stated that GHG effect of CO2 is "not seriously questioned by any competent scientist anywhere". The only purpose in sending the link to the Petition Project was to show that over 31,000 scientists - surely some of whom must be "competent scientist" somewhere - provided a detailed explanation for their disagreement with AGW. I also took issue with his definition of "competent scientist" and provided links to support my position. It wasn't my intention to open a direct discussion on the petition project or climategate, but to offer those issues as causing legitimate doubt.
Please read the main article that is the topic of this thread. My definition of "competent scientist" should be clear after reading the post. If not, then this should illuminate the remainder of the darkness remaining. The Yooper -
mars at 13:11 PM on 9 December 2010Stratospheric Cooling and Tropospheric Warming
Joe Blog at 189 Quote "But what i was getting at, was that the inversion between the upper troposphere and lower stratosphere, is due to the opacity, which is a result o the pressure & concentration of GHG's. The inversion itself is proof of this, if it was opaque, you would expect an adiabatic T profile up until the energy could escape... in the upper stratosphere." End quote The inversion is simply caused by the fact that the formation of ozone causes atmospheric heating. Thus preventing further convection. Inversions are common in the atmosphere and are the result of pools of warmer air forming above. The mechanism is usually due to air descending and heating adiabatically. -
Ron Crouch at 13:02 PM on 9 December 2010The Scientific Guide to Global Warming Skepticism
Great stuff John. Many thanks to the contributors as well. I've made mention in my "usual" spot. Your usage of the "Human Fingerprint" in one of your replies leads me to reflect that it certainly is not the planet that is broken but rather humanity itself. The planet is quite capable of taking care of itself, and will on geologic time scales (say roughly another ~250Myr). -
Bern at 12:04 PM on 9 December 2010The Scientific Guide to Global Warming Skepticism
Great work, John. Will make sure everyone I know knows about it... BTW, have you sent out press releases to the various media organisations? Might be worth it to get the guide a bit more widely disseminated.Response: Scott Mandia (the guy who suggested doing the Guide in the first place) has notified major media outlets and his extensive list of media contacts. -
Joe Blog at 11:59 AM on 9 December 2010Stratospheric Cooling and Tropospheric Warming
mars at 11:20 AM I dont doubt what you say. What i wrote was a lil messy... this "preventing a build up/heating of a layer above that above it" Was meant to be, that reducing opacity, means that more energy is moved through radiation, resulting in less and less energy being trapped in the levels as you rise through the troposphere, which would mean radiation becomes more and more dominant, and convection less and less with reducing pressure as you rise through the atmosphere... but in the upper stratosphere, due to O3 absorption, convection once more plays a role. Because as you say its due to the T differential.. a thread at Science o Doom is discussing this very issue at the moment. But what i was getting at, was that the inversion between the upper troposphere and lower stratosphere, is due to the opacity, which is a result o the pressure & concentration of GHG's. The inversion itself is proof of this, if it was opaque, you would expect an adiabatic T profile up until the energy could escape... in the upper stratosphere. -
quokka at 11:39 AM on 9 December 2010Renewable Baseload Energy
@383 michael sweet I think solar hot water heaters are a great idea. I live in a house with solar heating for the pool. I've lived in a house with solar heating for domestic hot water and it worked very well - but the climate is quite good for solar heating. I agree with government subsidies for solar hot water. You have however not put any real figures on how much electricity would be saved world wide. You know - proper analysis such as influence of climate, cost effectiveness under different climatic conditions, plausible rate of deployment etc etc. I would be very interested in looking at a decently constructed scenario. You are choosing to substitute a narrative for analysis. It's really not much use. I would agree that "A combination of methods *can* outperform a single method". However the outcome is critically dependent on the weighting given in terms of investment and resources to the various methods. There is a very good reason Hansen returns again and again to the need to get rid of coal in baseload generation ASAP. This is, if you like, on the critical path of the project for a low emissions future. Desirable as it is, solar hot water heating is not. -
mars at 11:20 AM on 9 December 2010Stratospheric Cooling and Tropospheric Warming
Joe Blog 187 Convection occurs occurs when the air above is cooler than the air below. In the stratosphere the temperature increases with height. Therefore convection can not occur there. The cooling due to increased levels of CO2 nevertheless continues into the next layer (Mesosphere) becoming even more pronounced. I Don't buy Bobs 2nd explanation as being relevant. I am convinced that the effect is too small and is overwhelmed by the warming that occurs at the top of the troposphere due heat being dumped there from the condensation of water vapor. See the troposphere hot spot on this site for more info on how this works. -
Chemware at 11:05 AM on 9 December 2010The Scientific Guide to Global Warming Skepticism
Geo77 @18: why doesn't CO2 have an equal effect in blocking the heat coming into the earth as it does on blocking the heat leaving? Your guess is correct: the sun, being a black body at ~5000 K, radiates mostly in the "visible" region, with a peak near 500 nm. The earth, also a black body, but at ~290 K, radiates in the infra-red, with a peak near 10,000 nm (10 um). Nice graphics here and here. Greenhouse gases (CO2, H2O, CH4, etc) are transparent in the visible region, so absorb very little radiation from the sun. However, they do absorb strongly in several regions of the infra-red. Another nice graph there. -
JMurphy at 10:36 AM on 9 December 2010We're heading into an ice age
NQuestofApollo wrote : "Your links to the hockey stick issue don't change the fact that two different sets of data were concatenated. AGW promoters find this acceptable, the rest of us do not. I'd like to discuss the urban heat effect, but fear we would just talk past each other." The facts are stated in the links I gave previously, so you should comment on one of those threads if you want to outline any objections that aren't answered there. You can discuss Urban Heat here, here or here. NQuestofApollo wrote : "The only purpose in sending the link to the Petition Project was to show that over 31,000 scientists - surely some of whom must be "competent scientist" somewhere - provided a detailed explanation for their disagreement with AGW." No, that "detailed explanation" was provided by Robinson, Robinson and Soon, with such gems as a first graph which purports to show the MWP much, much warmer than now (using the Sargasso Sea as the world, and projecting world temperature from that from 1975 to 2006 - but you find that acceptable, supposedly ?); and mentioning the "colonization of Greenland" - again, acceptable 'facts' for you ? NQuestofApollo wrote : "I also took issue with his definition of "competent scientist" and provided links to support my position." Couldn't find the links you are referring to, which "support your position". Could you point them out, please ? NQuestofApollo wrote : "most of your links regarding the IPCC back up what I said - the IPCC either lied or "misread" data. Furthermore, that happened because their reports were NOT peer viewed. Further promoting my point that they are not an entirely reliable source." Again, you will have to point out the bits that made you decide to believe that the "IPCC either lied or 'misread' data". As for the IPCC itself, I suggest you have a look at the WIKIPEDIA description : The IPCC does not carry out its own original research, nor does it do the work of monitoring climate or related phenomena itself. A main activity of the IPCC is publishing special reports on topics relevant to the implementation of the UN Framework Convention on Climate Change (UNFCCC), an international treaty that acknowledges the possibility of harmful climate change. Implementation of the UNFCCC led eventually to the Kyoto Protocol. The IPCC bases its assessment mainly on peer reviewed and published scientific literature. If you need to link to Monckton's website to get your information, I would suggest you are limiting your understanding a great deal. -
Bob Guercio at 10:33 AM on 9 December 2010The Scientific Guide to Global Warming Skepticism
Geo77 -18 I think what you are saying makes sense. To paraphrase, the earth warms up during the day and cools off at night. So it seems logical that there would be more outgoing radiation after it has heated up and outgoing radiation is what is blocked. Regarding your comment about heat coming into the earth - Infrared does not come in from the sun; at least nothing appreciable if anything at all. Ultraviolet comes in, impacts and warms the ground and the ground radiates the Infrared. sailrick - 20 You got me thinking. It seems to me that because of the warmth of the day, you will have more moisture in the air than you would at night. Water vapor is a greenhouse gas. CO2 would be more appreciable with less water vapor. During the day, for the sake of argument only because I have no idea what the numbers are, CO2 may represent 20% of the greenhouse gases while at night it may represent 80% Is this what you are saying? Also, I suppose whatever argument we come up with for the night/day issue is going to apply to the winter/summer issue. Bob GuercioResponse: "Ultraviolet comes in, impacts and warms the ground and the ground radiates the Infrared."
To be precise, it's primarily visible light that warms the Earth's surface. UV light is mostly absorbed by the ozone layer. -
Jesús Rosino at 10:11 AM on 9 December 2010The human fingerprint in the seasons
I think this should be corrected: "What we observe instead is the poles warming around 3 times faster than the equator." That's only valid for the North Pole, but not for the South Pole. What we expect from greenhouse warming is Arctic amplification, rather than polar. -
Phil at 09:45 AM on 9 December 2010The Scientific Guide to Global Warming Skepticism
Moderator @19 Dang yes you're right. I think there's something about the sequence "Most Likely", "Likely", "Very Likely" that looks wrong, but yes when you think about it more ... Sorry for the false alarm -
sailrick at 09:15 AM on 9 December 2010The Scientific Guide to Global Warming Skepticism
Bob Guercio @13 Though not highly technical, this might help. I pay attention to night time dew, because it can effect my work. What I have observed is that there is less dew on overcast or cloudy nights. On clear nights, heat radiates out into space faster, causing more dew. Similarly, greenhouse gases slow the radiative cooling at night, hence warmer night time temps. If the sun was the cause of warming, you would expect to see more daytime warming, when the sun is out. But instead, night temps are rising faster than day temps. Bacisally the same idea for summer / winter. Now I'm wondering if the overcast nights being warmer has more to do with mixing between layers of the atmosphere, in which case, the analogy is not as good. Anyone? -
Phil at 08:58 AM on 9 December 2010The Scientific Guide to Global Warming Skepticism
Great job John but ... there's a mistake in the figure on page 8 where the captions at the top "Likely" and "Very Likely" are the wrong way round :-( I'd vote for "Its frigging cold" being included in the next edition, if only because where I am, it is - at the moment. And whilst I'm on the subject - any plans for a blog post on this "WACCo"(Warm Arctic, Cold Continent) weather modeling ?Response: No, the captions for Likely and Very Likely are correct (I checked now just to be sure). The shorter thicker bar (off the top of my head) means there is a greater than 66% chance that climate sensitivity falls within that bar. The longer, thinner bar means there is a greater than 90% chance climate sensitivity falls within that range. When you think about it, it makes sense that there is a greater chance (eg - very likely) that climate sensitivity falls within the wider range of values. -
BonIver at 08:52 AM on 9 December 20101934 - hottest year on record
"Globally, the ten hottest years on record have all occurred since 1998, with 2007 as the hottest." Shouldn't that say 2005, not 2007? -
Geo77 at 08:49 AM on 9 December 2010The Scientific Guide to Global Warming Skepticism
Bob Guercio @13- This is a laypersons understanding of the night/winter issue, so please excuse and correct any misstatements or misconceptions, but I'll give a try at explaining my understanding as maybe we are on a similar level scientifically. Think about daytime being when the earth absorbs heat from the sun and nighttime as when heat is radiated back out through the atmosphere. That's why it's almost always coldest in the early morning just before dawn after an entire night of losing heat. The warming effect of CO2 is related to how it interferes with the heat radiating back out through the atmosphere. Since there is more radiating of heat during the night it is the nighttime temperatures that will be most affected by the increasing CO2. Although I'm sure there is some radiation of heat occurring during the daytime, I imagine it must be less because the gradient in the temps between the earth and the atmosphere is less than at night. Also the temperature moderation during the daytime from radiating heat would be relatively small compared to the temp moderation driven by heat absorption. With regards to winter temps I think the concept would be the same since you have less insolation, longer nights etc during the winter so the effect of the CO2 would show up more. One question that occurs to me from writing this up is why doesn't CO2 have an equal effect in blocking the heat coming into the earth as it does on blocking the heat leaving? My guess is it has to do with the radiation coming in (sunlight) being of different wavelengths compared to the heat radiation going out. -
RSVP at 08:41 AM on 9 December 2010The human fingerprint in the seasons
Cris G wrote the following... "take to mean that you think there is a limit to how hot CO2 can get." based on my comment 79, which contained... "Given that water vapor has double the heat capacity of CO2, and abounds in excess of 100 times the anthropogenic contribution in CO2, this retained "energy" you are talking about represents at most 0.5% of the total ambient. I suppose that is energy, but it doesnt seem like much. " From this I can only "take to mean" you did not read what I wrote. -
muoncounter at 06:56 AM on 9 December 2010The human fingerprint in the seasons
#141: "Yet the Arctic had a higher amplification than current, this would be very strong evidence" That's not really strong evidence. Look here for a more thorough discussion of arctic amplification than in the Chylek paper you reference. We also said here that the early 20th century warming had a different cause than the current warming; why would expect the same responses? -
keithpickering at 06:53 AM on 9 December 2010The Scientific Guide to Global Warming Skepticism
For the next edition, I would also add Human Fingerprint #8: Decreasing atmospheric O2, caused by the burning of fossil carbon. If the increase in CO2 had come from natural sources, O2 would not be decreasing by similar amounts. Langenfelds et. al. (1999), GRL 26:13, 1897-1900.Response: That is mentioned in passing on Page 1 on the 'Human Fingerprints on Climate Change' graphic but there were only so many green box Human Fingerprints I could fit into the rest of the Guide. If we ever do an "extended edition", I'll get the opportunity to flesh out more fingerprints. -
dhogaza at 06:37 AM on 9 December 2010The Scientific Guide to Global Warming Skepticism
For some reason, I'm having trouble really understanding why nights warm faster
Thinking about it as why nights cool more slowly helps, maybe, since the cooling all takes place through the radiation of LWIR? -
Riccardo at 05:10 AM on 9 December 2010How Jo Nova doesn't get the tropospheric hot spot
Schnorkel dismissing a complex issue with innuendo brings us nowhere. You can find a good historical perspective here. -
RMCPiper at 04:59 AM on 9 December 2010The Scientific Guide to Global Warming Skepticism
Oops. Not "online newspaper readers" but "online newspaper commentators". -
RMCPiper at 04:58 AM on 9 December 2010The Scientific Guide to Global Warming Skepticism
Thanks. I've been working on the issue for several years but probably reaching the wrong audience, online newspaper readers, most of whom are repetitive ideologically-driven trolls. Fortunately, your document is clear enough that perhaps even the politicians might understand and they are my current target. I won't try to convince the MP for my riding in Canada, John Baird who is probably the worst possible choice for the job in our parliament. At the COP15 in Bali when he had the substantive role rather than the current "temporary" one, he left a high-level meeting and was seen minutes later drinking a cocktail at a party. There is no way that he's getting my vote. But it appears very likely that votes alone won't help us to deal with the issue. I guess that it's time to "get in their faces". -
Phila at 04:52 AM on 9 December 2010A Cloudy Outlook for Low Climate Sensitivity
Arkadiusz Semczyszak @108, It would be helpful if, instead of simply posting quotes from papers, you provided some context or explanation for them. What point are you trying to make? -
Bob Guercio at 04:45 AM on 9 December 2010The Scientific Guide to Global Warming Skepticism
Folks, I have a technical question related to the guide. I don't mean to say that the guide is incomplete; it's just that I would like more information for myself. The guide, as is, is perfect. For some reason, I'm having trouble really understanding why nights warm faster than days and winters warm faster than summers. For some reason, understanding this is eluding me. Thanks, BobResponse: I am intentionally brief about those fingerprints in the Guide, acutely aware that you can't fit everything into a single guide without it bloating to unwieldy proportions. Fortunately, I have a blog to flesh out the details and in anticipation of these kinds of issues, I'd even already gone into more detail about the daily and annual cycle (my original plan was to have blog posts about all the human fingerprints before the Guide came out but well, I'm just not that well organised):
The human fingerprint in the daily cycle
During the day, the sun warms the Earth's surface. At nighttime, the surface cools by radiating its heat out to space. Greenhouse gases slow down this cooling process. This is why deserts cool so much at night. Water vapour is a strong greenhouse gas and the dry desert air traps much less heat than more humid areas. A more extreme example is the moon which has no atmosphere. At nighttime, there are no greenhouse gases to trap the outgoing heat. Consequently, the difference between day and night is more extreme with daytime temperatures getting up to around 118°C and nighttime temperatures falling below -168°C. In other words, the stronger the greenhouse effect, the smaller the difference between daytime and nighttime temperatures.
The human fingerprint in the seasons
During summer, a region receives more sunlight and warms. During winter, the region receives less sunlight and cools by radiating heat to space. Greenhouse gases stop some of this heat from escaping to space so an increased greenhouse effect slows down the winter cooling. Consequently, if greenhouse gases are causing global warming, we expect to see winters warming faster than summer. -
Phila at 04:44 AM on 9 December 2010A Cloudy Outlook for Low Climate Sensitivity
Camburn @64 1. Statistically, and this is important unless you want to throw statistical analysis out with the wash, we have not warmed for the past 15 years. "Because the temperature has random ups and downs on top of the long term warming trend, you need about 16 years to conclude (with 95% confidence) that a trend in those 16 years is not a result of chance. So if the only temperature data we had was 1995-2009 (15 years!) we couldn't conclude with 95% confidence that there was a trend. But we also couldn't conclude...that there is no trend -- there simply isn't enough data for a firm conclusion. But we have more data than just 1995-2009, so we can conclude (with greater than 95% confidence) that there is a warming trend. "In fact, since we have data for 2010 now, it is even now true that we have statistically signficant warming since 1995." I'd like to join archiesteel in asking you to acknowledge your error. -
Albatross at 04:41 AM on 9 December 2010The human fingerprint in the seasons
Norman @148, Thanks for clarifying. I must still, however, agree the assessments made by CBDunkerson and others. I might take issue with the John Cook using the dichotomy of the tropics and poles-- maybe he meant to discriminate between the tropics and high latitudes. The northern mid-latitudes have also been warming more in the winter than in the summer. -
muoncounter at 04:36 AM on 9 December 2010How Jo Nova doesn't get the tropospheric hot spot
#29: "Gee, I think I understand ..." Might be easier to understand if you actually read the post before commenting. the hot spot is not caused by the greenhouse effect. In fact, we expect to see an amplified warming trend in the troposphere no matter what's causing the warming. ... Detecting the tropospheric hot spot is not a test of the greenhouse effect but of the moist adiabatic lapse rate. Most folks would agree that its better to do some research before forming opinions. SkS has a search feature; try it, you might like it.
Prev 2026 2027 2028 2029 2030 2031 2032 2033 2034 2035 2036 2037 2038 2039 2040 2041 Next


