


 Arguments


Recent Comments
Prev 2201 2202 2203 2204 2205 2206 2207 2208 2209 2210 2211 2212 2213 2214 2215 2216 Next
Comments 110401 to 110450:
-
Roger A Pielke Sr at 12:53 PM on 10 September 2010Pielke Sr and scientific equivocation: don't beat around the bush, Roger
zinfan94 Thank you for your further feedback. On your comment, "My bet is that there are problems with the Argo data being representative of the entire thermal energy accumulation in the oceans" Josh Willis has told me that an updated analysis will be available this Fall. If there are substantial remaining issues with the Argo data (and the satellite altimetry data also), we will find out then. -
HumanityRules at 12:40 PM on 10 September 2010Pielke Sr and scientific equivocation: don't beat around the bush, Roger
78.Dappledwater I don't think the identification of some faulty instruments in the system is necessarily a problem. The non-identification of such instruments is. I hope you acknowledge that Willis and others have actively sort these problem instruments and have corrected the data set on the basis of this. It still stands that Willis now believes the data set to be robust and unlikely to undergo anymore major corrections. -
John Chapman at 12:39 PM on 10 September 2010The Little Ice Age: Skeptics skating on thin ice
In support of a non-global event, pasted direct from Wikepedia: "The Intergovernmental Panel on Climate Change (IPCC) describes areas affected by the LIA: Evidence from mountain glaciers does suggest increased glaciation in a number of widely spread regions outside Europe prior to the 20th century, including Alaska, New Zealand and Patagonia. However, the timing of maximum glacial advances in these regions differs considerably, suggesting that they may represent largely independent regional climate changes, not a globally-synchronous increased glaciation. Thus current evidence does not support globally synchronous periods of anomalous cold or warmth over this time frame, and the conventional terms of "Little Ice Age" and "Medieval Warm Period" appear to have limited utility in describing trends in hemispheric or global mean temperature changes in past centuries... [Viewed] hemispherically, the "Little Ice Age" can only be considered as a modest cooling of the Northern Hemisphere during this period of less than 1°C relative to late 20th century levels.["Climate Change 2001: The Scientific Basis". UNEP/GRID-Arendal. http://www.grida.no/climate/ipcc_tar/wg1/070.htm. Retrieved 2007-08-02] Several causes have been proposed: cyclical lows in solar radiation, heightened volcanic activity, changes in the ocean circulation, an inherent variability in global climate." -
scaddenp at 12:32 PM on 10 September 2010The Little Ice Age: Skeptics skating on thin ice
No Daniel - I watch the subject with interest but it is outside my area of expertise. I have moments of wishing that I had specialised in quaternary geology - it certainly is fascinating. -
Daniel Bailey at 12:17 PM on 10 September 2010The Little Ice Age: Skeptics skating on thin ice
Re: scaddenp (12) Thanks for the update. Sounds like you have the makings and material for a SS post of your own on this. I, for one, would look forward to a review by you on it. The Yooper -
scaddenp at 12:04 PM on 10 September 2010The Little Ice Age: Skeptics skating on thin ice
thingadonta - "Your argument that 20th century warming post 1950 is based on tweaking model dials, can be untweaked if eg solar lag effects above are taken into such models. " This is simply not true and I dont think this discussion is improved by baseless assertions. There is a huge literature on model creation. Please show us where models are tweaked to fit a warming. Likewise, this detail of "lags". What makes you think that the underlying physics is missing from models? (Hint - how do think energy flows are calculated?). -
thingadonta at 11:52 AM on 10 September 2010The Little Ice Age: Skeptics skating on thin ice
A couple of points. -LIA and low solar activity shows a good correlation, meaning small changes in solar output are magnified, ie positive feedback, possibly by clouds. -At least 2 provable lag effects with regards to solar activity are known -daytime maximum T after highest solar output (around 25% lag time), and seasonal maximum T (again, around 25% after maxmum solar output). Applying 25% lag time to the solar output from 1700-1950 indicates maximum T around 2010-now. This explain the T increase since 1950 without much change form the sun, and should even continue to increase since solar output, unlike seasonal and daily effects,m hasnt declined much. Furthermore, the ocean is known to produce a longer lag effect on top of solar lag effects which apply to eg daily and seasonal effects, further enhancing/smearng out solar lag effects. Your argument that 20th century warming post 1950 is based on tweaking model dials, can be untweaked if eg solar lag effects above are taken into such models. Its interesting that you call the causes of LIA- a known event- as speculation, but something that hasnt even happened yet, projected T rises, this site calls their likely causes as solid as a rock! Have AGW proponents got their probabilities all mixed up? I think so. Moreover your comment •"Sudden population decreased caused by the Black Death may have resulted in a decrease of agriculture and reforestation of agricultural land. " is a bit of a fantasy. This is researchers reaching for a human effect where they cant find any, to bolster their paticular human-induced angle. T was dropping worldwide after MWP, and popluation worldwide was increasing. How this kind of thing can get a mention in line with a ball of variable nuclear reactions millions of time bigger than the earth, is beyond me. I think your discussion above is generally good/logical, but various parts/probabilities assigned will be shown to be misinterpreted/wrong in future years.Moderator Response: [Graham] You say " various parts/probabilities assigned will be shown to be misinterpreted/wrong in future years". OK - can I see your data on that please - or did you throw the tea leaves away? :) -
Pielke Sr and scientific equivocation: don't beat around the bush, Roger
Roger, on one thing we agree: It’s a good thing we have blogs (that’s what the kids are calling them) so that misstatements can be refuted. 1. a) You say, “First, I have never used the term instantaneous" in this context.” You used the term “snapshot,” said there was “no lag” and said there was no need to present it in the context of a trend. How my use of the term “instantaneous” to refer to a “snapshot” of a slowly varying quantity, presented as a point on a plot, misrepresents your position I do not know, but I’m sure you can elaborate. b) Did you even read the quote by Willis that you posted? He says his analysis is robust, not the OHC result itself. And he says, “Without cleaned up Argo and/or XBT data with reduced biases, I do not belive (sic) that we can actually say...” So even he doesn’t believe the ARGO data is problem-free. And if you poke around in the literature a bit, you’ll find that no one else does, either. Except, apparently, you. 2. You cite: “...below 3000 m in the global oceans, and below 1000 m in the southern ocean, the ocean is taking up an energy equivalent of about a 0.1 W/m^2 energy imbalance at the top of the atmosphere...” In other words, the ocean gained heat, in complete contradiction to your statement that global warming halted. 3. You cite: “...On average over the 5 year period (2003-2008), the steric contribution has been small (on the order of 0.3+/-0.15 mm/yr)...” In other words, the ocean gained heat, in complete contradiction to your statement that global warming halted. -
scaddenp at 11:33 AM on 10 September 2010The Little Ice Age: Skeptics skating on thin ice
Daniel, I chatted with one of the authors (Barrell) about it over morning tea. He was more hesitant - probably global, but there are many issues relating things like the Be10 timescale calibration, understanding regional ice patterns, etc. In short, a lot of work still be done before the situation is clearer. Interhemispheric connections will be a research topic for a long time to come. -
Alexandre at 11:32 AM on 10 September 2010Using Skeptical Science to improve climate literacy
Here in Brazil the Climate Change issue is not so polarized as in the US. No political party puts its reality in question, for instance. Even so, our press also has its moments of miseducation, be it deliberate or involuntary. In my amateur efforts to spread the present knowledge about the subject, I like to include: - regional projected climate change, as it relates more easily to the general intuitive understanding. - where our national emissions come from. - alternatives to emission and economic implications. -
MattJ at 11:21 AM on 10 September 2010Using Skeptical Science to improve climate literacy
The stigma Lee mentions, the stigma in the public's eye for being a "climate scientist", is a perfect example of why these workshops should have been started TWENTY YEARS AGO. Now it feels too much like closing the barn door after the horse has bolted. Still, it has to be done, even though now our descendants will receive far less benefit for it. -
Daniel Bailey at 11:19 AM on 10 September 2010The Little Ice Age: Skeptics skating on thin ice
Re: scaddenp (9), John Chapman (10) Surprisingly, I agree with Phil (thanks for reminding me of this study, Phil; I'd not had the pleasure of a fuller read of this one yet, so I really appreciate you bringing it to my attention again). I was able to locate a free copy of the study here. If you have a different take on this, let me know. From the text:Three main conclusions can be drawn. First, there is a notable interhemispheric disparity in the timing of the maximum ice extent. The Mount Cook glaciers were further advanced about 6500 years ago than at any subsequent time. In contrast, most Northern Hemisphere glaciers reached their greatest Holocene extents during the LIA (1300 to 1860 C.E.). Second, several glacier advances beyond the extent of the 19th century termini occurred in New Zealand during northern warm periods characterized by diminished or even smaller-than-today northern glaciers, such as between 7500 and 5500 years ago in the Swiss Alps (22) and Scandinavia (23), during the Bronze Age Optimum [about 1500 to 900 before the common era (B.C.E.)], during the Roman Age Optimum (200 B.C.E. to 300 C.E.), and during the MWP (800 C.E. to 1300 C.E.). Third, the greatest coherency between the Mount Cook and Northern Hemisphere records was during the Dark Ages (300 C.E. to 700 C.E.), and broad similarities were apparent during the past 700 years (the northern LIA), with multiple glacier advances followed by a general termination commencing in the mid- to late 19th century. However, northern Holocene moraine sequences are dominated by the LIA-maximum terminal moraine less than 400 years old (typically mid-19th century in the Swiss Alps and mid-18th century in Scandinavia), whereas the most prominent moraine of the past millennium at Mueller Glacier is about 570 years old and is followed inboard by several smaller moraines. This pattern of broad consistency but differing detail of glacier behavior has continued over the past 150 years. Our results are in accord neither with the hypothesis of interhemispheric synchrony of mid- to late Holocene climate change nor with a rhythmic asynchrony, downplaying the importance of global driving mechanisms. This includes solar irradiation changes translating quasi-linearly into near-surface climate. However, recent studies show that climate models driven by solar changes can induce regionally distinct temperature changes (26), and indeed the Mount Cook moraine chronology shows some similarities to the solar record [e.g., (26)]. ...our study shows that mid- to late Holocene glacier fluctuations were neither in phase nor strictly antiphased between the hemispheres, and therefore it is likely that regional driving or amplifying mechanisms have been an important influence on climate.
My take: While some of the moraine, tree and glacier data is consistent with the LIA being a global event, some is not, which the authors themselves note. However, while checking the cites on this one, I found this other study on glaciers in Peru with more robust findings (enough so I won't bother to waste the time to summarize). It does offer up some interesting rationale as to the why, which I'll leave for someone else to dig into, if they're interested. It was good enough to convince me. After reading this one, Phil, I am satisfied with your correction of me that the LIA was most likely a global event, albeit one with some localized temporal asymmetry. I was wrong in my original contention and appreciate being enlightened. I blame low blood-alcohol levels. :) The Yooper -
johnd at 11:13 AM on 10 September 2010Pielke Sr and scientific equivocation: don't beat around the bush, Roger
I'm not sure if this point has been already considered earlier or not, but whenever circulation of ocean waters is being examined with regards to the transport of heat, should this mechanism also be held as being the exact same means as CO2 is circulated. I cannot see as how a body of water could carry one without the other given both are absorbed and released at the surface, and the CO2 molecules themselves carry thermal energy. In addition is the release of a CO2 molecule also a means of transferring the thermal energy carried by the CO2 from the ocean to the atmosphere, as well as within the ocean itself? -
zinfan94 at 10:56 AM on 10 September 2010Pielke Sr and scientific equivocation: don't beat around the bush, Roger
Dr. Pielke - Yes, I agree on one point. If the Argo data is accurate, and if the upper mixed layers are not heating substantially due to transport of heat to deeper depths, this is a very favorable result because it would give us time to mitigate GHG driven AGW. I hope the Argo data is correct. However, the SLR data clearly show that thermal expansion of the oceans continues. This data is quite robust, and overturning observed SLR is quite unlikely. Far more likely is some problems with Argo measurements, and somewhat more likely is thermal flows into the deep ocean, or some combination of both. If the Argo data is correct, then sea levels should have already flattened. The fact that they haven't is a big problem with the hypothesis that Argo data measure all the heat absorbed by the oceans. If SLR was entirely due to ice melt, the GRACE data on Greenland and Antarctica ice melt is much too low, as well as topographic measurement of these ice sheets. It isn't likely that two different ice sheet measurement systems, which more or less agree with other, are both wrong. OTOH, if SLR was entirely due to thermal expansion, then the amount of heat being absorbed into the oceans is higher than 140 x 10^20 joules in your estimates. Therefore, clearly SLR is due both to thermal expansion and ice sheet melt. The other issue with SLR; the increase in SLR during El Nino periods is greater that La Nina periods, so some sort of thermal energy change in the mixed layer is occurring. Eli Rabett commented earlier on the large increases at certain periods in the OHC record, versus the relatively flat OHC from the preliminary Argo data. There does seem to be some evidence for large swings in the thermal energy stored in the upper levels of the ocean. The swings are larger than can be explained by exchanging heat into the atmosphere. So this is another problem with your hypothesis... My bet is that there are problems with the Argo data being representative of the entire thermal energy accumulation in the oceans. -
John Chapman at 10:45 AM on 10 September 2010The Little Ice Age: Skeptics skating on thin ice
My understanding from the literature is that the LIA was confined to northern Europe, and there is suggestion that it is linked to the behaviour of jetstreams in reponse to solar activity (sunspots). The same response that has been seen in the last few years while solar activity has been low. Jetstreams dipping, cold winters in Europe - but not in Alaska. If indeed it is accepted that the LIA was restricted then it deserves mentioning in the basic version post. -
scaddenp at 09:50 AM on 10 September 2010Climate change: Water vapor makes for a wet argument
Johnd - you do have it backwards. The solar radiation is 168 and the backradation is 324 - more than twice solar. I defy you to come up with some physics that can cause a molecule to move from liquid to gas without heating the liquid. Evaporation is physically limited and wind doesnt vary enough to change that. For global average, wind doesnt change much so evaporation losses are almost entirely tied to temperature. In terms of FORCINGS, wind etc is irrelevant. Change solar or change backradiation (put in more GHG) and evaporation will increase, but you cant change evaporation independently. -
Roger A Pielke Sr at 09:37 AM on 10 September 2010Pielke Sr and scientific equivocation: don't beat around the bush, Roger
zinfan94 - Thank you for your thoughtful comments. With respect to transport of heat to deeper depths that is not sampled, of course, this is possible. However, the thermocline mutes vertical transfers below that level, and most ocean vertical circulations cover a relatively large area and should be reasonably well sampled by Argo except in ice covered areas. If we accept, however, that heat has moved downwards but is not sampled, this is still in conflict with the multi-decadal climate model predictions that I am aware of. This heat also would not be likely available to quickly remerge from these deeper levels back into the atmosphere so as to directly affect weather features. -
johnd at 09:16 AM on 10 September 2010Climate change: Water vapor makes for a wet argument
KR at 08:33 AM, I'm not sure that I do have cause and effect reversed. Even though all processes occur at the very molecular surface of the water, the solar energy is of far greater magnitude than any back radiation, so the water would be responding immediately by evaporating and only any energy unused by that process then being absorbed by the body of water that then radiates at a rate depending on it's temperature. Evaporation however is dependent on more factors than merely solar radiation or ambient temperatures. It is highly dependent on wind. Whilst there may be limited information that has been collected from the surfaces of the oceans, very detailed information has been collected on land regarding evaporation, and evaporation rates that allows examination of exactly what order of influence each factor occupies, and ambient air temperature, or soil temperatures are not what evaporation responds most immediately to. The information on this link, http://www.bom.gov.au/products/IDV65176.shtml#notes, if followed over a period of time may allow greater understanding of where evaporation falls within the cycle of all events that attempt to achieve equilibrium in the global heat budget. -
adelady at 09:14 AM on 10 September 2010Ocean acidification isn't serious
Jim, they probably aren't gardeners. Gardeners fully understand more and less acidic/alkaline in relation to soils. Though I think it would be pushing it to propose an analogy based on blue and pink hydrangea blooms. -
zinfan94 at 09:14 AM on 10 September 2010Pielke Sr and scientific equivocation: don't beat around the bush, Roger
Dr. Pielke, I first should apologize for my previous comment deleted by the commentator. I am more used to the rather rough environment over on WUWT, and should have moderated my comments to a more civilized site. I want to address a couple of the three points you just presented. Point 1. regarded the ability of Argo to measure the heat flow through the upper mixed layer, and Point 2. discussed the possible heat flow into the deeper ocean. I am a chemical process engineer familiar with heat balances, so I took a look at the amount of heat that models claim should be heating the oceans. (BTW, I agree whole heartedly that we should be attempting to measure heat flows, not temperatures. The term global warming is unfortunate, because in reality the planet has been storing a lot of thermal energy, and has been for a long time. A better term would be planetary heating, not global warming.) In any case, the amount of heat that should be heating the oceans is about 100 to 140 x 10^20 joules per year. This is a lot of thermal energy, but not outrageously high. Thermal energy released by burning fossil fuels is about 4 x 10^20 joules, so this is about 25x to 35x the amount of heat from using fossil fuels. So lets examine the case where this heat is transported by a sinking column of seawater into the deeper ocean. If the seawater was 1.0 deg C warmer than upwelling water somewhere else in the ocean, it would only take a flow of about 3.3 cubic miles per minute of seawater to carry the "missing" amount of thermal energy into the deeper ocean. If the seawater was sinking at one foot per second, which is a reasonable estimate of velocity, then less than 300 square miles of the 139 million square miles of ocean might be involved in this sequestration of heat into the deeper ocean. Another way to express this, only slightly over 2 square miles out of each million square miles of ocean would be involved. It isn't very likely that the Argo system would be able to find and measure a thermal flow like this. If there were 1000 sites scattered around the ocean, each would have an average effective diameter of one kilometer; and even if an Argo float did pass through one of these areas, I am not sure the Argo is data processed in such a manner that we could identify the heat flow. I don't agree with your earlier assertion on this thread, that Argo would measure the heat passing through the mixed layer that ends up in the deeper ocean. Although these points are interesting, point 3. regarding the inconsistency between the Argo data and SLR is the key problem with your hypothesis. For some reason you don't want to accept that recent observations of SLR has put the metric roughly back on the same trend line as observed over the last 25 years or so (approximately 3 mm per year). Last year (June 30, 2009) you posted on WUWT that SLR had flattened. But once the 2009/2010 El Nino kicked in, the SLR resumed. Depending on how much SLR is due to land based ice melt versus thermal expansion of water, the SLR confirms that a significant amount of thermal expansion has occurred such that there must be significantly more ocean heating than the Argo data show. Clearly the SLR data is inconsistent with your interpretation of the Argo data. I agree with ocean heating being the key metric of the heating of the planet, but disagree that the Argo data is the best measure of that. Until proven, and until the conflict with SLR is explained, the SLR data seem a far better measure of the ocean heat buildup. -
kdkd at 08:56 AM on 10 September 2010Pielke Sr and scientific equivocation: don't beat around the bush, Roger
Dr Pielke seems to have admitted (in a round about way) that while theoretically, Joule imbalance is the best measure of global warming, on a practical level the measurement systems are not yet good enough to do so in a way that we can make strong conclusions from short time spans. I'm also releived that we're getting some explicit treatment of measurement uncertainty from Ken Lambert as well. -
Rob Honeycutt at 08:49 AM on 10 September 2010Pielke Sr and scientific equivocation: don't beat around the bush, Roger
NETDR... But by most analysis 1C is way down on the probability curve. The IPCC states between 1.5C to 6.2C with something around 3C being most likely. There is a good lecture on Youtube by Dr Richard Alley called "Taming the Long Tail of the Distribution" that is well worth watching. If you are using 1C as the basis of your position then you logically need to place equal weight on the potential for 7C or better. IMO it would be foolish to toddle along assuming 1C with uncertainty as high as it is. Better to plan for the 3C median with our eyes wide open for the long tail. -
Climate change: Water vapor makes for a wet argument
johnd - You have cause and effect reversed here. Solar energy is absorbed by the water, warming it, and then the warmer water increases it's evaporation rate, providing a negative feedback (limiting response) on the temperature rise of that water. You had that order backwards. And that water also emits IR (water being close to a black body spectrum emitter). Both the IR and latent heat in the evaporated water warm the air over the water, which emits IR in response - providing backradiation (positive feedback) to the water and limiting it's cooling via IR and evaporation. On the other hand, I completely agree that the changes in rates of various energy exchanges is of definite interest. We're an awfully long way away from boiling any oceans, though. Nobody is predicting that. -
johnd at 08:32 AM on 10 September 2010Climate change: Water vapor makes for a wet argument
Phil at 23:33 PM, you've got it all back to front. You being the bread winner puts in $168, as this is where all the money consequently saved or squandered originates from. The question then becomes do you first pay out on priorities such as utilities, $78 and food, $24, which ultimately are all forms of heat energy, leaving you to find $390 to pay your credit card bill, usually done by drawing a cash advance of $324 to make up the difference. As to who contributes how much for the presents, you would have to examine your credit card statement to find out that given $40 went as interest, you are left with nothing for presents. There must be some interesting discussions at your house each pay day. ;-) -
NETDR at 08:27 AM on 10 September 2010Pielke Sr and scientific equivocation: don't beat around the bush, Roger
RE: J Murphy 91 Catastrophic AGW is what it sounds like. [CAGW] Human caused warming with consequences so dire that we must take actions which will damage our economy seriously to avoid it. This is to distinguish it from simple AGW which may or may not be true but is a scientific not a political question. If the temperature will rise 6 ° C in 100 years the prudent action would be different from that taken if the temperature were to increase 1 ° C in 100 years. Many people, like myself, believe CO2 is a GHG and we are emitting CO2 so we must be causing some warming. In that respect we believe in some AGW but not in raising energy prices so high we damage our economy and sending jobs overseas where ironically it would increase CO2 emissions. Shoot ourselves in the foot and complain about the pain ? Develop alternate energy, that is obvious. Remove soot too. Wreaking our economy makes no sense unless CAGW is real and imminent. Without positive feedbacks CO2 will only cause 1 ° C for a doubling in 100 years. Which is no crisis. The sense of crisis comes from models which amplify this tiny warming by purported positive feedback which starts tomorrow. -
johnd at 08:08 AM on 10 September 2010Climate change: Water vapor makes for a wet argument
MattJ at 08:37 AM, I agree entirely with you. The diagram is a rather simplistic depiction of the energy budget, and as with all budgets has to be twigged to balance. What is doesn't do is represent the order of the processes and which processes may have priority over others. That is if heat is being transferred, which process facilitates a slow transfer and which may ramp up as the rate increases and are able to handle excess amounts of energy. Which may ramp up as others are ramping down, still maintaining the nett balance. Earlier on I asked for what I termed a critical path chart. That was using terminology from another discipline and I'm not sure whether such a depiction even exists for this subject of heat transfer given it was only the energy budget diagram that was presented. When solar energy is absorbed by water, I believe that evaporation occurs first and only any excess energy is absorbed by the body of water, thus the evaporation process is primarily a function of direct solar radiation and secondarily of the thermal energy that is stored in the body of water. This can be readily observed in practice where water that is open to the atmosphere AND in direct contact with solar radiation evaporates at a far greater rate than water that is also open to the atmosphere but shaded from direct solar energy. In the case of water being heated by any form of heat, even a immersion heater, as the temperature of the water rises, evaporation and the radiation off of heat both occur, however as the water reaches boiling point it becomes clear that the ultimate determinate of how much heat the water is able to absorb is not the radiating off of heat, but the evaporation process. When the day comes that an equivalent to a solar hot water heater has been developed that works by passively absorbing back radiation, then perhaps we can revisit the topic again from a new perspective. -
Rob Painting at 08:03 AM on 10 September 2010Pielke Sr and scientific equivocation: don't beat around the bush, Roger
KL @ 81 - "Dr Pielke should clarify this point and perhaps comment on my suggested 'ideal' gold standard OHC measurement system of globally tethered buoys all reporting at the same time." Seriously KL, do you think buoys tethered to the deep ocean floor has not already been suggested by the experts?. Future observations for monitoring global ocean heat content Note the names that appear at co-authors, they should sound familiar: M. Palmer , J. Antonov , P. Barker 3, N. Bindoff , T. Boyer, M. Carson,, C. Domingues, S Gille P Gleckler, S. Good, V. Gouretski, S. Guinehut, K. Haines, D. E. Harrison,, M. Ishii G. Johnson, S. Levitus, S. Lozier, J. Lyman, A. Meijers, K. von Schuckmann, D. Smith, S. Wijffels and J. Willis. "In order to close the energy budget of the Earth’s climate we must move to an observing system capable of measuring the global ocean in its entirety. Despite the improved data coverage associated with Argo, the deep (> 2000m) and ice-covered ocean remain largely un-observed. Currently, the only full-depth ocean observations come from the dedicated hydrographic cruises, which can only sample a very small area of the deep ocean. In the future, these hydrographic cruises must be augmented by an array of deep floats, moored instruments, gliders, or a combination thereof to allow a true global integral of ocean heat content from the surface to the sea floor." -
scaddenp at 07:23 AM on 10 September 2010The Little Ice Age: Skeptics skating on thin ice
Daniel, I have to disagree with you on this one about evidence for LIA as a global event. MWP wasnt but I think there is pretty good evidence that LIA was. (eg High-Frequency Holocene Glacier Fluctuations in New Zealand Differ from the Northern Signature -
DrTom at 07:14 AM on 10 September 2010Pielke Sr and scientific equivocation: don't beat around the bush, Roger
Aloha All. Oceans and landmasses, including mountains are, to the earth, roughly equivalent to the thickness of the skin of an apple. Physical measurement...each smaller at scale than an atom of that skin, or even the gross measurements available from extant satellites cannot always provide sufficient information to make arguments unequivocal - which is why there is a disagreement. Haloclines and thermoclines are continuously variable. The oceans are dynamic. Whether we understand our planet sufficiently to be able to say we are 'missing' heat seems to beg the question: Do we now know everything to a sufficient degree to be able to make that assertion, or is it more likely that we are missing a connection somewhere? We shouldn't need to frame our arguments around this level of specificity. We can look for connections outside our disciplines to guide us. I suggested a non-specific hypothesis to my post-doc group in response to a peak-oil question here: http://drtom.posterous.com/is-there-anything-we-can-do-about-peak-oil-an Warning: I use that blog to vent and nothing is sacred to me. Wandering past that particular post will almost certainly land you somewhere you don't want to be. For the sanity of those who do not want to take the chance, here is the nutshell version: Every degree of atmospheric warming increases the amount of water vapor by ~5% which directly affects the hydrological cycle which directly affects everything else on the planet. The increased water vapor is not measurable everywhere because the atmosphere is dynamic as well. But that doesn't mean it is missing. The effects are certainly observable. The weather is changing rapidly and radically. Like Morton salt used to advertise, "When it rains, it pours". Hurricanes are now much more likely to be category 5 than ten years ago. That is not because anything is missing. It is because something has been added. In a possibly unrelated event, someone must have put WAAAAY too much Fluoride in the D.C. water supply because a lot of people there are getting wonky too. (sorry) I don't care whether anyone finds the missing heat. One second of rational thought tells us that nothing is 'missing'. Simply because we cannot find what we think should exist in the place we expect to find it does not make the case for 'missing' - unless the case is for missing knowledge. Physical laws are not always complete but they don't go missing. I care that the improperly framed 'missing' argument is being extrapolated to 'prove' two different conclusions, both based upon insufficient data. Let us cut to the chase. The biosphere is warming. Therefore the oceans are warming. We are entering a rapid-onset warming event which will manifest itself in years, not decades. Past rapid-onset warming events have ALWAYS become mass-extinction events. What if this one is too? We can only prepare for it if we accept the possibility it can occur. This is like no other time in terrestrial organic history. We can err the right way and lose nothing but we can no longer argue that we have time left. We are out of time. The weather has already changed - we are no longer 'forcing' it. We are off that cliff already. The arctic will be ice-free by 2020. That ice is already floating so the sea level won't rise. But it is melting for a reason. -
RobertS at 07:12 AM on 10 September 2010How we know the sun isn't causing global warming
I realize my #2 is oddly worded. I guess my brain got ahead of my fingers... 2) Even if a periodic component does exist (solar or otherwise), its magnitude must be so small as to render it nearly undetectable considering many "cycles" were missed altogether during the last glacial, and so-called Bond events are virtually nonexistent in the temperature record. Several authors (Rahmstorf, Alley, Ganopolski) argue for the use of stochastic resonance in modeling D-O events, whereby this very weak signal is greatly amplified by noise in the system to push the climate over a particular threshold in a glacial state. -
Albatross at 06:44 AM on 10 September 2010Pielke Sr and scientific equivocation: don't beat around the bush, Roger
Current global sea-level data: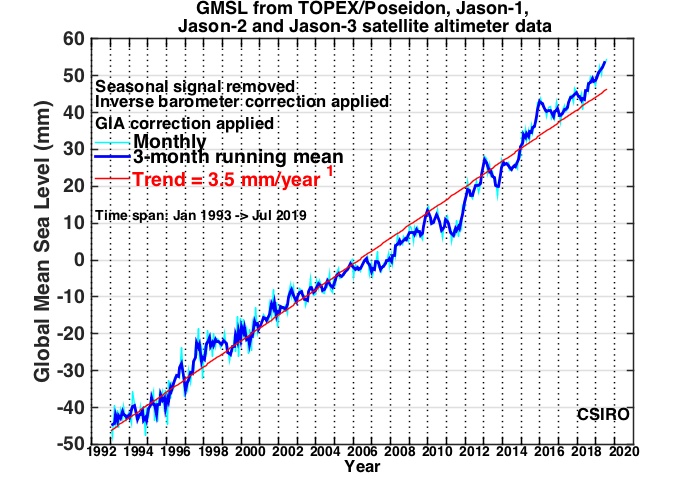
-
John Hartz at 06:33 AM on 10 September 2010Pielke Sr and scientific equivocation: don't beat around the bush, Roger
On the lighter side... If I tell someone that he/she is only human, is that an "ad hominem" comment? -
Roger A Pielke Sr at 06:30 AM on 10 September 2010Pielke Sr and scientific equivocation: don't beat around the bush, Roger
CBW - It is good that there are now weblogs so that misstatements such as you have made can be refuted. You write 1. "Pielke claims that ARGO presents accurate instantaneous snapshot of OHC, despite ARGO saying it doesn’t" First, I have never used the term instantaneous" in this context. Since ocean heat changes relatively slowly on larger scales, time slices can use monthly averages, for example. In the context of the robustness of the OHC data, below is what Josh Willis wrote to Kevin Trenberth, as I reported in my weblog post Further Feedback From Kevin Trenberth And Feedback From Josh Willis On The UCAR Press Release http://pielkeclimatesci.wordpress.com/2010/04/19/further-feedback-from-kevin-trenberth-and-feedback-from-josh-willis-on-the-ucar-press-release/ "Hi Kevin, I’m not sure why you think that the analysis methods of recent ocean heat content estimates are not robust. Since about 2005, most any analysis method that makes use of the Argo data should get approximately the same answer, which is that there is little net warming over this period. In fact, I have verified that my estimate compares well with Karina’s between 2005 and the end of 2008, even though she integrates to 2000 m and I only integrate 900 m. In the early part, however, the von Schuckmann analysis is problematic because it definitely contains some Argo data that still had pressure biases, and because they relied on a climatological background field that was probably too cold. Because the early part of the Argo record (pre-2005) has large gaps, their analysis relaxes toward the cooler climatology in the early part of the record. This has the potential to make the global trend appear larger than it may actually be. Without cleaned up Argo and/or XBT data with reduced biases, I do not belive that we can actually say that the satellite data in recent years are more reliable than the ocean heat content estimates." 2. "Pielke denies that any substantial mixing with deeper ocean could have occurred during those 4 years despite evidence that 2000m trend differs from the 700m trend, and despite a very incomplete human understanding of total ocean circulation." This is what Josh Willis wrote as I reported in my post Further Feedback From Kevin Trenberth And Feedback From Josh Willis On The UCAR Press Release. http://pielkeclimatesci.wordpress.com/2010/04/19/further-feedback-from-kevin-trenberth-and-feedback-from-josh-willis-on-the-ucar-press-release/ "Hi Kevin and Roger, Incidentally, you two might be interested in this recent paper by Sarah Purkey and Greg Johnson: http://www.pmel.noaa.gov/people/gjohnson/Recent_AABW_Warming_v1.pdf They looked at the prospect of deep warming on decadal time scales using the sparse, but highly accurate repeat hydrographic sections and found that below 3000 m in the global oceans, and below 1000 m in the southern ocean, the ocean is taking up an energy equivalent of about a 0.1 W/m^2 energy imbalance at the top of the atmosphere. So while this is significant, it suggests to me at least that the deep ocean is probably not taking up a bunch of heat really rapidly and the traditional idea that most of the action is in the upper several hundred meters is probably going to hold up. (did I get that right, Greg?) Cheers, Josh" 3. "Pielke rejects other evidence, particularly sea level data, that OHC continued to increase unabated." Regarding sea level rise, it has reduced in recent years, according to the peer reviewed paper below. Moreover, the rise that has occurred is not from thermal expansion (i.e. the steric component). Cazenave et al. Sea level budget over 2003-2008: A reevaluation from GRACE space gravimetry, satellite altimetry and Argo. Global and Planetary Change, 2008; DOI:10.1016/j.gloplacha.2008.10.004 they write "From the results presented in this study, we see that confronting independent estimates of ocean and land contributions to sea level with altimetry results leads to a rather coherent picture for recent years variations. This can be summarized as follows: since 2003, sea level has continued to rise but with a rate (of 2.5 +/-0.4 mm/yr) somewhat reduced compared to the 1993-2003 decade (3.1+/-0.4 mm/yr). Over 2003-2008, the GRACE-based ocean mass has increased at an average rate of ~1.9 mm/yr (if we take the upper range of possible GIA corrections as recommended by Peltier, submitted for publication)......The steric sea level estimated from the difference between altimetric (total) sea level and ocean mass displays increase over 2003-2006 and decrease since 2006. On average over the 5 year period (2003-2008), the steric contribution has been small (on the order of 0.3+/-0.15 mm/yr), confirming recent Argo results (this study and Willis et al., 2008).” I discuss this is my post Sea Level Budget over 2003–2008: A Reevaluation from GRACE Space Gravimetry, Satellite Altimetry and Argo by Cazenave et al. 2008. http://pielkeclimatesci.wordpress.com/2009/01/07/sea-level-budget-over-2003%e2%80%932008-a-reevaluation-from-grace-space-gravimetry-satellite-altimetry-and-argo-by-cazenave-et-al-2008/ -
Jim Prall at 06:25 AM on 10 September 2010Ocean acidification isn't serious
They seem to be relying on a simplistic reading of the terminology, where "only pH below 7 is 'acidic'" to support a serious fallacy--that by implication, any pH over 7 must be fine, even if it is falling fast The problem is that any significant change in pH affects biological systems and the solubility of the basic building blocks like CaCO3. There is no magic threshold at pH = 7.0 other than a semantic one; for a biochemist, nothing special happens crossing that line. Changing pH from, e.g. 8.3 to 8.2 has a real, tangible effect on the solubility of CaC03, and on the equilibria between CO2(aq), H2CO3, and HCO3[-1]. These changes alter the "saturation horizon"--the depth at which CaCO3 is saturated, and that has a vital effect on organisms that form hard carbonate shells. There are ecological impacts to any substantial change in pH, whether the starting point is 8.3, 7.9, or 7.001. Arguing that lowering pH substantially "isn't acicification" is just debating semantics, and certainly walks and quacks like a diversion tactic. If we need some evidence that working oceanographers don't have a problem with calling current changes from 8.3 to 8.2 "acidification," we need look no further than the Monaco Declaration on Ocean *Acidification* signed by 155 experts in the field: http://www.ocean-acidification.net -
eveningperson at 05:23 AM on 10 September 2010The Little Ice Age: Skeptics skating on thin ice
The anecdotal evidence about frost fairs in London is very charming, and a staple of 'sceptic' discourse, but if the Wikipedia entry is to believed the river froze over significantly only a few times a century and that is counting winters when it 'more or less' froze over so presumably would not have supported people, stalls and games. And a painting is cited as if it were evidence of a commonplace phenomenon, when it is at least as likely that it was painted because the scene was so unusual and therefore worth commemorating. Other rivers in southern England have also frozen over, the Severn for example ca 1883 and possibly also in the 20th century (I'd really like to find some comparative figures). What happened with the Thames in the 19th is that the old London bridge, with its narrow arches that restricted flow, was demolished, and also the river was given embankments and made much narrower. So not only does it flow faster now but it presumably is more saline that it used to be in the stretch that froze over (it is tidal way above central London). One of the things about many sceptics (Watts notably) is that they are shameless in their use of anecdotal evidence, exactly like homeopaths and other pseudomedicine practitioners. -
Pielke Sr and scientific equivocation: don't beat around the bush, Roger
MrJon - Your phrasing here is excellent, and captures the realities of the data uncertainties. It won't tweet well, sadly, but it's excellent. I recall part of Steve Schneider's last TV appearance, talking to a room of climate skeptics, where he discussed scientific credibility. He stated: "Anybody who's got the answer almost certainly is not credible on a complicated problem ... I think the best guide for you is when there's a complex problem remember you can break it down into well established bits where we do have some things that are very likely, competing explanations like Greenland is melting but exactly why, we don't know why, and speculative we really don't know what's the cloud feedback amount going to be and when people talk like that they're much more likely to be credible when they tell you that they have, you know, the smoking gun that proves or disproves, very rarely in complex science is that true." (emphasis added) -
RobertS at 05:16 AM on 10 September 2010How we know the sun isn't causing global warming
"Bond et al. (1999) added further evidence that the timing of D-O events disqualifies them from being responsible for the current warming, by showing that the most recent D-O event may have contributed to the Little Ice Age (LIA):..." I'm not a huge fan of this paragraph. Bond 1999 actually concludes"Finally, if we are correct that the 1-2 kyr cycle is a persistent feature of climate, at least in the North Atlantic, then one conclusion seems inescapable. Independent of any anthropogenic forcing, the North Atlantic's climate eventually will shift (or in fact may be shifting now) toward the warm phase of the cycle"
Suggestions: 1) Several recent papers have challenged the idea that D-O events are related to a underlying periodic forcing (published post Rahmstorf 2003); e.g. http://journals.ametsoc.org/doi/pdf/10.1175/JCLI3437.1 http://www.clim-past.net/3/129/2007/cp-3-129-2007.pdf 2) Even if a periodic component does exist (solar or otherwise), its magnitude must be so small as to render it nearly undetectable. Several authors (Rahmstorf, Alley, Ganopolski) argue for the use of stochastic resonance in modeling D-O events, whereby a very weak periodic forcing couples with strong noise to push the climate over a particular threshold in a glacial state. Something we have not observed to occur with much severity or regularity in the Holocene. -Robert S -
CBDunkerson at 05:09 AM on 10 September 2010Ocean acidification isn't serious
Jim Prall #7, you think the hysterics over 'acidification' are bad? I just had a 'skeptic' (who was cited in the Cuccinelli vs Mann case) very determinedly telling me that the oceans are NOT becoming more acidic. Rather, they are becoming less alkaline. I suppose I should just be thankful that they have some grasp on reality... even if they refuse to allow words to hold their traditional meanings. -
Pielke Sr and scientific equivocation: don't beat around the bush, Roger
What we have: 1. Pielke claims that ARGO presents accurate instantaneous snapshot of OHC, despite ARGO saying it doesn’t:“Seasonal and interannual variability dominate the present 6-year globally-averaged time series. Sparse global sampling during 2004-2005 can lead to substantial differences in statistical analyses of ocean temperature and trend (or steric sea level and its trend, e.g. Leuliette and Miller, 2009).”
and“Global coverage is essential, but for global change applications, Argo data must also have high accuracy and minimal systematic errors. Therefore, a high priority for Argo is to continue work aimed at identifying and correcting pressure measurement errors, especially those with systematic impacts.”
2. Pielke denies that any substantial mixing with deeper ocean could have occurred during those 4 years despite evidence that 2000m trend differs from the 700m trend, and despite a very incomplete human understanding of total ocean circulation. 3. Pielke rejects other evidence, particularly sea level data, that OHC continued to increase unabated. All to support an assertion that something on the order of 5x10^21 Joules/year of average annual heating that prevailed since 1970 suddenly stopped in 2004 for no discernable reason. That conclusion is stretched far beyond the breaking point. I am struck by the concluding paragraphs of the Willis “eureka” article:“If there is a moral to this story, it’s that when it comes to understanding the climate system, it’s hard to imagine too much redundancy. Every scientist involved in these studies says the same thing: to understand and predict our climate and how it is going to change, we need it all. We need multiple, independent, overlapping sets of observations of climate processes from space and from the Earth’s surface so that we can create long-term climate records—and have confidence that they are accurate. We need theories about how the parts of the Earth system are related to each other so that we can make sense of observations. And we need models to help us see into the future. “Models are not perfect,” says Syd Levitus. “Data are not perfect. Theory isn’t perfect. We shouldn’t expect them to be. It’s the combination of models, data, and theory that lead to improvements in our science, in our understanding of phenomena.”
Of course, when they say “[e]very scientist involved in these studies” they mean “every scientist except Roger Pielke Sr., who believes he can do it all with a single imperfect data set spanning four years.” -
John Hartz at 05:00 AM on 10 September 2010Pielke Sr and scientific equivocation: don't beat around the bush, Roger
My apologies for the double post. I thought my initial post did not go through because of the URL I had embedded in it. -
The empirical evidence that humans are causing global warming
T2000 - regarding your comments on these 10 points: 1) We know the amount of CO2 we're generating. The enhanced amount of CO2 in the atmosphere is found through direct measurements, and indicates that ~half the human generated CO2 amount remains in the atmosphere. That limits ocean exchanges. 2) Supporting point for 1, see comments for 1. 3) Known, measured increases in CO2, from 280 around 1850 to 380 now. 3) Supporting evidence related to 1, 2, etc., your comment on 'circumstantial' is incorrect. 5) The key is "at the precise wavelengths which CO2 absorbs", which your comment doesn't include. Decreased energy at CO2 wavelengths, along with increased energy elsewhere (from higher surface temperatures), is exactly what is expected with greenhouse heating. 6) Known and measured downward radiation, exactly as expected due to the physics involved, and with measured temperature increases from multiple data sets and independent instruments. 8) Actually, CO2 traps energy, meaning that stratospheric cooling is just what is expected - and measured. The mean CO2 radiation altitude is only 6km. 9) Warming troposphere means expanding troposphere, increasing tropopause height. It's a sign of warming no matter what the cause, but when tied to stratospheric cooling it's a fingerprint of greenhouse gas heating. 10) Your relevance in this comment? Ionospheric shrinkage is congruent with CO2 heating. All of these observed signs accompanying global warming are consistent with increased CO2 leading to an enhanced greenhouse effect. If you feel that some other cause is responsible for the warming trend over the last 150 years, in particular the last 35, then by all means I would love to hear your suggestion. However, you would need to supply both a different cause matching these fingerprints AND some reason why the CO2 enhanced greenhouse effect due to measured CO2 levels is NOT happening. So - two new things to believe in (one of which, CO2 not having an effect, is contrary to physics), versus one known change having predicted effects? I think I'll stay with the CO2 hypothesis... -
Yvan Dutil at 04:50 AM on 10 September 2010How we know the sun isn't causing global warming
One point to mention. Some astrophysicist are trying very ahrd to understand the interaction between the Sun and the Earth climate. This is why they are asking for grant and are paid. In consequence, they have no reason to dismiss the importance of greenhouse gases. Nevertheless, their studies indicate that the sun impact, while be real is not the cause of the actual climate change. By the way, the sun-climate relationship as been studied astronomers way before the impact of greenhouse gases was understood. Herschel speculated in 1801 that when the sun was highly spotted, it “may lead us to expect copious emission of heat and therefore mild seasons,” while few spots suggested “spare emission of heat” accompanied by “severe seasons”. In order to test his speculation that the observed changes on the sun might affect climate, Herschel turned to records of the price of wheat in England as a proxy for climate, because meteorological measurements were lacking. Herschel imagined that costly wheat would result from “severe seasons,” while the “mild seasons” would moderate the price of wheat. Herschel found in records of wheat prices support for his speculation—five lengthy periods of few sunspots were tied to costly wheat. -
John Hartz at 04:47 AM on 10 September 2010Pielke Sr and scientific equivocation: don't beat around the bush, Roger
Kudos to Dr. Pielke for posting on this comment thread. Both he and the author of the article should apologize to each other for being human and making disparaging remarks about each other. Unfortunately, the hard-core members of the Anti-AGW spin machine will never read this thread and will not benefit from it. Most of them belong to the "I've made up my mind, don't confuse with the facts" school of thought. To the anti-AGW crowd, this website is anathema and is an integral part of a "grand conspiracy." Some questions and a suggestion from a layman who wants to learn more about the topic of discussion, i.e., the measurement and distribution of the heat content of the oceans. 1. Where does the heat content of the upper layer of the Pacific go when an El Nino event dissipates? Does this heat transfer occur entirely within the boundaries of the upper layer being measured by the Argos buoys? 2. Where does the heat content come from when an El Nino event builds up? Does this heat transfer occur entirely within the boundaries of the upper layer being measured by the Argos buoys? 3. Is heat transfer the primary driver of the major ocean current systems? NOAA’s computation of the "Annual Global Oceanic Heat" has a considerable amount of statistical noise associated with it. Judging from the above exchanges, it seems there is a ongoing debate about the actual width of the statistical noise band. Perhaps the National Research Council should appoint a special committee to examine this issue. -
T2000 at 04:36 AM on 10 September 2010The empirical evidence that humans are causing global warming
Re 1: There is little doubt about the contribution of anthropogenic CO2 emissions. But our understanding of the natural CO2 cycles is insufficient to estimate the size of its contribution. We don’t know, for instance, the size of CO2 outgassing from the deep sea into the atmosphere and the return flux (order of magnitude: 100 – 150 GtC/y). The statement as such bears no relevance to an expected enhanced greenhouse effect by CO2. It is only suggestive, circumstantial evidence. Re2: Agreed. It would be surprising if this CO2 was not present. But see comment under 1 and its conclusion: The statement as such bears no relevance to an expected enhanced greenhouse effect by CO2. It is only suggestive, circumstantial evidence. Re 3: Of course, fossil fuel burning will use oxygen from the atmosphere. But again: The statement as such bears no relevance to an expected enhanced greenhouse effect by CO2. It is only suggestive, circumstantial evidence. Re 4: This is to be expected as under 2. But again: The statement as such bears no relevance to an expected enhanced greenhouse effect by CO2. It is only suggestive, circumstantial evidence. Intermediate general conclusion: Wight’s reasoning is so far exclusively based on circumstantial evidence. Not a single proof is presented that CO2 can affect the natural greenhouse effect. But we have to take a closer look at his additional arguments. Re 5: This observation is incorrect. Satellite measurements have shown that more total radiation energy has been transported into space. Re 6: It is, of course, to be expected that with increasing CO2 in the atmosphere, more radiation from it contributes to downward radiation at its specific wavelength. But that is no proof that it contributes to additional warming because the authors who claim such an effect, are insufficiently aware of physical forces other than radiation, which remove heat from the atmosphere (e.g., evaporation and forced convection). Re 8. This has nothing to do with the greenhouse effect in the troposphere. CO2 is a gas that goes higher up in the atmosphere than water vapour. Consequently, it facilitates the radiation out into space. Re 9: The altitude of the tropopause differs depending on latitude. It is low at the poles and high at the equator. It is determined by the vertical convection. When it rises, it is a sign of warming at the surface – not that this warming is caused by CO2. Re 10: The underlying reference states: ‘The increase in global surface air temperature during the 20th century has been attributed mainly to the increasing atmospheric concentrations of greenhouse gases.’ It states that it is ‘attributed’ to greenhouse gasses of which water is the most important one – not that CO2 is the cause. Conclusion The AGW hypothesis is still exclusively based on the fact that CO2 is absorbing and emitting infrared radiation in a narrow band and the expectation that this will enhance the greenhouse effect. Point 5 is not correct. The outgoing radiation increased by 2.6 per cent or 6 W/m^2. Points 6 to 10 can be explained today without attributing an enhanced greenhouse effect to CO2. Written by Arthur Rörsch http://fp.dagelijksestandaard.nl/2010/09/eindelijk-empirisch-bewijs-voor-menselijke-broeikashypothese/#more-101195 -
John Hartz at 04:29 AM on 10 September 2010Pielke Sr and scientific equivocation: don't beat around the bush, Roger
Kudos to Dr. Pielke for posting on this comment thread. Both he and Graham should apologize to each other for being human and making disparaging remarks about each other. Unfortunately, the hard-core members of the Anti-AGW Spin Machine will never read this thread and will not benefit from it. Most of them belong to the "I've made up my mind, don't confuse with the facts" school of thought. To the anti-AGW crowd, this website is anathema and is an integral part of a "grand conspiracy." Some questions and a suggestion from a layman who wants to learn more about the topic of discussion, i.e., the measurement and distribution of the heat content of the oceans. 1. Where does the heat content of the upper layer of the Pacific go when an El Nino event dissipates? Does this heat transfer occur entirely within the boundaries of the upper layer being measured by the Argos buoys? 2. Where does the heat content come from when an El Nino event builds up? Does this heat transfer occur entirely within the boundaries of the upper layer being measured by the Argos buoys? NOAA’s computation of the "Annual Global Oceanic Heat" content as plotted on the graph posted at: http://www.nodc.noaa.gov/OC5/3M_HEAT_CONTENT/ has a considerable amount of statistical noise associated with it. Judging from the above exchanges, it seems there is a ongoing debate about the actual width of the statistical noise band. Perhaps the National Research Council should appoint a special committee to examine this issue. -
Jim Prall at 04:12 AM on 10 September 2010Ocean acidification isn't serious
Also, lately I'm seeing frequent repetitions of the argument that ocean pH is still > 7 and so it is not "acidic", and that somehow precludes or invalidates use of the term 'Acidification' for lowering pH (even though this is perfectly valid and common scientific usage). Do we need to define this as a new "skeptic argument", or at least include a direct refutation of that move under this "it isn't serious" topic? -
Jim Prall at 04:09 AM on 10 September 2010Ocean acidification isn't serious
I got to wondering if anyone had estimated the numeric relationship between atmospheric CO2 concentration change vs. ocean pH change. The dots in the graph you show suggest the glacial-interglacial difference of 100 ppm corresponded to a pH variation of 0.2 units of pH, so about 50 ppm / (0.1 pH) A bit of searching in Google Scholar yielded: K Caldeira, ME Wickett - Nature, 2003 "Anthropogenic carbon and Ocean pH", cited by 499 http://crecherche.ulb.ac.be/facs/sciences/biol/biol/CaldeiraWickett2003.pdf A key finding of theirs is that large but slow pCO2 changes led to somewhat smaller final ocean pH response, thanks to geologic-scale "buffering" effects (top 1/4 of their figure 1(b)). However, over shorter time spans, "[w]hen a CO2 change occurs over a short time interval (that is, less than about 104 yr), ocean pH is relatively sensitive to added CO2" So, just how sensitive, I wondered? I tried to glean from their graph whether ocean pH response to changes in pCO2(atm) is basically linear or logarithmic (they don't state either way). The X axis of figure 1(b) is log (or semi-log?) while the vertical bands for each pH level are spaced about equally, suggesting a logarithmic relationship. If so, the response for a doubling of CO2 along the bottom of fig. 1(b) (i.e. over short, human-scale time spans relevant to ACC) looks like roughly 0.3 pH units per doubling of pCO2. I'd appreciate if others would review the article and see if my takeoffs make sense of what's there. -
werecow at 03:50 AM on 10 September 2010A detailed look at climate sensitivity
CBDunkerson: That makes sense. Thanks for clearing that up. -
CBDunkerson at 03:37 AM on 10 September 2010A detailed look at climate sensitivity
Werecow, yes the values for 'climate sensitivity' that the article describes are all predicated on the assumption of the current climate. Whatever the 'true' value is would not hold exactly the same after multiple 'doublings' of CO2 over a span of thousands of years. You may notice that most of the paleoclimate studies which attempt to figure out climate sensitivity are focusing on time periods where conditions were relatively close to those we have today. If sensitivity were a constant it wouldn't really matter what time period you looked at. That said, the single largest climate sensitivity factor we have identified is water vapor... and that is tied directly to temperature over a very wide range. Basically, this largest aspect of climate sensitivity wouldn't show significant variation unless the temperature got to the point where all water froze or all water evaporated. -
Roger A Pielke Sr at 03:33 AM on 10 September 2010Pielke Sr and scientific equivocation: don't beat around the bush, Roger
robhon - Thank you for your comments. With respect to changing metrics to diagnose global warming, if one elects, the global average surface temperature trend, of course, could be retained. However, we now have sufficiently robust analyses of the global annual average upper ocean heat content (since 2004 according to the experts, such as Josh Willis who work directly with this data) which permits us to adopt it as the primary global warming metric. This metric provides heat in its proper units - Joules, and the difference in heat content between time periods (i.e. the time slices) permits a diagnosis of the global annual average radiative imbalance in units of Watts per meter squared. Comparing the surface temperature trends and upper ocean heat content can itself be informative. In an earlier study Barnett, T.P., D.W. Pierce, and R. Schnur, 2001: Detection of anthropogenic climate change in the world's oceans. Science, 292, 270-274. http://pielkeclimatesci.files.wordpress.com/2010/04/barnett.pdf part of their conclusion reads "Perhaps the most important aspect of this work is that it establishes a strong constraint on the performance and veracity of anthropogenically forced climate models. For example, a climate model that reproduces the observed change in global air temperature over the last 50 years, but fails to quantitatively reproduce the observed changed in ocean heat content, cannot be correct." This was written in 2001 and applies even more so today since the upper ocean heat data is more accurate.
Prev 2201 2202 2203 2204 2205 2206 2207 2208 2209 2210 2211 2212 2213 2214 2215 2216 Next


