


 Arguments


Recent Comments
Prev 2215 2216 2217 2218 2219 2220 2221 2222 2223 2224 2225 2226 2227 2228 2229 2230 Next
Comments 111101 to 111150:
-
Ned at 02:13 AM on 2 September 2010Antarctica is too cold to lose ice
To answer Barney's question, no. Antarctica is experiencing a net loss of land ice. There is also a slight increase in Antarctic sea ice, but that's a different subject (and it's not caused by "cooling" in any case, since the southern ocean is actually warming). See Is Antarctica losing or gaining ice? -
barney2022 at 02:05 AM on 2 September 2010Antarctica is too cold to lose ice
Forget ice slides and ice shields, that has been happening for millions of years. The question is: Is the Antarctic getting larger because of the cooling that is taking place in this region of the world? Is ice getting larger in this area? -
JMurphy at 01:33 AM on 2 September 2010Carbon dioxide equivalents
TOP, firstly, where do we put all those trees and crops ? Where I live in London (and the South East of England in general) there doesn't appear to be much available land to give over to all those trees and crops - how many/much will we need ? Where do you suggest we put them ? Secondly, who, exactly, hasn't 'targetted' China ? Who HAS been targetted and by whom ? Anyway, although China is now the largest emitter of CO2, that is only a recent occurrence and they are only just ahead of the US, while having four times the population of the US. Per capita, they are well down the list (only just in the top 100), and far behind the US, Australia and Canada, for instance. China are also only just above the US in emissions of ALL GHG. But again, per capita, they are well down the list of offenders. As for coal, China may well use twice (maybe even three times) as much coal as the US, but don't forget that population, and therefore per capita, difference. China are also increasing the difference between themselves and the US in the use of renewable energy. -
RandyL at 01:26 AM on 2 September 2010How we know an ice age isn't just around the corner
@ Ann #10. "or attributed to completely other causes" ... such as 'It is God's Will'. The move will be away from skepticism to fatalism. -
Tom Dayton at 01:17 AM on 2 September 2010The surprising result when you compare bad weather stations to good stations
omnologos, you seem to believe that "good" and "bad" station placement is an experimental independent variable, with anthropogenic global warming theory providing strong reasons to expect the "bad" condition to display a different temperature trend than the "good" condition. Therefore you think that indistinguishability of the good and bad stations' trends is evidence against anthropogenic global warming theory. You are wrong. Anthropogenic global warming theory never, ever, has made different predictions for "bad" stations than for "good" stations. Even if there had been a difference in trend between those two classes of stations, that difference would have had no consequence for global warming theory. You should notice that not even Watts & Co. have made the claims that you are. That's because your claims are nonsensical. The only reason Watts & Co. were making noise about station siting was their claim, without any theoretical justification whatsoever, that the trend really is zero, and that the apparent trend is an artifact of bad station siting. Even that hypothesis of theirs was not a hypothesis of anthropogenic global warming being expected to cause a difference in trend between "good" and "bad" stations. -
michael sweet at 00:56 AM on 2 September 2010Carbon dioxide equivalents
RSVP, That statement clearly means that if I say carbon dioxide equivalents (not counting the effect of aerosols) and a policy maker thinks I mean carbon dioxide equivalents (counting the effect of aerosols) the policy maker might misunderstand what I said. Since the costs and benefits are different the decisions made are likely to be different. How does this relate to DEMOCRACY for those of us who are not paranoid? -
RSVP at 00:38 AM on 2 September 2010Carbon dioxide equivalents
"There is a real potential for governments and policy-makers to misunderstand and mis-apply information..." Good thing most of the world is sold on "DEMOCRACY". What exactly does this statement imply, McGrath? -
lciattaglia at 00:14 AM on 2 September 2010Weather vs Climate: Watch the waves, miss the turning of the tides
I remember reading a text on physical climatology a comparison aimed at representing the temporal dimensions of climate and climate change thus conceived: Suppose that the climate is represented by a natural forest and man is an ant. A natural forest is usually composed of areas where the plants are denser and some clearings, then to the edge of the forest clearings are increasingly extended until the wood ceases. Imagine that the ant is on its way through the forest and try to figure out where it ends. Whenever the vegetation thins out and is a grassy bushes or an open space the ant will be led to believe she get to the forest’s end. The same thing would happen to us if we wanted to assess climate change of the Earth with the lifespan we cross and judging the climate change on the basis of our "time meter” -
Daniel Bailey at 00:03 AM on 2 September 2010Carbon dioxide equivalents
Re TOP @ #4 above:Methane oxidizes to CO2 in roughly ten years. That is not long lived.
Which then has a residence time on the century timescale. Actually surprised and disappointed you nit on this one. Inre: Aerosols helping counter the GE of CO2 see here as well as here and here for a better discussion and background. The Yooper -
TOP at 23:42 PM on 1 September 2010Carbon dioxide equivalents
The obvious solution/use for higher CO2 levels is man made absorption via planting trees and crops where no trees or crops now grow. It is interesting that China hasn't been targeted as a GHG emitter. They use twice the coal that is used in the US. For the most part it is burned without the pollution controls used in the US. Perhaps this is a good thing as the SOx aerosols help counter the increase in CO2. "...long-lived greenhouse gases such as methane" Methane oxidizes to CO2 in roughly ten years. That is not long lived. -
Philippe Chantreau at 23:41 PM on 1 September 2010Urban Heat Islands: serious problem or holiday destination for skeptics?
Interesting Ned. Thanks for your work. Once again, this is the stuff you'd expect "skeptics" to do themselves if they were sincere. -
The empirical evidence that humans are causing global warming
Arkadiusz - Your postings are often long, with multiple references, and clearly show that you are doing some research and digging into sources. However, here, as in many previous postings, I find myself unable to determine what your point is. It's something about mid-century records of carbon and temperature, but are you asserting that there are (a) problems with one or more of the records, (b) issues with isotope methods, (c) anomalous temperature swings not congruent with current theories, or (d) something else entirely? I cannot tell! It would be very helpful if you could summarize or otherwise clearly state what your concern is in these postings. -
Ned at 23:32 PM on 1 September 2010Urban Heat Islands: serious problem or holiday destination for skeptics?
OK, so I thought about this some more last night, and did some calculations this morning. According to Berényi Péter, the urban heat island (UHI) effect causes a spurious trend of +0.2C to +0.3C per doubling of local population. If the population around a point went from 1000 people in 1900 to 8000 people in 2000, this (according to BP) would bias the true warming trend (if any) by +0.6C to +0.8C/century at that location, because the population doubled three times during that period. To determine the magnitude of this effect for the globe as a whole, it's not appropriate to use the overall global increase in population. You need to look at it spatially -- adding two billion people to areas that are already densely populated would have a relatively low impact, but adding the same number of people to sparsely populated areas would have a very large effect (because it would produce many more doublings on average). So, I downloaded the global 2.5-minute gridded population density data set from SEDAC. I did this for 1990 (the earliest year available) and 2010. I then calculated the number of doublings of population density for every grid cell (there are 30 million grid cells -- the data set doesn't include areas north of 85N or south of 58S, which are essentially uninhabited).[1] I then weighted each grid cell based on the cosine of its latitude. The weighted mean number of doublings of population density (1990-2010) is 0.050. Adjusting for the excluded areas at the north and south poles brings this to 0.046 doublings per 20 years. If this number seems small, consider that most of the world is covered by ocean. In addition, much of the land is essentially uninhabited (think of Antarctica, Greenland, various large deserts, much of Siberia, etc.) Having no population, these areas have of necessity experienced no doublings of population, and thus no UHI. Combining this global mean of 0.046 doublings of population density from 1990 to 2010 with BP's claimed UHI effect of +0.2C to +0.3C per doubling gives a UHI bias of +0.046 to +0.069 C/century worldwide. Over the same period, the global land/ocean temperature trend is around +1.7 to +1.9C/century, depending on which metric you use. Thus, using the "Berényi Method" for estimating UHI, over the past two decades we can say conclusively that the UHI effect has accounted for approximately 3% of the observed global surface warming trend. ------------ [1] To avoid numerical calculation issues involving 0, I recoded all grid cells with <1 person/km2 as 1. -
The surprising result when you compare bad weather stations to good stations
To quote you, omnologos: The "surprising result" shows (a) that "good" or "bad" is not a relevant way of categorizing stations regarding warming trends, in other words the work done by surfacestations.org is irrelevant in that respect OR (b) that the warming trend is spurious. The answer is (a), "not relevant", since the placement issues discussed affect offsets/accuracy, not repeatability/placement. Subset analysis clearly shows that the warming trends occur irrespective of subset selection, and are not spurious. -
The surprising result when you compare bad weather stations to good stations
Omnologos - The so-called "good" and "bad" station identifications from Watts reflect adherence to placement guidelines intended to ensure accuracy, adherence to ground-truth, minimal offsets between the station temperatures and local conditions. As stated before (repeatedly, by several people) trend analysis of anomalies (changes) is not dependent on accuracy, but rather on precision, repeating the measurement the same way every time for each station. Fixed offsets, as addressed in the placement guidelines, are completely irrelevant for anomaly trends - they're removed as soon as you look at the differences over time. So what does this mean? It means that Watts "good/bad" labeling is not terribly relevant for trend analysis. There does seem to be a small difference in the range of temperatures between the so-called good and bad sites; the "bad" sites show smaller temperature swings and slightly less warming. Perhaps the 'air-conditioners' or other issues with some sites are insulating the stations from full temperature swings. But when you get down to the actual numbers, the charts above, it just doesn't make a difference in the trend data - the warming trend is not spurious. If you (as you have been doing) assert that it does make a difference, then you should calculate a significant trend difference statistic between subsets of the stations and show it. -
Arkadiusz Semczyszak at 23:11 PM on 1 September 2010The empirical evidence that humans are causing global warming
naturanych = natural - sorry -
Alexandre at 23:08 PM on 1 September 2010Carbon dioxide equivalents
Aerosols are in itself a pollution that is supposed to be avoided. The geoengeneering that counts on them has side effects and is not considered to be a safe solution to the warming. Its inclusion in the total CO2e figures could lead to unwanted incentives. -
Peter Hogarth at 23:08 PM on 1 September 2010Sea level rise: the broader picture
I will, time (and space) permitting, attempt to discuss variations from these trends, and the satellite altimetry record (Ken, BP), separately. -
Peter Hogarth at 23:03 PM on 1 September 2010Sea level rise: the broader picture
Berényi Péter at 11:03 AM on 31 August, 2010 Sorry about the late response. I hope the following is useful. First, let us look at the comment on the New York Tide gauge data that Peter B selected (from NOAA historic tide data). The overall New York linear trend is 2.8mm/yr over the entire period, though there is a short gap. This is relative sea level, relative to the local land. We need to correct this data with an estimate of local GIA (Glacial Isostatic Adjustment, or post glacial rebound) for any vertical land movement. Peter B correctly states GIA in this area is still being affected by recovery from the the last Glacial Laurentide Ice sheet “forebulge collapse”. PBs image gives us little detail but his statement that New York GIA is negligible is not supported by several lines of evidence. If we look at: Figure 1, modeled GIA, image from Horton 2009.
This shows output of a global GIA model (ICE-4G (VM2), Peltier 1998) looking at the US. Horton suggests there is good agreement with sea level data from the US North Eastern coast. The updated ICE-5G (VM2) model is given in Peltier 2005 (see figure 21, the coastline near New York runs somewhere beteen the 0 and -2mm/yr contours). From the updated GIA model Kolker 2009 gives New York GIA correction as -0.85 to -1.64 mm/yr. This means the land is tilting downwards and thus relative sea level rise rates would appear higher.
We can also estimate GIA from direct GPS measurements made over several years as in Woppelmann 2009. Background for the North East of the US is given in Sella 2007 below which uses GPS derived vertical references using 362 GPS sites across US and Canada to estimate GIA (in good agreement with the models).
Figure 1, modeled GIA, image from Horton 2009.
This shows output of a global GIA model (ICE-4G (VM2), Peltier 1998) looking at the US. Horton suggests there is good agreement with sea level data from the US North Eastern coast. The updated ICE-5G (VM2) model is given in Peltier 2005 (see figure 21, the coastline near New York runs somewhere beteen the 0 and -2mm/yr contours). From the updated GIA model Kolker 2009 gives New York GIA correction as -0.85 to -1.64 mm/yr. This means the land is tilting downwards and thus relative sea level rise rates would appear higher.
We can also estimate GIA from direct GPS measurements made over several years as in Woppelmann 2009. Background for the North East of the US is given in Sella 2007 below which uses GPS derived vertical references using 362 GPS sites across US and Canada to estimate GIA (in good agreement with the models).
 For specific detail on New York Snay 2007 gives -1.35mm/yr for the nearest Geodetic GPS station vertical velocity (14.5km from the New York “Battery” tide gauge) but with high error estimates, as there was only 4 years of GPS data 2001-2005, at that time. There are now over 1600 GPS Continuously Operating Reference Stations (CORS) - as of end 2009, so we expect detail to improve and std deviation from older individual stations to improve as Woppelmann 2009 indicates for tidal stations near New York. Using the 2007 GPS estimate of GIA we get an absolute MSL (Mean Sea Level) rise of 1.45mm/yr for New York over the past 150 years. Using the GIA model value we get 1.56mm/yr.
We can also estimate GIA from late Holocene Geological RSLR (Relative Sea Level Rise) data from before any 20th Century (or potential Industrial period) acceleration and subtract this from the tide gauge records, as in Engelhart 2009, which gives another independently derived GIA estimate and overall MSL value for the New York tide station of around 1.8mm/yr. If we use the same overall measured baseline RSL tidal value of 2.8mm/yr instead of the 3mm/yr Engelhart uses, we get an MSL value of 1.6mm/yr overall. The agreement is good.
A related and useful recent paper on salt marsh derived Sea Level history is Kemp 2009. Here estimates of Mean Sea Level rise in North Carolina are given and placed in the context of other data from several sites in the NE US. The agreement with the global values from Jevrejeva 2008 and Church and White 2009 is good, and the small latitudinal variations are of note.
For specific detail on New York Snay 2007 gives -1.35mm/yr for the nearest Geodetic GPS station vertical velocity (14.5km from the New York “Battery” tide gauge) but with high error estimates, as there was only 4 years of GPS data 2001-2005, at that time. There are now over 1600 GPS Continuously Operating Reference Stations (CORS) - as of end 2009, so we expect detail to improve and std deviation from older individual stations to improve as Woppelmann 2009 indicates for tidal stations near New York. Using the 2007 GPS estimate of GIA we get an absolute MSL (Mean Sea Level) rise of 1.45mm/yr for New York over the past 150 years. Using the GIA model value we get 1.56mm/yr.
We can also estimate GIA from late Holocene Geological RSLR (Relative Sea Level Rise) data from before any 20th Century (or potential Industrial period) acceleration and subtract this from the tide gauge records, as in Engelhart 2009, which gives another independently derived GIA estimate and overall MSL value for the New York tide station of around 1.8mm/yr. If we use the same overall measured baseline RSL tidal value of 2.8mm/yr instead of the 3mm/yr Engelhart uses, we get an MSL value of 1.6mm/yr overall. The agreement is good.
A related and useful recent paper on salt marsh derived Sea Level history is Kemp 2009. Here estimates of Mean Sea Level rise in North Carolina are given and placed in the context of other data from several sites in the NE US. The agreement with the global values from Jevrejeva 2008 and Church and White 2009 is good, and the small latitudinal variations are of note.
 Getting back to NY, using the GPS derived value of GIA to correct the tide data from New York, and comparing the corrected data with Jevrejeva 2008, we get:
 The offsets are for convenience. Second order trend fits are a little different, (I also get slightly higher NY acceleration values than BP even after corrections) but within each others error bounds. The overall background acceleration is apparent.
-
Arkadiusz Semczyszak at 22:54 PM on 1 September 2010The empirical evidence that humans are causing global warming
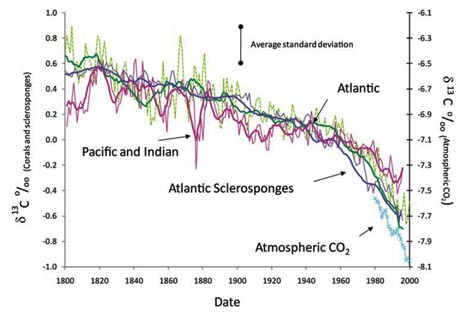
“terrestrial-derived atmospheric δ13CCO2 values are then needed.” F. Engelbeen criticizing the Beck papers publishes data on "sea" delta 13C and comments like this: “That is a very fast one: from the base line in 1936 at around 330 ppmv (historical) to 430 ppmv in 1943.” on the latest Beck figure (2010) we have, however, (after smoothing filter), only circa 40 ppmv ... Let us dispense with, however, this "minor" inaccuracy. “Again, there is no sign of anything happening around 1943, even if the d13C records have a high resolution of 2-4 years around that period and the accuracy is fine enough to detect an extra addition/uptake of 1 GtC (0.5 ppmv) from/by vegetation or 4 GtC (2 ppmv) from the (deep) oceans. Thus all we can say is that other (proxy) methods, even with high resolution, don't show any abnormal variation around 1943.” Really, nothing unusual happens, the sharp in the 40's? Reconstruction of the history of anthropogenic CO 2 concentrations in the ocean. Khatiwala et al. 2009.: “Our results also suggest that the terrestrial biosphere was a source of CO 2 until the 1940s, subsequently turning into a sink.” ... and let's look at this graph: by “Global and European temperature (CSI 012) - Assessment published Jun 2010” Shocking, is not it (!?) Change (decrease) in temperature from 1940 to 1950 in Europe - comparable (increase) from 1950 to 2009! 10 years = 60 years! Rapid change in 1940-1950 can be found throughout NH - naturanych main source of CO2 emissions. ... And land d.13 C? Here, of course, I will quote my favorite graph: A bi-proxy reconstruction of Fontainebleau (France) growing season temperature from AD 1596 to 2000, Etien et al. 2008.: Fig. 2 - there is a “severe” proxy delta - δ13C - The data d. 13C for the period under discussion (194? -5?) are slightly lower than for the late twentieth century, their decline as rapidly as in Beck and temperatures in Europe ... Even the stomata do not want to show as beads and so wants to F. Engelbeen. In this figure (Kouwenberg, 2005.) but you can see a clear "hump" in the middle of the twentieth century. Also loving CO2 coccolith Phytoplankton Calcification in a High-CO2 World, Iglesias-Rodriguez et. al, 2008., indicate its mass, peak - fall - similar to that in Beck, but quite different in the case of d. 13C corals and sponges. -
Rob Painting at 22:30 PM on 1 September 2010Sea level rise: the broader picture
Ken, I have a look at the tune you were playing (only glossed over it to be honest) & get back you later. -
Rob Painting at 22:26 PM on 1 September 2010The surprising result when you compare bad weather stations to good stations
Actually Omnologos, the moment a skeptic starts using latin quotes, my spidey senses start going off. Well honed now. As for the conclusion of Menne et al, I too would have expected the opposite result i.e. poorly sited stations to be biased too warm. Perhaps the guidelines are unnecessarily too stringent?, maybe the people who laid down the guidelines over estimated the effects of possible biases?. In engineering for example, structures and buildings don't necessarily collapse because they don't meet a certain specification - normally because there's a large safety margin factored in to calculations. (Not that I'm suggesting shoddy work is good practice mind you) But that's for the scientists to examine.There's one conclusion I definitely would not draw - spurious warming. See graphic posted earlier. -
Arkadiusz Semczyszak at 22:08 PM on 1 September 2010Human CO2: Peddling Myths About The Carbon Cycle
Sorry to burst formatting error, please discard my postModerator Response: I think I fixed the formatting errors... -
Ken Lambert at 22:06 PM on 1 September 2010Sea level rise: the broader picture
Dappledwater #44 at 23:28 PM on 31 August, 2010 Ken, that set of posts was entertaining. And yet here you are still banging on the same old drum. Its an old drum for someone still in short pants - but one you seem to have trouble answering with anything other that a tweet tweet perhaps. I notice that no-one was prepared to take on BP's point about the flattening of Jason's record of SLR. Nor has anyone produced an effective answer to the serious inconsistency of flattening SLR with rising warming imbalance. Even if the warming imbalance stopped rising and stayed at the claimed 0.9W/sq.m, there would be a linearly rising energy addition to the Earth system, most of which has to be stored in the oceans. -
Arkadiusz Semczyszak at 22:01 PM on 1 September 2010The empirical evidence that humans are causing global warming
Czy korale, gąbki , mówią prawdę o byłych stężenie CO2 Opublikowanym niedawno artykule : 13C efekt Suess w scleractinian korale lustro zmian w inwentaryzacji antropogenicznych emisji CO2 z powierzchni oceanów , et Swart al. 2010 W zawiera na poniższym rysunku. . Oczywiście, dane te są identyczne z rdzeni lodowych - pokazują one, praktycznie stał się stały wzrost CO2 w XX wieku , zwłaszcza . Autorzy piszą: " Z tych zapisów, 64% wykazuje istotne statystycznie (p < 0,05) spadek D13c do dnia dzisiejszego (23 z 37). Spadek ten wynika z dodatkiem CO2 pochodzenia antropogeniczną ( 13C efekt Suess ) do atmosfery. [...]" Pozycji, jednak i takie zdania : " Niewielki wzrost stawki fotosyntezy, związane z wzrostem natężenia światła , wydaje się zwiększenie D13c szkieletu , natomiast zmniejsza się w świetle spowodowałaby spadek wartości D13c w szkielecie [ Weber, 1970] . Sugerowano, że różnice w D13c szkielet może być również związane ze zmianami tempa wzrostu , nasłonecznienie i inne czynniki wpływające na symbiotyczny związek między korali i ich zooxanthellae . Oprócz rocznej różnicy w D13c , zauważył kilku pracowników, którzy na długoterminowych tendencji w kierunku niższych wartości D13c w szkielety koralowców i przypisać te spadki do 13C Suess efekt [ Druffel i Benavides , 1986 ]. Pierwszy papier do tej obserwacji w szkieletów koralowców [ Nozaki et al. , 1978 ] stwierdził, zbliżenie 0,4 ‰ zmniejszenie D13c 1900 / 50 , o takiej samej wysokości, zostały zachowane w pierścieniach drzew [ Damon in. , 1978 ]. Mimo, że wnioski z Nozaki et al. [1978] , zostały podważone [ Weil et al. , 1981 ], długoterminowe zmniejszenie D13c korala szkielety są dobrze udokumentowane ... [ dostarcza informacji na temat źródeł ] Jeśli jednak tylko Weil i jego zespół patrz niezgodności : ziemi - ocean ? Korale : Konsekwencje korali wzrostu stawek, Juillet , Leclerc i Reynaud , 2009 : "To eksperyment , który pozwolił na wyodrębnienie efektów świetlnych i temperatury na rafy , wskazały na znaczące wpływy na światło zarówno szkieletowych _18O i _13C . wysoki rozrzut _18O między kolonii obserwowano w jednym miejscu, może wynikać z różnic w reakcji fotosyntezy glonów symbiotycznych zespołów . Odpowiedzi _13C może być również związane z różnych dystrybucji glonów w różnych częściach układu kostnego . "," Istnieje wiele skutków tych danych dla paleoklimatycznych rekonstrukcje z udziałem korali . "Mimo, że od wartości δ13C morskich węglanów dostarczyć cennych informacji na temat ostatnich zmian w obiegu węgla , w wyniku odpowiedzi na lądowych i biomasy nie może bezpośrednio wynika z tych wartości [ fizjologia , degradacji mikrobiologicznej i ] diagenezy skał. W celu uzyskania pełniejszego obrazu tych ostatnich zmian w obiegu węgla , naziemnych pochodzenia atmosferycznego wartości δ13CCO2 następnie potrzebne. " Patrz tutaj . Atmosferyczne δ 13 CO 2 i jego stosunku do p CO 2 i głęboko ocean δ 13 C w późnym plejstocenie, Köhler et al. , 2010 . " te , które występują w terminach krótszych niż tysiąclecia nie są wykrywalne w δ 13 CO 2 z powodu równowagi wymiany gazowej z powierzchni oceanu ... " chciałbym mieć (znowu) dodaje się do niezwykle aktywny CO2 - woda ... Poza tym, Swart et al. 2010 roku. nie obejmuje okresów wcześniejszych, i nie może być inaczej: klimatu i wody Antarktyki Średnio sprzęgło w późnym holocenie , Euler i Ninnemann 2010 roku. : " Poniżej przedstawiamy pierwszy subdecadally próbą rekonstrukcji zmienność w południowo-wschodniej upper-intermediate Pacyfiku od ca. AD 0-1300 pomocą otwornic [bez korali i gąbek ] izotopów tlenu i węgla rekordy . Nasze wyniki wykazały dużą różnorodność powierzchni oceanu zarówno właściwości fizycznych i dekadowej stulecie skale czasu na południowym wschodzie Pacyfiku aż 3 ° C lub więcej w ciągu zaledwie o 50 yr . -
omnologos at 21:50 PM on 1 September 2010The surprising result when you compare bad weather stations to good stations
thank you @Dappledwater. So we are back to "Menne 2010". Good to know. And by the way (surprise, surprise!) this is from that paper's conclusions: "The reason why station exposure does not play an obvious role in temperature trends probably warrants further investigation" QED (yes, that's for your Latin craving) -
JMurphy at 21:37 PM on 1 September 2010The surprising result when you compare bad weather stations to good stations
I always thought that the word 'surprising' in the title was being used ironically, even sarcastically. -
Michael Searcy at 21:35 PM on 1 September 2010How we know an ice age isn't just around the corner
"Today's comparatively warm climate has been the exception more than the rule during the last 500,000 years or more. If recent warm periods (or interglacials) are a guide, then we may soon slip into another glacial period. But Berger and Loutre argue in their Perspective that with or without human perturbations, the current warm climate may last another 50,000 years. The reason is a minimum in the eccentricity of Earth's orbit around the Sun." (Berger 2002)(PDF) -
Rob Painting at 21:32 PM on 1 September 2010The surprising result when you compare bad weather stations to good stations
Omnologos, more like: 1. "Good stations" show warming trend. Yup, tallies with observations of the natural world - 2. "Bad/poor stations" show even more warming trend. WTF?. That's surprising!. What a waste of all those junior woodchucks time (for them that is - helpful though in a blog science way)
3. Oh that's why
4. Insert latin phrase of one's choice here (learnt that from the Wizard of Oz). Reductio ad absurdum?,...........argumentum threadbearum?...........
2. "Bad/poor stations" show even more warming trend. WTF?. That's surprising!. What a waste of all those junior woodchucks time (for them that is - helpful though in a blog science way)
3. Oh that's why
4. Insert latin phrase of one's choice here (learnt that from the Wizard of Oz). Reductio ad absurdum?,...........argumentum threadbearum?...........
-
CBDunkerson at 21:17 PM on 1 September 2010The surprising result when you compare bad weather stations to good stations
omnologos, my initial post was removed so I'll just say that you have been GIVEN the information you say you are looking for... repeatedly. You have failed to address it. That makes me think... 'bad things' about you. If you really think you are having a reasoned conversation here you might want to try looking at the points people have raised and the further information in the links supplied and then either acknowledging that they dismantle your position or explaining why you think they do not. -
CBDunkerson at 20:55 PM on 1 September 2010The surprising result when you compare bad weather stations to good stations
omnologos #43: "This is about "skeptical science" after all, non kindergarten's." Troll or fool. I no longer care. -
omnologos at 20:23 PM on 1 September 2010The surprising result when you compare bad weather stations to good stations
And yet it should have been simpler to get. Even Jim Meador gave a hint of this, by putting "surprising" in the title of the blog. Why? Because... 1. "Good stations" show a warming trend --> good evidence for a warming trend 2. "Bad stations" show a warming trend too --> "surprising result" The "surprising result" shows (a) that "good" or "bad" is not a relevant way of categorizing stations regarding warming trends, in other words the work done by surfacestations.org is irrelevant in that respect OR (b) that the warming trend is spurious. Tertium non datur. I really can't see what there is of anti-scientific in stating such an obvious truism. Au contraire...if people want to go for (a), they should justify it in a scientific way. Please do. And before anybody asks...of course (a) is more likely than (b) ("actually the good stations show more of a warming trend!"). But I am not interested in opinions about it, rather the science. This is about "skeptical science" after all, non kindergarten's. -
Ned at 19:39 PM on 1 September 2010How we know an ice age isn't just around the corner
gallopingcamel writes: However, a return of the Laurentide ice sheet extending all the way to where New York City stands is much more to be feared. Only if you make it a practice to worry about things that are not going to happen until after you've been dead for tens of thousands of years [with no AGW] or hundreds of thousands of years [with AGW]. -
ScaredAmoeba at 19:36 PM on 1 September 2010How we know an ice age isn't just around the corner
gallopingcamel @ 9 Yes, replacing the climate cycles that crafted all life on earth with the most rapid rises in global temperature and ocean acidification ever seen, greater than during the PETM [IIRC] is to be celebrated, or perhaps not. We know that life managed to cope with past perturbations, but now we are in new territory. And while denialists often talk of 'adapting' and 'survival', they seem to have as much idea of the concept and mechanisms of evolution as they do of the climate. -
Rob Painting at 19:16 PM on 1 September 2010Sea level rise: the broader picture
HR @ 57 - there's a very good reason that the rate of rise was small over the 4 year period analysed by Leuliette & Miller. It's something I pointed out @ 21 - ENSO. From the paper's conclusions: "Regional trends in sea level rise are driven primarily by local variations in steric sea level. During our study period the individual components of sea level experienced weak El Nin ˜o conditions in 2004–2005 and 2006–2007 and a moderate La Nin ˜a, which began developing in mid 2007. As a consequence, sea level rise (1.5–2.4mm/a)during the period is 33–50% slower than the rate reported in the 4AR." "Most of the sea level rise during 2004–2008 occurred in the Southern Hemisphere (3.1 mm/a) and the rate of sea level rise in the Northern Hemisphere (0.2 mm/a) was the lowest of any four-year period since regular altimetry observations began." Again this finding is in line with those of Merrifield 2009 - see comment @40. "In particular, the rate in sea level rise in the Indian ocean observed by altimetry was 4.7 mm/a and 7.4 mm/a from Envisat and Jason-1, respectively. Poor coverage of the Indian ocean prior to 2006 or other systematic errors may affect our analysis with SL steric, which shows a rise of only 2.4 mm/a over the basin." Yup, still issues to resolve. -
JMurphy at 18:53 PM on 1 September 2010Carbon dioxide equivalents
miekol, you need to read the following on this site : Climate's changed before It's not bad CO2 was higher in the past Animals and plants can adapt to Global Warming CO2 was higher in the Late Ordovician -
ScaredAmoeba at 18:13 PM on 1 September 2010Medieval Warm Period: rhetoric vs science
Regarding the MWP, a reconstruction from borehole temperatures [no treerings] is A late Quaternary climate reconstruction based on borehole heat flux data, borehole temperature data, and the instrumental record - Huang, Pollack and Shen (2008) "The reconstructions show the temperatures of the mid-Holocene warm episode some 1–2 K above the reference level, the maximum of the MWP at or slightly below the reference level, the minimum of the LIA about 1 K below the reference level, and end-of-20th century temperatures about 0.5 K above the reference level. [1961-1990 mean of the instrumental record]" Which it seems essentially would appear to confirm Moberg. -
miekol at 17:52 PM on 1 September 2010Carbon dioxide equivalents
Isn't it possible we are lucky we have induced global warming because otherwise we may have well been on the way into another ice age? Today the Earth warms up and cools down in 100,000- year cycles. Geologic history reveals similar cycles were operative during the Carboniferous Period. Warming episodes caused by the periodic favorable coincidence of solar maximums and the cyclic variations of Earth's orbit around the sun are responsible for our warm but temporary interglacial vacation from the Pleistocene Ice Age, a cold period in Earth's recent past which began about 2 million years ago and ended (at least temporarily) about 10,000 years ago. And just as our current world has warmed, and our atmosphere has increased in moisture and CO2 since the glaciers began retreating 18,000 years ago, so the Carboniferous Ice Age witnessed brief periods of warming and CO2-enrichment. Following the Carboniferous Period, the Permian Period and Triassic Period witnessed predominantly desert-like conditions, accompanied by one or more major periods of species extinctions. CO2 levels began to rise during this time because there was less erosion of the land and therefore reduced opportunity for chemical reaction of CO2 with freshly exposed minerals. Also, there was significantly less plant life growing in the proper swamplands to sequester CO2 through photosynthesis and rapid burial. It wasn't until Pangea began breaking up in the Jurassic Period that climates became moist once again. Carbon dioxide existed then at average concentrations of about 1200 ppm, but has since declined. Today, at 380 ppm our atmosphere is CO2-impoverished http://www.geocraft.com/WVFossils/Carboniferous_climate.htmlResponse: Isn't it possible we are lucky we have induced global warming because otherwise we may have well been on the way into another ice age?
Possible but unlikely. The current configuration of the Earth's orbit meant even without our CO2 emissions, we were most likely in for a long interglacial - the next ice age was tens of thousands of years away. The question is now moot - CO2 emissions have meant a planetary ice age is indefinitely off the table. The negative impacts of global warming over the next century impacting us, our children and grandchildren are of much more concern than a speculative ice age tens or thousands of years into the future. -
JMurphy at 17:49 PM on 1 September 2010How we know an ice age isn't just around the corner
cruzn246 wrote : "The reason we are not heading down that road is simple. Sea levels are not high enough yet. If they reach the height needed to shut off the Gulf Stream and we are still in a relatively weak position to the sun we will go back into an Icing time. If the sea levels rise too slowly to catch that we may not have one." Do you know what height that would be and how fast levels would have to rise to initiate all that ? Also, how do you believe that fits in with the Milankovitch cycles ? -
Ann at 17:41 PM on 1 September 2010How we know an ice age isn't just around the corner
I want to make a prediction – not about the climate, that’s old stuff. I want to make a prediction about climate deniers. 20 years from now they will still tell us that global warming isn’t happening, and at the same time that global warming IS happening and isn’t it wonderful ? And all natural and human disasters that happen in the meanwhile will be either completely ignored by them or attributed to completely other causes. -
Peter Hogarth at 16:33 PM on 1 September 2010Climate's changed before
svettypoo at 11:57 AM on 1 September, 2010 Thanks. I am aware of the correspondance between Vezier and Royer, and there is a chain that goes beyond your reference. The temperature data from Royer 2009 is indeed from work in 2004, and Vezier acknowledges that to correct for pH (as Royer did) is valid. The Vezier T curve looks similar (as the d18O raw data will not be very different). However the CO2 data from Royer 2009 is very up to date (late 2009 corrections, please have a look at the references), most of the CO2 data you show (the output of model, GeoCarb) is not. We have proxy data from much recent work, and some of this is summarised in Royer 2009 and the later GeoCarbsulf(volc) model output). You should also read more widely on this, Pagani, Retallack, Zachos and Zeebe spring to mind, but then look at the recent references I linked above. On sea level, I will have to look at Schutter again, but there is the small matter of completely different continental configurations over this period... -
miekol at 16:06 PM on 1 September 2010Sea level rise: the broader picture
I know its not a scientific thing to say, but I love this site :-) -
gallopingcamel at 15:29 PM on 1 September 2010How we know an ice age isn't just around the corner
Bern (#8), There may be plenty of problems arising out of sustained high global temperatures such as we had in past epochs when trees grew in Antarctica. However, a return of the Laurentide ice sheet extending all the way to where New York City stands is much more to be feared. -
HumanityRules at 15:15 PM on 1 September 2010Sea level rise: the broader picture
doug_bostrom The paper you keep quoting LEULIETTE AND MILLER: CLOSING THE SEA LEVEL RISE BUDGET seems to have a SLR of 1.5mm/year (0.8mm steric and 0.8mm mass) for 2004-2007. This is the same as the long term 20th century average. This paper seems to refute the idea that an acceleration has occured. -
Bern at 15:12 PM on 1 September 2010How we know an ice age isn't just around the corner
gallopingcamel: Yeah, but there are a few potential downsides to elevated temperatures. And as many others have pointed out many times before - it's possible, perhaps even probable, that Homo Sapiens will survive the worst global warming can throw at us. You may not be able to say the same of the civilisation that lets you sit in air-conditioned comfort typing your message on a PC... -
HumanityRules at 14:54 PM on 1 September 2010Sea level rise: the broader picture
48.michael sweet I was less interested in the specifics of how the numbers are generated and more the way they are being used to tell a story. Ned's post does say 5.4mm/4.9mm "compares very well" with 3.3mm. More generally with regard to acceleration we are arguing over a change in SLR of ~1.5mm/year, I was just saying on Ned's basis 1.8mm "compares very well" with 3.3mm. "Pay attention to what you are comparing." I wasn't particularly comparing anything, I think Ned was doing that. I'm still curious why there is no evidence of an acceleration in SLR over the course of the 18 year satellite record? As seen in the two papers from Peter Hogarth's post #15. Am I wrong to expect an acceleration in that period? -
gallopingcamel at 14:50 PM on 1 September 2010How we know an ice age isn't just around the corner
While this is an interesting post, it lacks the grand vision of earlier posts. Let us not forget the truly breath taking predictions of David Archer: http://www.skepticalscience.com/upcoming-ice-age-postponed-indefinitely.html Take a look at Figure 3. Ice Ages will be a "thing of the past" thanks to CO2. Personally I see that as something wonderful (if only it was likely). No more glacial cycles that have so stressed hominids during the last million years. As Eliza Doolittle would say "Would'nt it be loverly?" -
bgood2creation at 14:20 PM on 1 September 2010How we know an ice age isn't just around the corner
I have found this site very informative and helpful. Thanks for the explanation. One question: How does the rate of temperature increase between the glacial and interglacial periods compare to the current rate of increase and the predicted rate of increase for the next century? I ask because one of the things I (and millions of other people) am concerned about is the ability of ecosystems to adapt to the change. Thanks in advance.Response: The change in global temperature between ice ages and interglacials is approximately 5 to 6°C (the change in temperature is greater in Antarctica, less in the tropics). If we went along business as usual, we might achieve warming of this order:
However, the issue is the speed of change. The change from glacial to interglacial occurs over thousands of years. We're effecting this change over a century or two. It's the speed of change that's the issue here - if temperatures change too quickly, ecosystems are unable to adapt quickly enough. We know this from past history - all the mass extinctions in the past were associated with periods of dramatic climate change. -
cruzn246 at 14:10 PM on 1 September 2010How we know an ice age isn't just around the corner
The reason we are not heading down that road is simple. Sea levels are not high enough yet. If they reach the height needed to shut off the Gulf Stream and we are still in a relatively weak position to the sun we will go back into an Icing time. If the sea levels rise too slowly to catch that we may not have one. -
robert way at 13:48 PM on 1 September 2010Hockey stick is broken
It is easy to see why M & W was not submitted to a climate journal. First question they'd be asked is why they used local proxies to correlate to global temperatures and then criticized those same proxies for not being predictive of global temperatures. If they had any sense they would of compared them to the LOCAL temperatures that the proxies actually respond to...
Prev 2215 2216 2217 2218 2219 2220 2221 2222 2223 2224 2225 2226 2227 2228 2229 2230 Next


