


 Arguments


Recent Comments
Prev 2217 2218 2219 2220 2221 2222 2223 2224 2225 2226 2227 2228 2229 2230 2231 2232 Next
Comments 111201 to 111250:
-
MichaelM at 02:12 AM on 1 September 2010The surprising result when you compare bad weather stations to good stations
It is ironic that omnologos cites Galileo who I would posit never made 'accurate' measurements. He had no timepiece, his compass was probably only accurate to a degree, his lenses were imperfectly ground etc, but his contribution to science is immeasureable. -
JMurphy at 02:10 AM on 1 September 2010The surprising result when you compare bad weather stations to good stations
omnologos wrote : "If a doctor doesn't use the diagnostic instruments properly, I go to a doctor that does, don't you?" How do you know when you've found a doctor that uses that instrument properly ? What do you judge the result against ? For me, if a doctor didn't use the instrument properly (but I didn't know - I was suspicious because I got a result I didn't like) and gave me bad news, I would go to another. If the next one told me the same bad news, do I suspect that he/she doesn't know what he/she is doing too, or do I face up to reality ? -
Jim Meador at 02:08 AM on 1 September 2010The surprising result when you compare bad weather stations to good stations
Hi omnologos, You aren't making a distinction between absolute measurements and trends, and this is something many people overlook. Although on any given day a perfect measurement is great to have, it is not required for trend analysis. If every measurement is off by 100 degrees, every day, over the entire record, then this 100 degree offset does not matter for the trend analysis. It was present at the beginning and at the end, so it does not affect the trend. The graph shows the "Anomaly" which is the difference from a reference point. (Notice that the scale is near zero.) Absolute measurement errors that are present throughout the record don't make it into the anomaly. You mention "poor data" but the point of the Menne study was to show that "poorly sited" stations still provide useful data for trend analysis. "Poorly sited" does not mean "poor data" when it comes to trends. -
Doug Bostrom at 02:03 AM on 1 September 2010The surprising result when you compare bad weather stations to good stations
I don't think you'll be able to find a doctor you're comfortable with, omnologos. How many have you visited? Have you compared readings? How can you tell if the readings are correct? -
CBDunkerson at 02:03 AM on 1 September 2010The surprising result when you compare bad weather stations to good stations
So... when confronted with three matching data sets; A, B, and A+B which all show virtually identical results your conclusion is that they must all be wrong? Because some guy with a blog found that set B don't meet a list of criteria which were established for measuring something other (absolute temperatures) than the data sets are looking at (relative temperature changes). When we then add in matching anomaly readings from weather balloons does that mean those are ALSO wrong? The matching satellite temperature record? Thrown off by urban heat islands in space? The various matching proxy temperature sets? Has EVERY temperature reading in the history of the world been wrong? Or are you being ridiculous? -
The surprising result when you compare bad weather stations to good stations
Omnologos - I stand by my statements regarding accuracy and precision. If your doctors instruments are poorly calibrated they will be inaccurate (offsets from ground truth). If, however, they are precise, they will give the same readings over time. The various issues raised about temperature collection seem to all be about accuracy - arguing that there are offsets for individual instruments due to siting. But these issues have nothing to do with precision, which is driven by consistent use of an instrument, maintaining correct offsets when changing thermometers, changing the time of day for recording values, or moving an instrument - those are all procedural issues, and the only complaints I've seen on those is "It's complicated!" from a couple of posters. Trend analysis only requires precision. -
michael sweet at 02:01 AM on 1 September 2010The surprising result when you compare bad weather stations to good stations
Omnologos, Scientists HAVE analized the data very carefully over decades and they say that there is a trend in temperature. If you want to claim that "it's because there is something else affecting the measurements, and maybe there is no trend" then you need to suggest what that something might be. Otherwise you are just saying "I doubt it" and you have no argument. What do you suggest is causing this trend, in the good and the bad stations, that is not AGW? It needs to explain glacier retreat, seasons changing, sea level rise also. I look forward to your explaination. -
omnologos at 01:55 AM on 1 September 2010The surprising result when you compare bad weather stations to good stations
@KR: "This actually gets at the difference between accuracy and precision". No. My example is not about accuracy and precision. My example is about going to see 100 doctors, _all_ making mistakes in measuring your blood pressure. If a doctor doesn't use the diagnostic instruments properly, I go to a doctor that does, don't you? -
omnologos at 01:52 AM on 1 September 2010The surprising result when you compare bad weather stations to good stations
@michael sweet: "You will see that the 'good' data give the same result as the 'bad' data". And that _is_ the problem. The answer could either be (a) "it's because 'good' and 'bad' don't have a meaning in matters of trends" (the most popular take, around here). Or (b) "it's because there is something else affecting the measurements, and maybe there is no trend". It's up to science to figure out which is which. If instead we assume it's (a), then it's an assumption, not a finding. And it's not science. If well-constructed clocks drift just as much as poorly-constructed clocks, we can all assume time is dilating, or try to understand what is actually happening. -
The surprising result when you compare bad weather stations to good stations
Omnologos - Given your doctor example here, if you've visited 100 doctors and received varying results for blood pressure, that means that the accuracy of the various instruments vary a lot. Perhaps some of the are better at calibrating their instruments than others? If you then visit the same 100 doctors a year later, using the same instruments, and see that on all of them your blood pressure is 20 points higher than it was the year before, a trend change - are you going to throw out that trend change because of the accuracy issue? Or are you going to get a prescription for a blood pressure lowering medicine? This actually gets at the difference between accuracy and precision. The adjustments guidelines are intended to maintain both accuracy (calibrate correct offsets for site conditions) and precision (when changing thermometers, adjust for instrument differences). Trend analysis only requires precision and sufficient data, not accuracy for each instrument. -
dsleaton at 01:40 AM on 1 September 2010The surprising result when you compare bad weather stations to good stations
Forecasters: "The barometer on station X seems to be off by about 100mb, but it is still trending downward, in line with the other three stations. Observers also report increasing wind and wave activity. Our models indicate a 90% chance that a major hurricane will make landfall here tonight." Omnologos: "Right, whatever! One out of four stations is totally off! That's significant error! 90%? Not good enough! I believe I'll be partying on the beach tonight. Bloody alarmists." -
michael sweet at 01:36 AM on 1 September 2010The surprising result when you compare bad weather stations to good stations
Omnologos: Check out the graph at the top of this post. You will see that the "good" data give the same result as the "bad" data. Deniers like Watts would have us throw out the entire data collection, "bad" and "good", because of the issues you are raising. Scientists have corrected the "bad" data as much as possible. The graph here shows that it is not necessary to correct the "bad" data-- they are the same uncorrected! Looking at the graph in the post I have to ask "what is Omnologos concerned about?" What in this graph makes you doubt the reliability of the temperature record? No data is perfect. We do the best we can with the data we have. -
Doug Bostrom at 01:33 AM on 1 September 2010The surprising result when you compare bad weather stations to good stations
Nice attempt at circularity there, omnologos. Let's express it a different way: You're wrong, so why does Jim have to post this blog at all? The answer is that folks like you will continue bashing away with your failed argument about how absolute accuracy in temperature measurements is necessary to identify a trend in temperature and its proportional relevance. This is basically the same pointless distraction as asking "if we can't predict weather, how can we predict climate?" For reasons we cannot know, maintaining confusion here is terribly important to you, enough so that you'll ignore everything you're told regarding the matter. Using your example, if you visit 100 doctors with sphygmomanometers and all of those show similarly high readings, what's the main concern? Will you worry over the absolute accuracy of all of those instruments, or should you instead be motivated to explore whether you may have a pathology causing your blood pressure to rise? You'll choose risking a stroke, for some reason. Personally, I find it ironic to discover how people worried about temperatures trending upwards show no interest whatsoever in getting those trends right (in a scientific sense). Really? How extraordinarily obdurate. Here's a summary of things of which you're probably already aware, but you can still say people are not interested in getting it right? -
omnologos at 01:19 AM on 1 September 2010The surprising result when you compare bad weather stations to good stations
@michael sweet: "what should we do with data that is not perfect". I am sure it is not news to you that no data is perfect. Some data, however, are (much) better than others. If "good" data show a trend, then "good data show a trend", and "poor" stations should be transformed into "good ones" at once, to contribute to the analysis of the trend. If somebody wants to use "poor data", they should therefore show how the "poor data" can be transformed into "good data". Unless that is done, there is as little meaning in using "poor data" to understand warming trends as in issuing speeding tickets with the use of an incorrectly-placed traffic enforcement camera. No court of law would allow those tickets, no scientist should concern about the "poorly sited" data. -
CBDunkerson at 01:14 AM on 1 September 2010The surprising result when you compare bad weather stations to good stations
omnilogos #19, you just really can't understand can you? "I find it ironic to discover how people worried about temperatures trending upwards show no interest whatsoever in getting those trends right" No. False statement. Everyone here is absolutely interested in getting the temperature trends right. You just can't seem to understand that your objection about thermometer citing is irrelevant to that issue. Here, try a simple thought experiment. Let's say in your yard you put a thermometer out on the black asphalt driveway under direct sunlight and another one in the most heavily shaded area you can find. Two thermometers less than a hundred feet apart, but they are going to show significantly different ABSOLUTE temperatures. Which is 'right'? Both of them are correct for the location they are in. Neither would meet the 'station siting guidelines'. Yet both are perfectly valid for measuring TRENDS. As the day gets hotter BOTH thermometers will register higher temperatures. The absolute temperature readings will differ, the trends over time will not. -
omnologos at 01:06 AM on 1 September 2010The surprising result when you compare bad weather stations to good stations
@doug_bostrom: if you were right, then there would have been no point in Jim Meador posting this blog at all. Personally, I find it ironic to discover how people worried about temperatures trending upwards show no interest whatsoever in getting those trends right (in a scientific sense). Imaging going to see the doctor if your concern is blood pressure, only to accept the diagnosis even if the sphygmomanometer has been obviously used incorrectly. Worse: imagine going to see 100 doctors, all making mistakes in measuring your blood pressure, only to conclude there must be something wrong because they all said so. Sanity means discarding the opinion of poorly-trained doctors. All of them. Actually, the entire "body" of modern science is based on maths, therefore on numbers, therefore on measurements. Hence, incorrect measurements can only lead to incorrect science. A "poorly sited" station is a serious issue, and the untold number of hours spent by Galileo in getting his measurements right were not a waste of time. Once again: maybe the USHCN guidelines don't matter, regarding warming trends. I am not excluding that possibility. All I am stating is that somebody should show that _that_ is the case. If it is instead considered as an assumption _because of_ the trends, we are in the realm of circular reasoning. -
michael sweet at 00:47 AM on 1 September 2010The surprising result when you compare bad weather stations to good stations
Another issue relating to Omnilogos questions is what should we do with data that is not perfect? Obtaining 100 years of temperature data is an immense amount of time and effort. Deniers would have us discard all this data because it might have some small flaws. Scientists generally try to correct the record and/or make the best use that they can of the existing data. It makes no sense to throw data away when it can be corrected. As this example shows, the "bad" data replicates the "good" data. -
Doug Bostrom at 00:37 AM on 1 September 2010The surprising result when you compare bad weather stations to good stations
Absolutely pointless to say it, but a thermometer does not have to produce an absolute, accurate or precise reading in degrees anything to identify a trend. We have a vast network of thermometers we can view for this purpose without referring to units at all. This network indicates an upward trend in temperature. This is not very complicated, really. The same network used to produce absolute temperature indications can be exploited for a different purpose, to identify a trend. The trend application benefits in some ways from being expressed in units but actually only needs to be assessed from the perspective of proportionality to derive a useful conclusion. Perhaps the solution is to avoid referring to these instruments as thermometers in this context so as to avoid igniting neurotic obsessions. How about "bulk caloric trend indicator?" But, as I say, pointless to mention it down here. Fortunately normal people who are simply looking for a simple explanation of what's going on the world will not make their way down here into the deep dark, where omnologos is prattling away about guidelines. -
CBDunkerson at 00:28 AM on 1 September 2010The surprising result when you compare bad weather stations to good stations
omnologos #15, they have this little handbook which says, 'for best results place your thermometer in an area like this'. Watts decided those were 'guidelines' or 'criteria' and any site which did not meet all of them was 'bad'. All of which is completely irrelevant as those instructions were meant to limit any sort of error in ABSOLUTE temperature measurements... whereas the global anomaly values are based on RELATIVE change in measurements over time... which aren't impacted by most of the siting issues Watts (and now apparently you) obsessed about... as subsequent studies have proved repeatedly. -
omnologos at 00:24 AM on 1 September 2010The surprising result when you compare bad weather stations to good stations
@Tom Dayton: I was quoting @Dappledwater. In fact, I used quotes 8-) and prefer "poor" to "bad" anyway. Let's go back to the root of the problem here: what are those guidelines about if we are to take on "poorly sited" measurement systems in a cavalier manner? -
CBDunkerson at 00:22 AM on 1 September 2010Climate's changed before
bobconsole, actually many of the 'think tanks' (i.e. propaganda units) disputing global warming also insisted that cigarettes do NOT cause lung cancer. Go figure. -
Doug Bostrom at 00:18 AM on 1 September 2010Sea level rise: the broader picture
Is the article wrong, or did you unconsciously inflate it because you thought that it had to fit the ballpark figure you had in your mind. Is this a case where failing to focus on tiny portions of data might lead to false conclusions? "Focus on tiny portions of data." Too funny in light of more recent posts. I'm flabbergasted that folks are able to view a graph such as the Church display in the "basic" article above and end up rattling down a funnel of perspective to become entirely obsessed with a single tide gauge or a particular region of the world. You and Miekol could inoculate yourselves from appearing so stubbornly myopic by actually reading things such as the paper I cited for Peter, above: Closing the sea level rise budget with altimetry, Argo, and GRACE Instead, chanting over a web page from the Queensland maritime safety agency works better for maintaining ignorance. You really, really do -not- want to see the large picture, it seems. Sorry, JohnD, I've got a major bout of sciatica going on, I'm on Torquemada's rack right now. I goofed my decimal points. Gasp! I'ts a plot! Doug Bostrom is controlling a global network of oceanographers but has been exposed when he flubbed a coverup! Congratulations, and thanks especially for helping to illustrate a case example of what I was referring to above, the synthesis of misleading and pointless distractions. Beyond helping. -
CBDunkerson at 00:15 AM on 1 September 2010Urban Heat Islands: serious problem or holiday destination for skeptics?
RSVP, presumably because it varies, this is a 'basic' writeup, and the urban - rural anomaly is completely irrelevant? As the article explains, absolute temperature of any given location doesn't impact anomaly readings... we are looking at the change in temperature over time, and that is consistent between urban and rural locations. You might as well ask why not list the difference in temperature between Nome and Miami? Because that is no more irrelevant than the urban vs rural difference you ask for. -
RSVP at 00:10 AM on 1 September 2010Urban Heat Islands: serious problem or holiday destination for skeptics?
"...results in a slightly warmer envelope of air over urbanised areas when compared to surrounding rural areas.." Why not express this in degrees centrigrade? -
Tom Dayton at 00:03 AM on 1 September 2010The surprising result when you compare bad weather stations to good stations
No, omnologos, the definition of a "bad" site does not mean the site fails to correctly measure anything. The siting guidelines do not even include the label "bad." The label "bad" was invented by Watts to exaggerate the shortcomings of some stations, in Watts's desperate attempt to discredit AGW. -
omnologos at 23:49 PM on 31 August 2010The surprising result when you compare bad weather stations to good stations
@adelady and @Dappledwater: I understand my description of the logical issue is too short and cryptic. I will try to reformulate it. Basically if a measurement site needs to follow certain guidelines, then if it doesn't follow those guidelines it should not be included with those sites that do follow those guidelines. Or alternatively, if those guidelines are shown not to matter, then what is the point of the guidelines in the first place? "The warming signal is so significant it shows up in both good and bad sites" is not an answer: if a site is "bad", then by definition it does _not_ correctly measure anything. Same regarding "consistent measurement": a consistently-bad measurement is consistently wrong, again by definition. If a trend appears and it is "right", it's just pure luck with no scientific value or basis (unless, once again, somebody is able to show that the guidelines really don't matter). The above is valid for any measurement setting, not just temperatures. Hopefully nobody wants to destroy the foundations of "measurement science" this side of Galileo. -
bobconsole at 23:34 PM on 31 August 2010Climate's changed before
Lung cancer existed before cigarettes were invented too. Does that fact invalidate cigarette induced lung cancer? -
Rob Painting at 23:28 PM on 31 August 2010Sea level rise: the broader picture
Ken, that set of posts was entertaining. And yet here you are still banging on the same old drum. -
Ken Lambert at 23:10 PM on 31 August 2010Sea level rise: the broader picture
And lo and behold: Here's the quote from #42: "Chris and I have debated the TOPEX - Jason satellite transition - and if the two trends are linearized - there is a flattening in the Jason record closer to 2.0mm than 3.2mm per annum often quoted over the combined record. There is also the probably of an offset error in the transition." -
The empirical evidence that humans are causing global warming
Unrecovered - Exactly, I was talking about the transient state. However, given the thermal inertia of ocean warming, that transient can last for a long time... The 0.9 W/m^2 is on the edge of measurement tech right now, but the difference in emission spectra is measurable and clear. And, very importantly, indicates that conditions on Earth have to change in order to radiate the same amount of energy as before that spectral change (reduction), primarily by warming up. -
Rob Painting at 23:08 PM on 31 August 2010The surprising result when you compare bad weather stations to good stations
Omnologos @ 10 - "The graphs show there is something effecting an upwards trend in both "well sited" and "poorly sited" stations." Yes, global warming. The warming signal is so significant it shows up in both good and bad sites. A more interesting question is why the bad sites show less warming, which is why you should read the intermediate version here -
Ken Lambert at 22:56 PM on 31 August 2010Sea level rise: the broader picture
BP #19 Another interesting post. We dealt with the Jason-Topex in the 'Astronomical Cycle' thread here: http://www.skepticalscience.com/news.php?p=3&t=141&&n=232 I came up with a similar flattening of Jason and an offset between the two linear trends of Jason and Topex from a pencil and ruler analysis. -
adelady at 22:54 PM on 31 August 2010The surprising result when you compare bad weather stations to good stations
omnologos Correct measurement of temperature isn't the prime requirement for climate trends. Consistent measurement is the important issue. For climate trends we're only interested in the change in temperatures rather than the temp itself. That's why it's important when a new and better thermometer is installed at a site, the first thing that is done is to note the records accordingly. The new temperature recordings mustn't be allowed to falsely show a change in actual temperatures. -
muoncounter at 22:51 PM on 31 August 2010Human CO2: Peddling Myths About The Carbon Cycle
#14: "there is far greater capacity to sequester CO2 than is fully realised. " If, by sequester, you mean temporarily house within the plant growth for half of the annual cycle. Take those cycles out and you're still left with an uptrend -- which is not, as far as I can see, part of the annual cycle. What is left that is also increasing from year to year and is also the right multiple of the annual atmospheric increase?
-
Rob Painting at 22:34 PM on 31 August 2010Sea level rise: the broader picture
JohnD - note the familiar figures (although unrelated) , from Church et al 2006: Sea level rise around the Australian coastline and the changing frequency of extreme sea-level events "Australian sea-level records for the period 1920-2000 clearly indicate a rise in relative mean sea level. Averaged around Australia, the rate of increase is about 1.2 mm per year. This value is less than the global increase in eustatic sea level for two reasons. First, the sea-level rises presented here are relative sea level and do not include any correction for ongoing crustal motion. To estimate eustatic sea-level change from the data from the Australian sites, the rates of sea-level rise would typically need to be increased by about 0.3 mm per year. Second, at least for the period 1950 to 2000, sea-level rise off western Australia less than the global average (Church et al. 2004), possibly as a result of the trend to more frequent, persisent and intense ENSO events since the mid-1970s." -
omnologos at 22:28 PM on 31 August 2010The surprising result when you compare bad weather stations to good stations
This poses a logical issue. The graphs show there is something effecting an upwards trend in both "well sited" and "poorly sited" stations. But if "poor siting" doesn't matter, _either_ the USHCN guidelines are useless/unimportant for a correct measurement of temperatures and there is no such a thing as "poor siting" (i.e. "warming" can be detected whatever the quality of the siting) _or_ the USHCN guidelines are useful/important for a correct measurement of temperatures, and therefore the upwards trend can't be ascribed to an actual "warming". ?? -
Rob Painting at 21:52 PM on 31 August 2010Sea level rise: the broader picture
Almost forgot, these guys also found: An Anomalous Recent Acceleration of Global Sea Level Rise Some quotes: "If the early twentieth-century acceleration is global in scale, we speculate that it differs from the recent acceleration in that the Northern Hemisphere apparently contributed significantly to the early event but little to the recent event." BP take note of the above. "1) the global sea level rise rate has accelerated from 1.5 mm yr prior to 1990 to a present day rate close to 3.2 mm yr" & "2) the acceleration in global sea level is accounted for primarily by the tropical and southern oceans, because of a phase change in the way the two regions covary: out of phase during relatively steady global sea level trends, and in phase during the trend increase" Which gels with the satellite altimetry and Seaframe stations mentioned in Ned's post @ 38. -
johnd at 21:43 PM on 31 August 2010Sea level rise: the broader picture
Dappledwater at 21:09 PM, the article referenced was about the establishment of the Tidal Reference Frame For Queensland. It utilised the established rate of sea level rise averaging 0.0003 metres, 0.3mmm per annum for the Australian continent (Mitchell, 2002). It detailed the implementation of the tidal datum epoch (TDE) which is the interval recommended for the calculation of datums. The TDE is normally longer than 18.6 years in order to include a full lunar nodal cycle, so looking for trends should only be looked for over multiple TDE's. From another source, the Permanent Committee for Tides and Mean Sea Level (PCTMSL) recommended that a 20-year TDE, 1992-2011 inclusive, be adopted for the determination of Lowest Astronomical Tide and Highest Astronomical Tide, so you see we are not at the end of that period yet. -
CBDunkerson at 21:26 PM on 31 August 2010Can humans affect global climate?
Singer is the worst of the worst. Cigarettes are not harmful. Asbestos is good for you. Acid rain does not exist. There is no ozone hole. Name a just plain crazy wrong 'scientific' position of the last thirty years and chances are he has been one of its prime proponents. That said, the statement quoted above is classic Singer. Pretty much everything he says takes some minor element of 'truth' and uses it as the foundation for a complete lie. In this case, "one-twentieth of a degree by 2050" is an extremely low, but not completely impossible, estimate while "imperceptible effect on future temperatures" is an outright lie. This is because most of the warming between now and 2050 is already 'locked in'. Complying with the Kyoto benchmark (1990 emissions levels by 2012) and sticking to that level would very likely have more than a 0.05 C impact on the 2050 global temp anomaly, but it would also mean at least 1 C difference in 2100 and even more further out. -
Ned at 21:10 PM on 31 August 2010Sea level rise: the broader picture
Miekol writes: Is science sea levels different to island sea levels? and links to Jo Nova's website, where Ms Nova writes about sea level data measured at a network of stations on various South and Southwest Pacific islands. We discussed that network of stations recently in another thread. If you ignore Ms Nova's selective and misleading analysis, and look at the full data for all of the islands in the network, you will find individual trends ranging from +3.2 to +8.6 mm/year (ignoring one outlier of +16.8 mm/year). The mean is +5.4 mm/year and the median is +4.9 mm/year. This compares very well with the satellite-derived sea level trend, which is only +3.3 mm/year (over the past two decades) for the world as a whole but higher in the Southwest Pacific. For some unfathomable reason, Ms Nova fails to quote the annual reports from this network of stations: The net sea level trends are positive at all sites, which indicates sea level in the region has risen over the duration of the project. The sea level rise is not geographically uniform but varies spatially in broad agreement with observations taken by satellite altimeters over a similar timeframe. [...] The sea level trends from SEAFRAME stations are mostly higher than the global average rate, but this is consistent with higher rates in the southwest Pacific measured by satellite altimeters -
Rob Painting at 21:09 PM on 31 August 2010Sea level rise: the broader picture
JohnD - I didn't understand at all what his original post was about. As far as Australia is concerned the trend is lower than the global average as at 2003 it was 0.9 mm (1.2mm when two outlier stations were removed) per year from a 25 year record of 32 sea level stations around Australia. Australian Mean Sea Level Survey 2003 National Tidal Centre Bureau of Meteorology At the BOM site you'll find the Australian Baseline Sea Level Monitoring Project, however it's only been running since the early 90's, Here's their latest annual report: ANNUAL SEA LEVEL DATA SUMMARY REPORT JULY 2008 - JUNE 2009 You'll have to google the first link, it's not working. -
huntjanin at 20:58 PM on 31 August 2010Sea level rise: the broader picture
I'm compiling a list of "sea level poster-children," by which I mean cities that are now facing or in the future will face problems due to the rising seas. This list now includes about 35 cites, located in 17 countries. It is too long for use in my book on sea level rise, so I want to cut it down. Please feel free to give me your own candidates for "sea level poster-children." -
michael sweet at 20:57 PM on 31 August 2010The surprising result when you compare bad weather stations to good stations
It is known that sometimes the adjustments for urban heat island introduce biases into the trend. They compare urban stations to nearby rural stations. If the urban station shows more increase they adjust it lower. If the urban station shows less increase they keep it. You would expect some urban station to be higher just by chance. This causes the adjusted values to underestimate the warming. Deniers claims that adjustments raise the trend are false. I think they do the adjustments in an attempt to get the best information possible. As pointed out above, the trend is much larger than the adjustments so it really doesn't matter much. -
johnd at 20:21 PM on 31 August 2010Sea level rise: the broader picture
Dappledwater at 20:16 PM, do you have the records for Australia which would be relevant to what Meikol posted about originally? -
Rob Painting at 20:16 PM on 31 August 2010Sea level rise: the broader picture
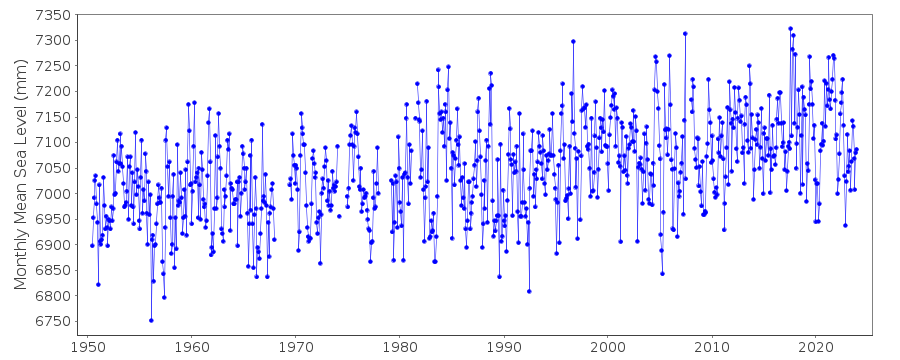
Scarping the bottom of the barrel huh Meikol?, Jo Nova?. From GLOSS, here's Suva, Fiji: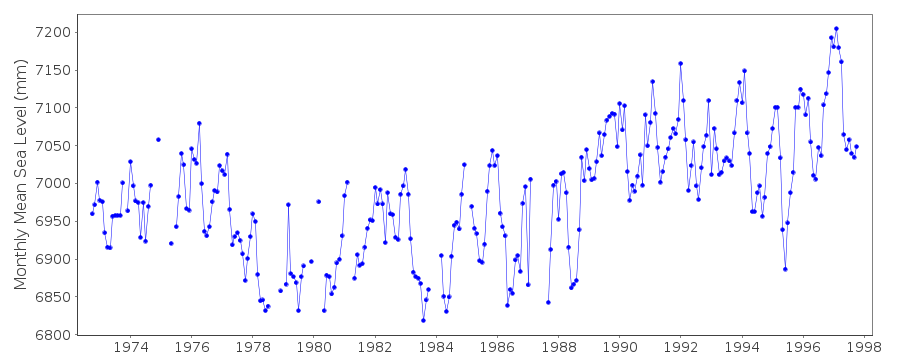 Marshall Islands
 American Samoa
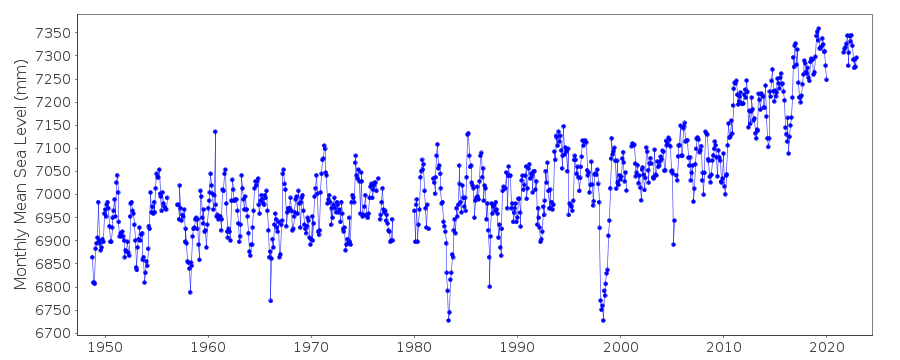 Looks like more than a bit of sea level rise since 1993 to me. Of course if you remove the "anomaly", the sea level rise - like Gray has, of course you won't see any sea level rise!.
-
JMurphy at 20:12 PM on 31 August 2010Sea level rise: the broader picture
miekol wrote : "Is science sea levels different to island sea levels?" Don't know what that means but science at Joanne Nova's site (which you have just linked to) is different from science in reality. See : How Jo Nova doesn't get past climate change, How Jo Nova doesn't get the CO2 lag, How Jo Nova doesn't get the tropospheric hot-spot, A Scientific Guide to the Skeptics Handbook. Is that the best you can do ? -
johnd at 20:06 PM on 31 August 2010Sea level rise: the broader picture
miekol, mariners operate in real world conditions ;-) -
Argus at 20:04 PM on 31 August 2010Arctic sea ice... take 2
doug_bostrom, After a long series of insinuations and subjective guesswork on your side, about the real "meaning" of my words, you finally approach at least one of the topics I wanted to have a discussion around. That's good. But was all your arrogant language necessary? If I bring up facts not covered in the top post, does that imply that I "want to create an impression of doubt"? Would you thus like to exclude everyone who doesn't agree with you or the post author, from asking questions? Is it wrong to "wonder"? Do I also have to provide all the answers to be allowed to write comments? I certainly am "interested in improved understanding", why else would I bring up matters not discussed yet, and ask questions not answered yet? What is wrong with "leaving the question hanging in the air"? Again, do I have to have the answer as well, before I comment? And I still wonder why your revered Arctic report adresses only heat input, and not heat output. -
miekol at 19:31 PM on 31 August 2010Sea level rise: the broader picture
Is science sea levels different to island sea levels? http://joannenova.com.au/2010/08/south-pacific-sea-levels-no-rise-since-1993/ -
miekol at 19:28 PM on 31 August 2010Sea level rise: the broader picture
Sorry I didn't realize mariner sea levels are different to science sea levels.
Prev 2217 2218 2219 2220 2221 2222 2223 2224 2225 2226 2227 2228 2229 2230 2231 2232 Next


