


 Arguments


Recent Comments
Prev 2268 2269 2270 2271 2272 2273 2274 2275 2276 2277 2278 2279 2280 2281 2282 2283 Next
Comments 113751 to 113800:
-
nhthinker at 11:07 AM on 2 August 2010On Consensus
A good science teacher needs to impress on students the differing levels of certainty available from various fields of science. Physics relies directly on mathematical modeling; can perform controlled experiments with testable predictions over thousands or millions of trials; can make predictions of locations of planets hundreds and thousands of years in advance with highly accurate precision. Medical science performs thousands and millions of tests and trials and measures whether outcomes match predictions. Life spans are small enough and there are millions of human subjects such that predictions are relatively easily tested without great risk of life by staging trials with a small number of subjects before exposing the entire human population to risk. Climate science is in a relative infancy when compared to physics or medical science. The ability to do controlled tests is non-existent as Earth Climate is not a closed system. The Earth is a massive thermal dynamics experiment with most of the heat for climate stored in deep oceans. Twenty years ago deep water was not part of any climate modeling. I think climate scientists are on the right track. But we still don't know the inter-workings of much of the sub-surface. Students should understand: Physics is a 5 Medical Science is a 4.8. One expects 99.999999% accuracy from physics. One expects 60-99% accuracy from medical science. Doctors still have difficulty predicting which treatments will work on which patients and doctors may need to try different prescriptions to determine which will work for them. Climate Science has yet to make a testable prediction with any sort of mathematical accuracy. By accuracy, I mean a series of predictions that reflect at least a 90% accuracy on a global basis. Until then, Climate Science hovers around a 3 or a 4. The teacher really needs to focus the student on the fact that "Science" requires a stated hypothesis, a future prediction and testable and tested results. Climate science is no where near the certainty of the harder sciences. Advocating that Climate science is actually a 5? That is clearly dogma, not science! -
Bern at 10:41 AM on 2 August 2010On Consensus
Doug, you're too quick! I was just about to post that response to handmjones @ #1. This reflects on both the previous post and this one - with many skeptics out there, it's about communication. They have read or heard a little bit of stuff, and comments like "CO2 lags temperature" seem to neatly explain the denialist position. Sadly, very few of them then go searching for more information to see what the science actually says on that (which highlights the problem in the recent post about so-called 'balanced' media coverage). handmjones is actually way ahead of the curve here - he/she is reading a website that reports and discusses the actual science behind the statements. Well done on making it this far, and enjoy the learning experience - as much as is possible while finding out about the approaching train-wreck that is global warming... -
Doug Bostrom at 10:35 AM on 2 August 2010On Consensus
Ice ages, C02 etc. are tractable and in any case are not analogous with the present situation. See CO2 lags temperature - what does it mean?, On temperature and CO2 in the past, The significance of the C02 lag for some more information -
Doug Bostrom at 10:28 AM on 2 August 2010On Consensus
For some reason I'm thinking of the Tour de France. You've got your peleton (NAS summary, IPCC), your leaders and attackers (domain-specific researchers just reaching the bottom of the Greenland ice sheet, etc. and competing to get ahead of everybody else) as well as those who've been dropped but are still being encouraged by coaches to pedal a little harder and try to catch up. -
handmjones at 10:27 AM on 2 August 2010On Consensus
The turn from cooling to warming during the last ice age and the turn from warming to cooling before that are the major events which should be used to back check the models. Certainly these weren't caused by carbon dioxide as the temperature turned up first.Response: The switch from ice age to interglacial (and vica versa) are not initiated by carbon dioxide but by changes in the Earth's orbit. For example, around 20,000 years ago, the Earth's orbital configuration was such that there was more sunlight hitting the South Pole at spring time. This caused warming in the Southern Ocean which led to outgassing of carbon dioxide which both amplified the warming and spread it to the north. This is why CO2 lags southern temperatures. But importantly, northern temperature also lags southern temperature - and northern temperature matches CO2 closely. Here are more details on the CO2 lag...
So the CO2 record is entirely consistent with the warming effect expected from CO2. Of course, you don't have to go back into the Earth's deep past to work out whether CO2 causes warming - satellites directly observe CO2 trapping more heat over the last few decades. -
chris at 10:01 AM on 2 August 2010Abraham reply to Monckton
citizenschallenge at 09:33 AM on 2 August, 2010 Not sure exactly what you need, but you can read the Court Proceedings here: England and Wales High Court (Administrative Court) Decisions and the science context is quite well described in RealClimate and Deltoid posts. -
Daniel Bailey at 09:59 AM on 2 August 2010Visually depicting the disconnect between climate scientists, media and the public
Re: huntjanin at 00:46 AM on 2 August, 2010 While I applaud consideration of Bangladesh, the Netherlands and Nigeria (due to the millions of people to be impacted), no nation will be more impacted by the coming rising waters than the Maldives or Tuvalu. Maldives, population 396,334 Elevation above sea level 2.3 meters or 7'7" Tuvalu, population 12,373 Elevation above sea level 4.5 meters or 15' These two nations will lose all that they are due to either the loss of the Greenland ice sheet or the WAIS, or a moderate combination of the two. They will be a footnote to history...and to man's indifference to man. The Yooper -
citizenschallenge at 09:33 AM on 2 August 2010Abraham reply to Monckton
Hello folks, I've been going over Monckton 466 questions to Professor Abraham and watching his 9-14-9 presentation - quite an amazing exercise creative thinking, writing, character attacks and worse. My goal is to write a little more about it but I'm look for some background I'm not finding. Is anyone out there familiar with the UK law suit against Al Gore, its process and results. All I seem to come up with is from the AGWHoax community and somehow I imagine there is a lot being left unsaid. Also, does anyone know of someone serious who has gone head to head with SPPI's "35 Inconvenient Truths: The errors in Al Gore’s movie" http://scienceandpublicpolicy.org/monckton/goreerrors.html Any help would be appreciated, Peter http://citizenschallenge.blogspot.com citizenschallenge.pm{at}gmail -
Berényi Péter at 09:16 AM on 2 August 201010 key climate indicators all point to the same finding: global warming is unmistakable
Understood. See the rest at that thread.Moderator Response (to #50 Berényi Péter at 22:58 PM on 29 July, 2010): This level of detail and sheer space consumption does not belong on this thread. Put future such comments in the Temp Record Is Unreliable thread. But if you post too many individual station records, I will insist that you instead post summary statistics. -
Berényi Péter at 09:14 AM on 2 August 2010Temp record is unreliable
Understood. However, it is much more work to produce correct summary statistics and it is also harder for third parties to check them. I would like to make it as transparent as possible. At this time I am only at the beginning of this job and just trying to assess the approximate width and depth of the issue. So let me show you just one more station.Moderator Response (to #50 Berényi Péter at 22:58 PM on 29 July, 2010 under 10 key climate indicators all point to the same finding: global warming is unmistakable): This level of detail and sheer space consumption does not belong on this thread. Put future such comments in the Temp Record Is Unreliable thread. But if you post too many individual station records, I will insist that you instead post summary statistics. It's Baker Lake, Canada, Nunavut.
It is pretty interesting, because at this site GHCN v2 has common coverage with Weather Underground for two periods, from November, 1996 to March, 2004 and another one from December, 2005 to May, 2010 with very few breakpoints in each.
The difference in adjustment to GHCN raw data relative to the Weather Underground archive before and after 2005 is 0.91°C.
What is the problem with this site?
It's Baker Lake, Canada, Nunavut.
It is pretty interesting, because at this site GHCN v2 has common coverage with Weather Underground for two periods, from November, 1996 to March, 2004 and another one from December, 2005 to May, 2010 with very few breakpoints in each.
The difference in adjustment to GHCN raw data relative to the Weather Underground archive before and after 2005 is 0.91°C.
What is the problem with this site?
 As we can see, temperature is decreasing sharply, even if the +0.91°C correction after 2005 is added (yellow line).
Therefore it was best to remove it from v2.mean_adj after 1991 altogether. The extreme cold snap of 2004/2005 is removed even from the raw dataset.
As we can see, temperature is decreasing sharply, even if the +0.91°C correction after 2005 is added (yellow line).
Therefore it was best to remove it from v2.mean_adj after 1991 altogether. The extreme cold snap of 2004/2005 is removed even from the raw dataset.
-
Doug Bostrom at 09:04 AM on 2 August 201010 key climate indicators all point to the same finding: global warming is unmistakable
Stmwatkins if you've not run into it before take a look at Spencer Weart's book (full text online). It has a useful history of GCM evolution and includes many references to deeper treatment via papers and the like. -
stmwatkins at 08:58 AM on 2 August 201010 key climate indicators all point to the same finding: global warming is unmistakable
Re 117 & 118 Thanks Daniel and Chris for the reply. My job is the development of physics based simulation codes (generally non Finite Element). I do not pretend any real knowledge of the GCM's that are currently being used and can not comment on them one way or another. But that does not mean that I trust them, without a peek under the hood (and in my opinion neither should you). Once I find out a few more things, I may post a question on the Are the models reliable thread. ThanksModerator Response: Thank you for recognizing that there are appropriate and inappropriate posts for comments! Most people assume that if initial discussion of a topic is appropriate for a given thread, that continued comments into excruciating detail also are justified on that same thread. Instead, we allow only the initial conversations to be on the original thread but then try to push detailed discussions to the more appropriate, specialized threads. -
Doug Bostrom at 08:48 AM on 2 August 20101934 - hottest year on record
Worth noting also, the first day a thermometer is in operation it'll record its first record high. Records will continue to smashed with decreasing frequency in that location. Same deal with a network of thermomeners covering an entire state; most record-breaking years will be found early in the history of the network. I'm left surprised that a state record should be broken as late as 2003. Here's a more sophisticated way of looking at the issue, looking at Meehle 2009. -
Tom Dayton at 08:16 AM on 2 August 20101934 - hottest year on record
Broadlands, you have missed the main (really, the entire) point of this post: The U.S. is only 2% of the globe. "Global warming" by definition means the whole 100% of the globe. So your point is pointless. Nobody is going to argue with you, because it doesn't matter--at all. -
Broadlands at 08:10 AM on 2 August 20101934 - hottest year on record
The hottest year in the U.S. was 1921. 1934 was second. The average temperature for the 48 contiguous states in 1921 was 55.6°F. To confirm this one can read the first paragraph of THE WEATHER OF 1940 IN THE UNITED STATES (W.W. Reed) or THE WEATHER OF 1942 IN THE UNITED STATES (J.L. Baldwin). http://docs.lib.noaa.gov/rescue/mwr/069/mwr-069-02-0049.pdf http://docs.lib.noaa.gov/rescue/mwr/070/mwr-070-12-0271.pdf The average temperature in 1934 was 55.1°F. The original temperature measurements published each month for each state for those years by the U.S. Weather Bureau will add up correctly. BTW... Two-thirds of the state record high temperatures in the U.S. were recorded before 1955. More than half were recorded from 1921-1934. None has been recorded since 2003. Yes, it is warming today, but it also did so during the first half of the last century... and at about the same rate. -
Marcel Bökstedt at 08:05 AM on 2 August 201010 key climate indicators all point to the same finding: global warming is unmistakable
Geo guy> (1) The estimate of historical solar output does not come from our observations of the sun, they come from astronomical data. By observing many stars that are generally similar to the sun one can build up a good picture of the evolution of a star with the general characteristics of our sun. One obtains rather sophisticated models, which are consistent with astronomical observations. Using these models, one can compute the outgoing radiation as a function of time. The solar output during the ordovician is estimated by this function (I think). (2) I do not understand why plant stomata are a good proxy for CO2 level. Is there some study underlying this? Can you give a link? -
kdkd at 07:40 AM on 2 August 2010Visually depicting the disconnect between climate scientists, media and the public
Poptech #15 This comment doesn't stand up to scrutiny. Science is not a democratic process, it's a process that is lead by evidence. Your argument appears to be leading to the erroneous conclusion that expertise in one subfield of a discipline equates to expertise in all subfields of a discipline which is clearly erroneous. #16 Here's a nice example of the Dunning-Kreuger effect in action. My area of expertise happens to be within the social sciences, and I have completed a number of literature surveys over the past few years, so I know that the kind of 100% comprehensive, no error survey that you're demanding is impossible to achieve. Because of this I know that I'd need to read the Anderegg paper quite closely, and consider the presentation of the results quite carefully before coming to any conclusion about it. I certainly wouldn't rush to the conclusion that "the study is worthless due to Google Scholar illiteracy and Cherry Picking" without a careful justification of why. Besides, skimming the paper tells me that you're misreporting the methodology. I suggest that if you knew more about how this kind of quantitative social science research is conducted (along with basic concepts like sampling and probability) then you'd understand that the Andreagg paper provides a reasonable estimate of expert consensus. We also see from your previous post that your concept of expert is seriously flawed anyway. -
chris at 06:52 AM on 2 August 201010 key climate indicators all point to the same finding: global warming is unmistakable
Geo Guy at 06:33 AM on 31 July, 2010 Scotese graph It should be obvious Geo Guy that one cannot assess CO2-temperature relationships in the deep past from a crude sketch of a model of CO2 levels with a 10 million year temperature resolution, and a crude indication of temperature with an unspecified provenance and resolution. It's a nobrainer that we can only assess temperature-CO2 relationships from data where we have contemporaneous proxy CO2 and proxy temperature data. Since we have a huge amount of this data it would be daft not to use it to inform our understanding! Ordvician solar luminosity As Daniel and KR have pointed out, it's completely uncontroversial that our sun has evolved from its creation with a a progressive increase in solar outputs. 400-odd million years ago during the Ordovician the solar constant was around 4 % lower than now. Any of our theories of natural phenomena, whether contemporary or in the past, have to accommodate basic and well-established knowledge. thermodynamics of melting ice A 1 oC global temperature increase corresponds to a 2 oC or more raised Arctic temperature. As time progresses the temperature will continue to increase. We're already directly measuring increases in the rate of loss of Greenland polar ice mass and increased sea level rises. Therefore there must be something wrong with your "thermodynamic" argument. Obviously if your theory (1 oC of temperature rise can't cause large scale ice melt) doesn't accord with extant reality there must be something wrong with your theory. Of course we know that if one puts a block of ice in a chamber at a temperature 1 oC below the freezing temperature, and then raises the temperature to 1 oC above the melting temperature, all the ice will eventually melt. Likewise, in the real world those parts of polar and mountain glaciers that have historically been in an environment that averaged a temperature just below freezing point, and are now in an environment that averages a temperature a little above freezing point, will be melting. That's also a no-brainer. The real world is a little more complex. But thermodynamics cannot be by-passed... -
Marcel Bökstedt at 06:29 AM on 2 August 2010The Past and Future of the Greenland Ice Sheet
Very good overview. I was wondering about the following. The most credible model forecast seems to be the one due to Stone etc. However, according to Bell (the paper was discussed in an earlier, equally interesting guest post by Robert Way), subglacial water plays an important role "lubricating" the glaciers, increasing the ice flow. I get the impression that such effects are not included in the model studied by Stone et. al. Maybe this is related to their statement that "Current ice-sheet models lack higher-order physics". If Bell is right about the importance of sub-glacial liquid water, this could mean that Greenland would loose even more ice than Stone thinks. -
Daniel Bailey at 06:20 AM on 2 August 201010 key climate indicators all point to the same finding: global warming is unmistakable
Crap, Chris beat me to it (must be a better typist than me). Sorry for any overlap! The Yooper -
Daniel Bailey at 06:19 AM on 2 August 201010 key climate indicators all point to the same finding: global warming is unmistakable
Re: stmwatkins at # 115 at 01:33 AM on 2 August, 2010 above: Let me see if I'm understanding you correctly: You base your reservations about accepting that humans are raising the global temperatures due to their fossil fuel burning (which injects massive qualities of long-sequestered CO2 into the worlds carbon cycle) because of a lack of faith in GCMs? GCMs are simply physics-based mathematical models which can be computed by pencil and paper by anyone with an understanding of the base mathematical concepts involved. There's no big mystery to them. The fact that everyone uses a computer to run them on is to simply save time. Model runs taking hours on a supercomputer would take months or more if computed by hand (and without the human-induced math errors). Are you aware of the predictive power of GCMs? GCMs have been correctly predicting many of the effects we are experiencing today. Real Climate has a nice topically recent (and convenient for our illustrative purposes) post on Wally Broecker. Back in the old days, On 8 August 1975, Wally Broecker published a landmark study on global warming, using some of the first GCMs, in which he predicted the rises we've seen today in both rising CO2 concentrations and the expected global temperature response. Thus, with a predictive ability from 35 years ago, to adequately predict what we have seen today, it seems clear that GCMs have a strong predictive power to model temperature responses due to rising CO2 concentrations. If your contention was that it's not the CO2 that humans release that's causing the temperature response, well that dark corner has been illuminated. Check out the text between Figure 2 and Figure 3 on this page here. Most people seem to find AGW overly complex (sometimes frustratingly so). But it really comes down to this: 1. Greenhouse gases warm the planet (else there would be no liquid water on the Earth), 2. CO2 is one of the, if not the most important, greenhouse gases (for many demonstrable reasons), 3. CO2 is rising, 4. The rising CO2 is driving global temperatures upwards (and the global temperatures are going up in a response appropriate to the well-understood radiative physics involved) as shown by multiple converging lines of evidence, 5. The increasing CO2 concentrations are known to come from fossil fuel emissions (from its isotopic signatures), 6. We humans are burning those fossil fuels; 7. Thus the human attribution to global temperature increases. I would like to thank you for your honesty and candor. It is both rare and refreshing to hear that from someone professing to be a skeptic. I'm sure that a mind open to science and logic will come to a proper evaluation. Thanks for caring enough to post a comment! The Yooper -
JMurphy at 06:17 AM on 2 August 2010The Past and Future of the Greenland Ice Sheet
O/T, but michael sweet's comment is numbered 20,000. Is that really the 20,000th comment ?Response: Why so surprised? You lot sure love to talk climate :-) -
chris at 06:13 AM on 2 August 201010 key climate indicators all point to the same finding: global warming is unmistakable
stmwatkins at 01:33 AM on 2 August, 2010 ”My main skepticism revolves around how much of the warming is anthropogenic, since much of this "appears" to determined by the GCM's. I am in the process of looking into this for myself.” Yes, one needs to come to one’s own conclusion about the evidence. I would say ‘though that the question of how much of the warming is anthropogenic has got very little to do with GCM’s. Our understanding of the earth temperature response to enhanced greenhouse forcing comes largely from theoretical and empirical understanding of the greenhouse effect and analysis of CO2-temperature relationships in the past [see e.g. R. Knutti and G. C. Hegerl (2008), which reviews the scientific evidence for climate sensitivity to CO2 forcing]. The attribution of contributions to 20th century and contemporary warming comes from independent analysis of greenhouse gas forcing, from expert analysis of solar contributions from a large number of solar scientists, from independent analyses of the (cooling) contributions from manmade aerosols and volcanos and so on [see e.g. Lean and Rind (2008) and Hansen et al (2005)]. The fact that this information is used to parameterize models doesn’t mean that our understanding of warming contributions comes from models. The value of models are (i) that they allow us to test the extent to which our understanding leads to verifiable predictions, and (ii) they allow us to test projections of future effects (e.g. warming) as a function of different scenarios (e.g. greenhouse gas emission scenarios). Otherwise models don’t really tell us anything that we don’t already know. The evidence simply doesn’t support a substantial solar contribution to warming over the 20th century. There has been no positive trend in solar parameters since the 1950’s and the last ~ 25 years has seen a reduction in the solar contributions (during the period of maximum warming). Without a positive solar contribution it’s pretty difficult to conjure up anything else that could give rise to the remorseful input of energy into the climate system during the 20th century and especially the last 30-odd years… R. Knutti and G. C. Hegerl (2008) The equilibrium sensitivity of the Earth’s temperature to radiation changes Nature Geoscience 1, 735 – 743. Lean, J.L., and D.H. Rind, 2008: How natural and anthropogenic influences alter global and regional surface temperatures: 1889 to 2006. Geophys. Res. Lett., 35, L18701. Hansen, J. et al. (2005) Earth's energy imbalance: Confirmation and implications. Science, 308, 1431-1435. -
JMurphy at 06:04 AM on 2 August 2010Visually depicting the disconnect between climate scientists, media and the public
robhon, don't you think it is rather ironic the way Poptech complains about these studies, given the methods he uses to include all sorts of publications in his little list of so-called anti-AGW studies, i.e. he believes them to be anti-AGW, no matter what the authors themselves state; and papers from 'Energy & Environment' are considered as worth the same as papers from properly peer-reviewed publications. -
Doug Bostrom at 05:24 AM on 2 August 2010The Past and Future of the Greenland Ice Sheet
No, I'm in Washington state; took that on Friday at the turnout on Stephens Pass. Duly noted; North Cascades should -not- look like Siskiyous, I could have been more explicit. Snow-free N. Cascades seem in keeping with predicted latitude migration of dynamic natural features. -
muoncounter at 05:03 AM on 2 August 2010The Past and Future of the Greenland Ice Sheet
#22: "muoncounter's photo looks more like mid-summer Siskiyou Mountains in southern Oregon" No, I'm in Washington state; took that on Friday at the turnout on Stephens Pass. Here's a link to their snow report for last season (68" below average). Flew over the Rainer area on this past Tuesday; not much summer snow up there either. Here's a webcam. Anyone doubting the severity of glacier melt should look at mspelto's website, especially the graph shown below.
-
johnd at 04:10 AM on 2 August 2010Waste heat vs greenhouse warming
Given the subject at the base of this discussion is electromagnetic radiation, perhaps going back to the very basics of EMR helps. From Wikipedia, "a travelling EM wave incident on an atomic structure induces oscillation in the atoms of that structure, thereby causing them to emit their own EM waves, emissions which alter the impinging wave through interference." It seems that it is irrelevant whether or not that the emitter "knows" the state of the external objects. What is relevant is that the external objects "know" their own state. -
Phil at 03:50 AM on 2 August 2010Waste heat vs greenhouse warming
If, for instance, stars radiated without a destination for each photon, there would be a photon clouds collecting in the furthest reaches of space. This of course is not the case.at This is sooo funny ! Of course, the clouds of photons that have no destination must be unseeable, because if you can see them then they have a destination (your detector). So you can't say they don't exist ! -
michael sweet at 03:47 AM on 2 August 201010 Indicators of a Human Fingerprint on Climate Change
I find it ironic that BP says we should discard Trenberth's careful, professional, peer reviewed estimate when he (BP) frequently says we should accept his amateur, back of the envelope, unreviewed calculations in the interest of advancing knowledge. In this case I think we should go with the peer reviewed estimates rather than throw up our hands and say our measurements have too much error, we know nothing. As better data becomes available we will have less error. One of the purposes of making such estimates is determining where to put effort at measuring the heat flux. While it is not possible for me to evaluate Trenberth's error, in my experience the first estimates of data often turn out close to the final estimates. When I look at past climate data estimates they are almost always conservative (they error on the cooling side, not the warming side). I expect this to be the case here also. -
Doug Bostrom at 03:47 AM on 2 August 2010Waste heat vs greenhouse warming
GHGs perform their effect by reducing the rate of loss of energy from an object or system enshrouded in GHGs. Failure to take on board that very basic phenomenon makes further discussion of the topic of AGW entirely pointless. RSVP, if you don't believe in that phenomenon you should consider heading over to Roy Spencer's website where he is actively teaching on the subject right now. -
canbanjo at 03:44 AM on 2 August 2010Visually depicting the disconnect between climate scientists, media and the public
Alexandre at 02:27 AM on 2 August, 2010 boykoff publications / links here: http://www.eci.ox.ac.uk/people/boykoffmax.php and the full anderegg paper is here: http://www.pnas.org/content/early/2010/06/04/1003187107.full.pdf+html -
Rob Honeycutt at 03:30 AM on 2 August 2010Visually depicting the disconnect between climate scientists, media and the public
I would suggest that Poptech's (#15 and #16) complaints against each of these papers are not reasonable. In relation to Doran 2009 the response rate of the questionaire would have no bearing on the poll results. The sample size is large enough to produce a margin of error of ~4%. That would not appreciably change the conclusion of the paper. The complaints against Anderegg 2010 are even more bizarre. Pure hearsay and speculation. If he wants to make a substantive case that the paper is in error he should at least make an attempt to reproduce the results and show where it is in error rather than just spouting off. -
michael sweet at 03:30 AM on 2 August 2010The Past and Future of the Greenland Ice Sheet
Angusmac, Looking at the data you posted, it is clear that the temperature in Greenland in 2006 is the same as it was in the 30's and 40's. Chris's quote shows 2005 as a record year, and it has been warmer than that in the years since 2005. The current trend now is clearly warmer. Model data give reasons for the high temperatures in the 30's and 40's. I think you are optimistic about the future of Greenland based on the data you posted. -
CBDunkerson at 03:07 AM on 2 August 2010September 2010 Arctic Ice Extent Handicapping Via ARCUS
Yep, extent can fluctuate wildly for any given volume / area of sea ice. The comment about this variability being greater now due to the ice being thinner is a very good point. Also, they've put up the July predictions;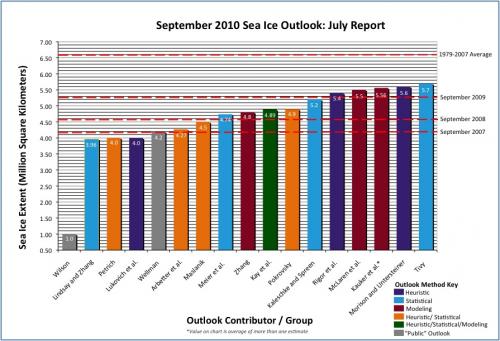 Interestingly, the accompanying writeup states that some of these went up due to the slower rate of decline at the start of July... indicating that they include data past the end of June though not exactly how much.
In any case, many predictions also went down and several now show a possible new record minimum. Interestingly, PIPS is now showing ice thickness and concentration both greatly below their 2007 values, but the extent is decreasing slightly more slowly. This again emphasizes the point about weather being such an important factor in determining extent. Even when the volume is significantly lower the extent can still be higher. Thus, it is really only a useful indicator on a decadal scale.
Right now it looks likely to come out a little higher than the 2008 (second lowest) value, but could theoretically still beat 2007. It doesn't seem likely that it'll be higher than the 2009 (third lowest) value, but some extreme weather shift could still cause that.
Interestingly, the accompanying writeup states that some of these went up due to the slower rate of decline at the start of July... indicating that they include data past the end of June though not exactly how much.
In any case, many predictions also went down and several now show a possible new record minimum. Interestingly, PIPS is now showing ice thickness and concentration both greatly below their 2007 values, but the extent is decreasing slightly more slowly. This again emphasizes the point about weather being such an important factor in determining extent. Even when the volume is significantly lower the extent can still be higher. Thus, it is really only a useful indicator on a decadal scale.
Right now it looks likely to come out a little higher than the 2008 (second lowest) value, but could theoretically still beat 2007. It doesn't seem likely that it'll be higher than the 2009 (third lowest) value, but some extreme weather shift could still cause that.
-
10 key climate indicators all point to the same finding: global warming is unmistakable
Geo Guy - in regards to the thermodynamics of melting glaciers, 1 oC can matter a LOT. Glacier dynamics are an ongoing process. Snow falls every year, accumulating in central Greenland (for example). Glaciers move to the shore driven by ice pressure, at speeds dependent upon the amount of liquid lubricating their bases, back-pressure from the calving fronts, friction, etc etc. And they then calve off and melt into the ocean. The melting/calving isn't an on/off switch, it's a continuous process tied to temperature of the air and water around Greenland. An analogy; You have a queue of people for a concert, 100 people in line. Every minute 10 people get their tickets and enter the concert, and every minute 10 people arrive at the back to line up. The individuals in the line change, but you will always have 100 people in line. Now you give the ticket-sellers large expressos, and they work faster. 10 people/minute are still arriving, but 11 people per minute leave. The ongoing ticketing rate has increased. Not a state change, but a rate change. After an hour, will you still have 100 people in line? No - you'll be down to 40, and dropping. Increasing the rate of glacial melt more than increasing the rate of snow accumulation will decrease the total glacial icepack. -
Alexandre at 02:27 AM on 2 August 2010Visually depicting the disconnect between climate scientists, media and the public
Where do I find Boykoff 2008? It seems like an update of Boykoff & Boykoff 2004. And indeed, the media coverage and public perceptions are astonishingly similar. -
stmwatkins at 01:33 AM on 2 August 201010 key climate indicators all point to the same finding: global warming is unmistakable
Ned #94 Here's a serious question. Is there any "skeptic" reading this thread who is willing to categorically state that yes, CO2 is in fact a greenhouse gas? No caveats, no "allegedly", no "for the sake of argument". Just "yes". Yes. I consider myself a "skeptic". I believe that CO2 is greenhouse gas, I believe that increasing CO2 concentrations will warm the atmosphere and I also believe that the recent (~30 year) temperature record shows an increase. My main skepticism revolves around how much of the warming is anthropogenic, since much of this "appears" to determined by the GCM's. I am in the process of looking into this for myself. Ned, does that answer your question?Moderator Response: There is a followup post summarizing the evidence for anthropogenic causes of the warming. -
Phil at 01:29 AM on 2 August 2010Visually depicting the disconnect between climate scientists, media and the public
John Chapman #18 This debate is already taking place and is, of course, the remit of IPCC working group II. (Working group I covers the same subject area as this site - the evidence for AGW) A summary of the latest report (for policy makers - i.e. non-technical) is here. -
angusmac at 00:50 AM on 2 August 2010The Past and Future of the Greenland Ice Sheet
#11 chris at 02:25 AM on 1 August, 2010 Thanks chris for pointing out the "well below" typo. Perhaps I should have said Figure 1 shows that current temperatures are similar to those reached in the 1930s and 1940s. Nevertheless, Chylek et al (2006) state that, "... almost all post-1955 temperature averages at Greenland stations are lower (colder climate) than the pre-1955 temperature average." This is the opposite of global temperature measurements. Only longer-term measurements will determine if Greenland "catches up" the 1-1.5°C suggested by you (after Box et al, 2009). Until then, I reiterate that Chylek et al (2006) state that Greenland is colder now than it was pre-1955. -
huntjanin at 00:46 AM on 2 August 2010Visually depicting the disconnect between climate scientists, media and the public
In my book-in-progress about sea level rise, I want to have some "poster children" for sea level rise -- that is to say, different countries with different approaches (or lack of them) to the problem. I already have two candidates (the Netherlands, and Nigeria) and will welcome your suggestions for others. What do you think?Response: Bangladesh would be an obvious poster child, being such a low lying country that is already suffering inundation issues - I've heard stories of villages that have been abandoned due to flooding and the locals/government lacking the resources to build levees to fix it. Sadly, some people are so poor, they don't even have the ability to relocate without losing everything and they're stuck in these situations. Sadly, the glib argument "don't worry about global warming, we'll adapt when it happens" doesn't apply to those who lack the resources to adapt and this isn't some impact in the distant future - it's happening now. -
John Chapman at 00:11 AM on 2 August 2010Visually depicting the disconnect between climate scientists, media and the public
Once the battle for acceptance of AGW has been won, the next debate will be the seriousness of the consequences? One camp (the ex-deniers) will argue that just patching up the problems (like building dykes) as they occur is better than doing something now - like spending a fortune on wind farms or nuclear power plants. -
John Brookes at 22:28 PM on 1 August 2010Visually depicting the disconnect between climate scientists, media and the public
Most people are pretty reasonable, and will accept the views of experts. They will also accept that when experts disagree, they should just sit on the fence and wait until the experts have sorted it out. The problem is that the media portrays the skeptics "experts" too fairly, and creates doubt in the public mind because they see "experts" disagreeing. If you look at Jo Nova's site, you'll see they are wanting the ABC to give their views equal time. Of course the Murdoch media is cheering on coal. -
RSVP at 21:15 PM on 1 August 2010Visually depicting the disconnect between climate scientists, media and the public
huntjanin #6 That is a great story as it makes one ask whether global warming is really something the public will notice in time. Paradoxically, the more global warming awareness depends on scientists, the more benign it must be; however, things arent always what they seem. Example, chain smokers that end up with cancer find out the hard way. -
Phil at 20:44 PM on 1 August 2010Visually depicting the disconnect between climate scientists, media and the public
There is a common misconception in the graphic which is that correlation (of the media and public perception) implies causation (i.e. the public think that because the media have told them) Indeed one could argue the other way; that the media, so intent on retaining their customer base, are simply reflecting what their readership think. My own, rather pessimistic, belief is that much of the denier-sphere, free of any real constraint to think logically, often back-think along the lines of "I like driving and flying, I don't like being made to feel guilty about it therefore I'll grab any half-arsed argument to rubbish AGW, and then I can fly guilt free" Its from such thinking that the pensions of people like Ian Plimer and Nigel Lawson are secured. It doesn't really help that tackling climate change is somewhat confused in the public mind with "being green" which in turn often suggests a hippy-style, mother earth lifestyle with too much interest in sewerage. Many people don't like it and so the back-think tendancy kicks in. So, as great a job as Skeptical Science, Real Climate, Science of Doom etc do, and no matter how often people demonstrate that deniers really don't understand the second law of thermodynamics, it is changing the perception of the lifestyle changes that will really shift public opinion. -
RSVP at 20:21 PM on 1 August 2010Waste heat vs greenhouse warming
to doug_bostom The Second Law of Thermodynamics states that there can be no net transfer of energy between two bodies at the same temperature. Whether or not the emitter "knows" about the temperature of external objects apriory doesnt really matter. Based on the Second Law, this idea is immaterial and has only caused digression, the obvious implication being that waste heat will have a cancelling affect against GHG back radiation. -
JMurphy at 20:08 PM on 1 August 2010Visually depicting the disconnect between climate scientists, media and the public
I think the figures above which represent the public's views, are a little misleading because, although only 26% accept the fact that AGW is happening, 38% seem to think that it hasn't been proved conclusively, and a further 35% either think it isn't happening at all or is just propaganda. It seems that it is that 38% that is being misled by the media and which needs to be sought out and shown the facts. How ? That is the problem. It is interesting, though, that the survey shows slightly more people who were MORE convinced about AGW after hearing about things like Climategate, etc, although the vast majority didn't change their views at all. Full details here. From other polls, however, and considering all the noise there has been over the last year or so from the denialosphere, it is still encouraging that more people still accept AGW generally, than deny it - although many think it is exaggerated or won't affect them personally. More polls here, here, here, and here. (We need more up-to-date ones, obviously) Another problem, which I'm not too clear about with regard to its influence, is the blogosphere, particularly the denial part of it. During one week last December, the blogosphere had five times as much coverage of AGW as the mainstream media, mainly down to so-called Climategate, I suppose. That has to be taken into account when deciding how to get the media to concentrate on the facts behind the science because, no doubt, once the mainstream moves towards reality, the denialosphere will surely move more towards extreme denial, which will hopefully only convince those already convinced in their long-held beliefs in conspiracy, etc. Those non-committed at that stage will surely reject such denial sites then, the way most people reject the 9/11 Troofer sites now. -
Glenn Tamblyn at 18:29 PM on 1 August 2010Visually depicting the disconnect between climate scientists, media and the public
A poll I remember reading here in Australia, although I can't find it no showed people who don't believe AGW is real at all was 13%, up from 10% a couple of years back. So the deniers had made some inroads. The frightening part was that of those who believed AGW was real, around half thought it wasn't happening very fast so we didn't need to do to much about it yet. Through such well meant ambivalence do civilisations die. -
Doug Bostrom at 17:45 PM on 1 August 2010The Past and Future of the Greenland Ice Sheet
Veering slightly OT, for those unfamiliar w/the U.S. Pacific Northwest muoncounter's photo looks more like mid-summer Siskiyou Mountains in southern Oregon, not North Cascades in mid-summer. Last-minute shot of snow did not last. California's going to be really sad when we have to stop exporting power. Plans until late winter this year were to cut exports by 50%, which would have raised rates up here since the utility would lose that revenue. Push comes to shove, we'll get the juice, California won't. They should consider very carefully whether to vote to reverse already-agreed efficiency improvements in this year's election. Coal companies interfering in the referendum process will be quite happy to sell more coal to make up for a poorly thought-out decision. Things do get complicated when all the cards are thrown in the air. -
Doug Bostrom at 16:31 PM on 1 August 2010Visually depicting the disconnect between climate scientists, media and the public
Another nice graphic depiction here, covering only one story. Might be a handy example when thinking about thindadonta's more general remarks. For my part, if I'm a mechanical engineer designing locomotives and a mathematician points out to me that I'm making a mistake and that designing a railroad locomotive using the fallacy that 2+2=4.25 is a cause for concern, I should thank him. If I ignore him and the mathematician objects to being coerced into joining other travelers riding transport equipment designed around fallacies, I can't reasonably object. If the mathematician adds his informed voice to a public hue and cry to correct the problem, I don't have reasonable grounds to object. The only legitimate reason I can think of for objecting to such a continuum of activity is if the mathematician were incorrect, or if I did not care about public safety for some reason. So if we have a problem with scientists participating in public policy, the answer lies not in silencing them but instead in doing -better- science to overcome their concerns. If we can't do that, we're better to listen instead of reaching for a gag. -
muoncounter at 15:58 PM on 1 August 2010The Past and Future of the Greenland Ice Sheet
#16: "Unfortunately in 2005 and 2009 even the accumulation zone lost all of its recent snowpack." Forgive the anecdotal evidence, but I was up in the Cascades yesterday. Temps in the 80s, precious little snow visible from the road; none at all in this pic from Stephens Pass.

Prev 2268 2269 2270 2271 2272 2273 2274 2275 2276 2277 2278 2279 2280 2281 2282 2283 Next


