


 Arguments


Recent Comments
Prev 35 36 37 38 39 40 41 42 43 44 45 46 47 48 49 50 Next
Comments 2101 to 2150:
-
Bob Loblaw at 04:31 AM on 16 March 2023Antarctica is gaining ice
Before I get forced to switch to moderator role, can we please take it easy on speculating about Bart's motives?
I also wonder what his end goal is in posting here. I've tried to get him to be specific about what his point is (as have others), and he seems reluctant to do so. Hopefully that will change (but I'm not optimistic).
-
CROM_The_Obliderator_of_idiocy at 02:48 AM on 16 March 2023The Big Picture
I also want to declare that my username is consciously mispelled so as to be legible by the dyslectics of the forum (who, I suspect, are the majority in here).
I also added a "been" in the "was always associated" for the same reason (in reality because of a lack of an edit button).
But, Not even an edit button here?
I guess it suits the authors' general mentality of not retracting any of the nonsense they spew.Moderator Response:[BL] I want to declare that you are really off to a bad start here. Before posting again, I strongly suggest that you read the Comment Policy.
-
CROM_The_Obliderator_of_idiocy at 02:41 AM on 16 March 2023The Big Picture
""What's the use of having developed a science well enough to make predictions if, in the end, all we're willing to do is stand around and wait for them to come true?"
>>We haven't developed such science and warming was ALWAYS been associated with flourishing of every life form on earth. Including penguins.
Moderator Response:[BL] Such broad sweeping claims on your part with not a shred of evidence to support them does not do your credibility any good.
-
One Planet Only Forever at 02:27 AM on 16 March 2023Antarctica is gaining ice
I agree with Rob Honeycutt's evaluation that Bart Vreeken appears "...to be looking for reasons to wish away the current climate crisis."
I also agree that "Trying to politely minimize the problem is a form of denial."
I refer to the ways that people like Bart make their claims as versions of "Passionate Pursuit of Positive Perceptions" which evades or delays learning that "developed desires and beliefs are incorrect understandings that are harmful (some misunderstandings can be helpful, but most misunderstandings are harmful in some ways)".
People can have many motivations for not seeing (or seeking) the evidence of harm done and failing to understand that harm done is not excused by benefits obtained. But they share a desire for the benefits they hope to get from the continued popularity of harmful misunderstandings, which includes evading reducing the harmfulness of the things they want to benefit from and evading having to make amends for harm done that they benefited from.
An interesting question for someone like Bart Vreeken would be:
How much sea level rise should the current population pay today to improve the Flood mitigation systems of the Netherlands to be able to deal with the future problem?
A Pursuer of positive perceptions may try to claim that nothing, or very little, needs to be done to improve the flood protection of the Netherlands. Or they may argue that the problem is not being caused by continued fossil fuel use. Or they may claim that Others are causing the problem. Or they may claim that "Future generations" will be able to do what needs to be done (at no cost to the people who benefited from causing the need for the future attempts to deal with and repair of the harm done).
A closing comment: The Promotion of Positive Perceptions that are harmful misunderstandings is one of the most harmful things a 'supposedly higher status, more influential person' can do. There clearly needs to be more immediate and effective "Governing/Limiting" of the behaviour of higher status people who pursue and promote harmful misunderstandings. And the higher status people need to lead that helpful corrective Governing/Limiting of harm done, or lose their higher status and influence.
People like Bart are not the major problem. Higher status people arguing like Bart does rather than helping people like Bart learn to be less harmful and more helpful are the major problem.
-
MA Rodger at 01:56 AM on 16 March 2023Antarctica is gaining ice
Bart Vreeken @551,
The Antarctic SMB & the GRACE anomaly don't seem to be showing much. It did occur to me that the SMB plot you presented upthread @533 does show some similarity to the average annual SIE as the years with a positive SMB anomaly are also the years when the average SIE drops below the long-term average. (Okay 2021/22 didn't quite regain the average. Ave annual SIE in JAXA 2003-22 is 11.61 sq km). You juxtapose an SMB graphic with Antarctic SIE annual minimum graphic @546. (Note JAXA 2023 min was 1.95M sq km.) The annual average (change from previous year) provides apparently a better match to SMB than does the annual minimums. Thus the SEI Change-From-Previous-Year from the JAXA data run (sq km):-
2004,105000
2005,-266000
2006,-252000
2007,245000
2008,562000
2009,-177000
2010,98000
2011,-633000
2012,523000
2013,531000
2014,236000
2015,-365000
2016,-1192000
2017,-466000
2018,251000
2019,-140000
2020,719000
2021,17000
2022,-817000 -
Rob Honeycutt at 06:45 AM on 15 March 2023Antarctica is gaining ice
Bart... "Sleeping giant" implies (and the research is showing) this is not a small amount of sea level rise we're talking about. Levies in The Netherlands have worked for centuries because, in the past, we didn't face such threats as sea level rise from a rapidly warming climate.
When you say "the risk is not so high," based on all the research I've read, I would have to differ. Based on the article John just posted, this should be very clear. The risk, particularly for places like exactly where you live, are in severe peril in the coming century and beyond.
Likewise, Florida in the US is facing a similar crisis. Within the next couple of decades property in most of southern Florida is going to become uninsurable. That is a big f-ing deal!
What this conversation come down to is, you seem to be looking for reasons to wish away the current climate crisis. I can promise you, the "interesting" items you're finding are not indications the problem is small or far in the future. The problem is now. The problem is severe. The problem is going to continue to get worse for at very least the next 20-30 years until we can get the entire global economy off of fossil fuels.
Trying to politely minimize the problem is a form of denial.
-
ubrew12 at 05:34 AM on 15 March 2023At a glance - What do the 'Climategate' hacked CRU emails tell us?
You mean stealing someone else's private communications, sifting through thousands of them to pick out a single sentence to broadcast, without context, to the rest of the World, resulted in an inaccurate portrayal of reality? I must say, I didn't see that coming... (/s)
-
Bart Vreeken at 05:06 AM on 15 March 2023Antarctica is gaining ice
"Did you happen to notice the title of the article John posted?"
Well I did! I have the strange habit to start with the title when I read an article ;-). And here it's about sea level rise. That item has my attention. I live in The Netherlands, which is a very low lying country. Large parts of it have a certain risk for flooding, by the sea of by rivers. My own house is only at 10 centimetres above sea level! But for centuries, the land is well protected by dikes. So, the risk is not so very high. But we have to be prepared for the future. The land will sink further, the sea level will rise higher, the rainfall will be more irregular and so on. So yes, sea level rise is a big issue here.
About the article. The disappearance of the ice shelf itself is no good news. But when I look at the position of it, I don't see a lot of ice from the ice sheet that will be on the move now. That's my point.We have to monitor Antarctica very well, try to understand how it works, try to predict what will happen. But not with panic, that won't help us.
-
Rob Honeycutt at 04:09 AM on 15 March 2023Antarctica is gaining ice
Bart... Did you happen to notice the title of the article John posted?
"Why East Antarctica is a 'sleeping giant' of sea level rise"
Don't you think that's interesting?
-
Bart Vreeken at 02:09 AM on 15 March 2023Antarctica is gaining ice
Ah, thank you John Hartz @557
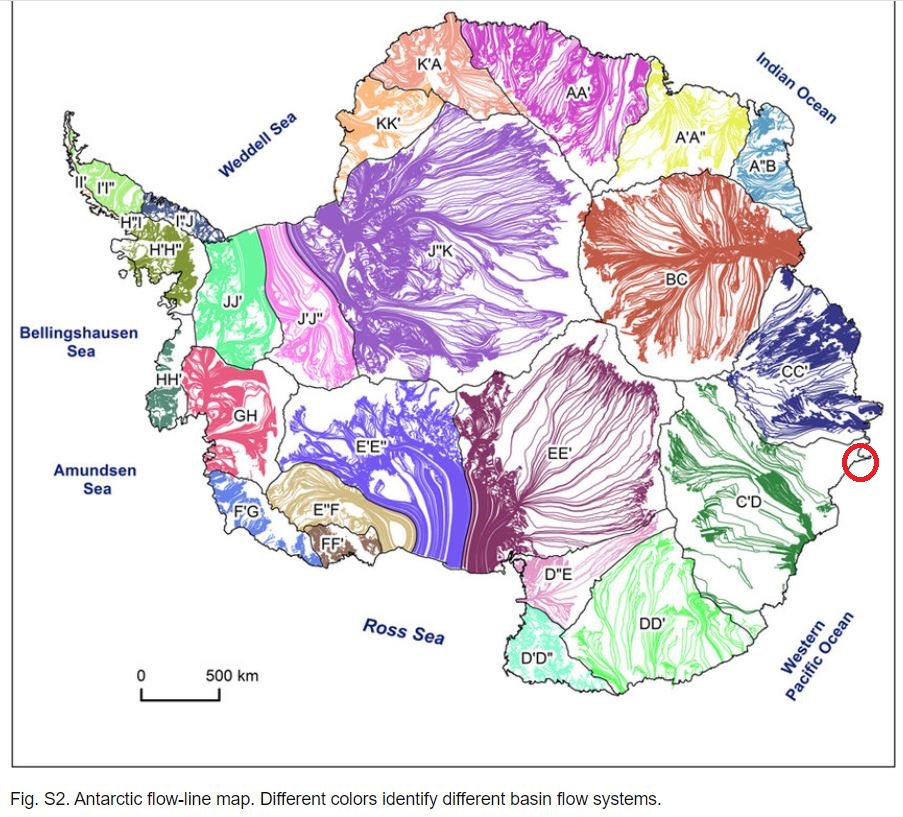
Yes, I noticed the article too. Indeed, the iceshelfs are the missing part of information and indeed, they are more vulnerable when the sea ice extent is low. But when we look at the position of the Conger's ice shelf (it's in the red circle on the map below) there is something strange. There isn't much inflow of ice from the ice sheet above. And when there isn't inflow, an ice shelf will disappear sooner or later. Maybe the pattern of the ice flow has changed during the years?
So, let's hope that the other ice shelfs are doing better. At least, the collapse of the Conger's ice shelf didn't influence the mass balance of the total ice sheet (the non-floating part) too much last year. It showed an increase of mass.
-
MA Rodger at 18:20 PM on 14 March 2023Climate Science Denial Explained
Foster @11,
The crux of this latest nonsense from our chum Anthony Willard Watts is to plot out global average temperature using a very long Y-axis so it appears as a flat line.

This is rather reminiscent of the 'thin red line' of aging climate-change-denying climatologist Dickie Lindzen who would plot the size of AGW-to-date onto a graph of annual max-min temperatures in Boston (where he worked) using the width of a red line.
Lindzen would then make some nonsense statement about the planet's average temperature always wobbling by several tenths of a degree at virtually all timescales (which isn't correct). At a presentation in the UK Houses of Parliament back in 2012, he candidly put it thus:-
Changes in the order of several tenths of a degree are always present at virtually all time scales. And obsessing on the details of this record is more akin to a spectator sport for tea-leaf reading than a serious contributor to scientific efforts.
Say, at least so far: if some day I should see some changes of twenty-times what I've seen so far, that would be certainly remarkable but nothing so far looks that way.So this so-called climatologist suggests a global temperature change of twenty-times 'what he's seen so far' is when climate change becomes "remarkable". Call that 20 x 1.5ºF=+30ºF=+16ºC. I think the word "uninhabitable" would have been a more appropriate adjective.
-
John Hartz at 12:01 PM on 14 March 2023Antarctica is gaining ice
Bart @ 556:
"More information" does cometh rather quickly. The following in-depth artice was posted on BBC's Future feature yesterday:
Why East Antarctica is a 'sleeping giant' of sea level rise by Alec Luhn. Future, BBC, Mar 12, 2023
The lede for the above article:
Scientists once thought the East Antarctic ice sheet, which contains enough water to raise sea levels 52m (170ft), was stable. But now its ice shelves are beginning to melt.
A key pragraph from the article related to your comments on this thread:
Usually, glaciers move at a glacial pace. The speedy collapse of the Conger's ice shelf came after some of the most dramatically warm weather ever observed in Antarctica. For the first time since satellite monitoring began in 1979, the sea ice extent around Antarctica dropped below 2 million sq km (770,000 sq miles). Less sea ice means more waves battering the ice shelves in front of the glaciers. Massive fields of sea ice off of Adelie Land, Wilkes Land and Princess Elizabeth Land in East Antarctica completely disappeared.
-
Eclectic at 09:13 AM on 14 March 2023Climate Science Denial Explained
Foster @11 ,
Count me in ~ I, too, would love to know what virtues you see in that WattsUpWithThat blog article.
I confess to being a regular reader of WUWT blog ~ it has its amusing side, and despite WUWT 's prolific posts, it takes me little time to skim the daily avalanche (the trick is to skip through the rubbish). Most of the lead articles have a strong tinge of angry sourness & childishness. Rarely do I find an article containing some technical information of value.
And without scooping more than a ladle's worth of justified ad-hominems ~ I can say that the WUWT comments columns are even worse than the lead articles. The commenters do (in general) show a remarkable range of pathology . . . from scientific ignorance and delusional beliefs, through to extremist political axe-grinding. All wonderfully entertaining, if you have the stomach for it.
Foster, the WUWT article you mentioned has a humorous comment [about 4th from the top] by Nick Stokes , showing a graph depicting the change in the U.S. National Debt. Droll humor by Nick Stokes, exemplifying the absurdity of Anthony Watts's ideas. (Nick Stokes is always worth reading, for he is very rational & scientifically well-informed ~ he is the complete opposite of the Usual Denizens at WUWT. And they hate him for it ! )
[ The writer "Hot Sou" (mentioned @13 above) is pretty much banned at WUWT. She gets under Anthony Watts's skin ~ and IIRC he has threatened to take legal action against her. ]
-
Bob Loblaw at 04:26 AM on 14 March 2023Climate Science Denial Explained
Correction. Sou's "recent" post is from a couple of months ago.
-
Bob Loblaw at 04:06 AM on 14 March 2023Climate Science Denial Explained
Foster @ 11:
I have not looked at anything over at WUWT in years, and I've never seen anyone post any information about what is available there to make it worth thinking that they have started posting anything even remotely connected to reality.
Perhaps you could put into your own words just what it is about that post that you think would give me a reason to look?
Someone who used to regularly debunk the crap from WUWT was Sou, over at her blog Hot Whopper. She has not been very active recently, but I just happened to take a look today. She has a new post up regarding GISS temperature data, etc. She does not specifically refer to WUWT, but perhaps you can read it and see if it answers your questions about the WUWT post. It may have been triggered by the recent WUWT post, or it may just be a coincidence in timing.
As Michael says, the world according to WUWT rarely changes. The bogosity is usually pretty predictable.
And I second the recommendation to Dr. Inferno's site. You need to be aware of Poe's Law before going there, though.
-
michael sweet at 03:40 AM on 14 March 2023Climate Science Denial Explained
Foster:
Fortunately Dr. Inferno at the Denial Depot site wrote a summary of this issue way back in November 2010. How thngs never change! They just blow up the Y axis and say there is no change.
How To Cook A Graph SkepticalScience.com Style
He even has Skeptical Science in the title of the post!! (Dr. Inferno is a tounge in cheek satire site). Unfortunately, Dr. Inferno has not posted since 2016. If anyone knows who Dr Inferno is tell him that his fans are waiting his next post with eagerness.
This is my favorite graph (link to blog post explaining the tilted baseline) from Dr Inferno showing that Arctic Sea Ice is increasing. Monckton actually used a graph in a presentation that had a tilted baseline like this.

-
Bart Vreeken at 02:00 AM on 14 March 2023Antarctica is gaining ice
Bob Loblaw, I'm afraid we don't get any further in the discussion. It's a pity. Lets see what more information comes to us in the coming time.
Have a nice day!
Bart.
-
John Hartz at 01:22 AM on 14 March 20232023 SkS Weekly Climate Change & Global Warming News Roundup #10
Michael Sweet: Thank you for tagging the CleanTechnica article about ICE and EV motor vehicles.
-
Foster at 00:36 AM on 14 March 2023Climate Science Denial Explained
Hi All! First post here but I came across a blog (anti climate change blog) called What's Up With That by Anthony Watts who made a recent post trying to disprove NASA GISS chart.
Here is a blog post: https://wattsupwiththat.com/2023/03/12/new-wuwt-global-temperature-feature-anomaly-vs-real-world-temperature/
What do you all make of it? Curious to hear your thoughts. Thanks! :)
-
michael sweet at 14:42 PM on 13 March 20232023 SkS Weekly Climate Change & Global Warming News Roundup #10
This article at CleanTechnica.com gave interesting and hopeful data about the adoption of electric cars world wide. They document that the production of ICE cars peaked in 2017 and is now declining because battery electric cars are taking over the market.
In 2017 86 million ICE cars were sold and only 1 million battery and plug in hybrid cars were sold. In 2022 only 69 million ICE cars were sold while 10.4 million plug in cars were sold. About 7.4 million were battery only cars. Plug in vehicles were 26% of the market last year. It is expected that the electric market will substantially increase this year.
The more electric cars that are sold the less oil that will be burned in transportation. Combined with increasing electric power generation by renewables and the amount of carbon released every year will start to decrease. It is still far too low to achieve the 1.5 C goal. Everyone needs to push governments to stop fossil subsidies and increase renewable subsidies.
-
Bob Loblaw at 12:09 PM on 13 March 2023Antarctica is gaining ice
Bart @ 552:
The point in my comment at 534, responding to your first comment, was that it is a huge mistake to try to make extrapolations into the future from a short time period. We see it all the time: temperature (The Escalator), sea ice coverage, etc. People that want to believe a particular thing, and ignore the long-term trend by saying "look at this!" from a short period of data at the end of a noisy data set.
If you had followed the link to The Escalator, you would have seen that the very first sentence says:
One of the most common misunderstandings amongst climate contrarians is the difference between short-term noise and long-term signal.
That you choose to call it "a stupid graph" indicates that you still don't understand the error in drawing grandiose claims from short periods of data.
Now, you are saying "The result is interesting: there don't seem to be much correlation between SMB and discharge. Strange enough, in the last year with little sea ice the discharge was even less then normal."
No, this is not at all interesting. As has been said to you previously, relationships between precipitation, accumulation, glacier flow, discharge, and sea ice are not simple. Rob Honeycutt has posed a number of questions to you in comment 554 that are germane to the point. Unless you understand why those questions are important, and can begin to think of answers to them, you are not looking at the topic seriously.
The very first response I gave to you - the first paragraph - was:
What exactly is your point? The links between sea ice area and land ice mass are not simple, and have been discussed in the detailed sections of the blog post and earlier comments.
I suggest that you actually try doing some reading, starting with the blog post (both the basic and intermediate sections) and then through the numerous comments, and maybe then you'll have enough understanding to be able to engage in a "serious discussion".
The simple answer is that you seem to be expecting a simply answer and a simple relationship for a complex system, and you are simply wrong.
-
Rob Honeycutt at 10:18 AM on 13 March 2023Antarctica is gaining ice
Bart... You're still claiming it's interesting without stating why it's interesting or what this possible correlation would imply. In my mind that doesn't make it interesting.
"As I said, I was hoping for a more serious discussion on this site."
You're hoping for a serious discussion on something that you are failing to seriously discuss. Does the correlation you're proposing extend outside of the past decade? Does it have any substantive implication for longer trends? What are the physics related to this proposed correlation? What are the dynamics of this process? You're going to have to offer up a lot more and get more clear on what you're discussing in order to have a more serious discussion.
-
Bart Vreeken at 07:11 AM on 13 March 2023Antarctica is gaining ice
"The average mass of the anomaly"
this must be: the average mass of the SMB.
-
Bart Vreeken at 07:09 AM on 13 March 2023Antarctica is gaining ice
As I said, I was hoping for a more serious discussion on this site.
What went wrong: in my first post I wanted to show the graph with the SMB as well. I must have done something wrong, for it didn't came up. Sorry for that. But this information is not so hard to find. MA Rodger succeeded in doing this, Bob Loblaw preferred to show a stupid graph about cherry-picking. Well, that's not the point here.
Anyhow. The correlation between SMB and mass change was not clear, so I put them together in one table. The SMB is calculated over November - November. The original graph gives the anomaly of the SMB. The average mass of the anomaly seems to be some 2700 Gigaton, so I added that to the anomaly. Then the discharge of the ice sheet can be calculated as the difference between the GRACE data and the SMB.
The result is interesting: there don't seem to be much correlation between SMB and discharge. Strange enough, in the last year with little sea ice the discharge was even less then normal.
An important thing could be that GRACE isn't measuring the total amount of ice, but only the amount above the sea level. So, increased calving from floating iceshelfs isn't noticed.

-
Rob Honeycutt at 09:22 AM on 11 March 2023Antarctica is gaining ice
Bart @549... I'm not quite in agreement what you're stating is interesting. It just doesn't strike me as implying anything relevant.
-
Bob Loblaw at 08:35 AM on 11 March 2023Antarctica is gaining ice
Bart @ 546, 547, and 549:
When I am having a serious discussion with someone in the comments section here, I expect certain things:- That they stick consistently to one aspect of a discussion, without jumping randomly from one sub-characteristic to another.
- That when they refer to a figure, they are specific in explaining what part of the figure they are talking about.
- That when they provide a link to a paper, they explain which part of the paper they want someone to read (e.g., by using quotes or section numbers, or figure numbers) and why it is relevant.
- When they make multiple points, they give some indication that they are shifting gears and how the new point relates to the old point.
You've jumped from Grace data showing total mass, to links to papers discussing snowfall changes, to Surface Mass Balance, and back again - and it is all jumbled together in an incoherent mess.
In 546, you state, "I never said the the [sic] mass loss has stopped. (OK, last year incidentely) [sic]."
- The whole purpose of your original comment @ 533 was to draw attention to that "incidental" observation in Grace data, and to tie it to sea ice loss.
- In 537, you doubled down on the significance of that one year, and speculated about what might happen "in coming years". And linked to a paper that did not discuss Grace data at all.
- In 541 you drew attention to how that one "incidental" point had changed the average, and said that it "gave us a hint..." You referred back to that same paper that does not cover Grace data.
- In 544 you switched from Grace data in your original comment to discussions of SMB, without explaining, connecting, or justifying the change.
And now the primary evidence from your original comment (the 2022 Grace data) is dropped as if you just mentioned it "incidentely" [sic] and never meant it to be a claim that the mass loss had stopped?
I expected an honest discussion here, not a game of "Look, squirrel". And in 549 your response to Rob's request to explain what is "interesting" is basically a hand-waving speculation of maybes. If you are posting maybes so that you can backtrack and say things like "I never said the the [sic]mass loss has stopped", when that was the obvious implication of what you said, then it is impossible to have a serious discussion with you.
-
Bart Vreeken at 07:40 AM on 11 March 2023Antarctica is gaining ice
Rob @548
"Perhaps you can explain why you think this is interesting"
The interesting thing is that there seems to be a correlation between years with low sea ice and years with a high SMB. So, when the amount if sea ice stays low, we can expect more years with a high SMB. As long as most of the precipitation keeps falling as snow, not as rain.
Of course, the low amount of sea ice can have other effects too. The calving and the melting of the ice shelfs shall also increase, and with that the speed of the glaciers.
-
Rob Honeycutt at 06:48 AM on 11 March 2023Antarctica is gaining ice
Bart @547... "Interesting, isn't it?"
Perhaps you can explain why you think this is interesting.
-
Bart Vreeken at 03:39 AM on 11 March 2023Antarctica is gaining ice
As you can see above, I also looked for a correlation between the sea ice extent and the SMB in the last decennia. With some cut and paste I made a combination of two figures. The SMB is calculated over March to February in the next year. So the peak in the SMB in 1992 comes together with a low minimum in 1993, and the low SMB in 1994 comes with a high minimum sea ice extent in 1995. Interesting, isn't it?
-
Bart Vreeken at 03:32 AM on 11 March 2023Antarctica is gaining ice
Bob @545
I expected a more serious discussion here.
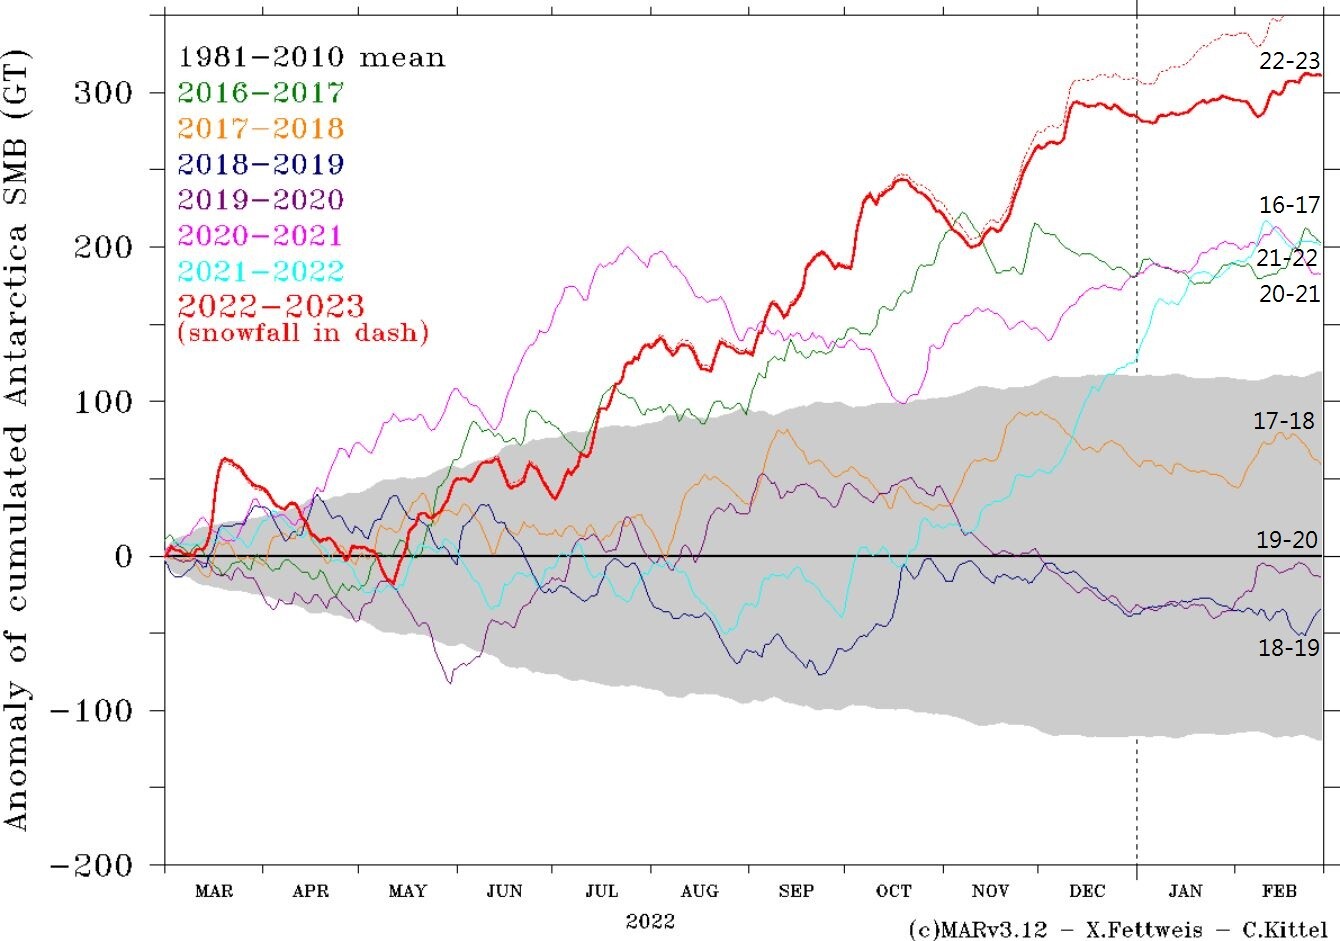
Of course, snowfall is not SMB. There is also surface melting, runoff, wind blow, evaporation. In the figure i posted above you can see the difference between the SMB and the snowfall (dashed line). But of course, there is a big corralation between SMB and snowfall.
And SMB is not the same as the total Mass Balance. I never said the the mass loss has stopped. (OK, last year incidentely).
The SMB of the last seven years is showed in the figure I posted above. Source:
www.climato.uliege.be/cms/c_5652669/fr/climato-antarctica
As you can see, the SMB of season 2022-2023 ended ca 310 Gt above average. And so on.
And yes, its not completly consistent with the diagram in comment 533. The diagram shows the mass change between 2021/11/14 and 14 2022/11/14, based on gravimetry. The SMB is calculated over 2022/03/01 until 2023/03/01 based on weather models.
With a close look to the SMB figure you can also derive a SMB over the same period as the GRACE data.

-
Bob Loblaw at 00:26 AM on 11 March 2023Antarctica is gaining ice
Bart @ 544:
You are really presenting a scrambled set of statements that lack clarity and consistency.
The link you provide does not mention any increase in SMB - it discusses small increases in snowfall, and how this has made the decreases in the SMB less than they would have been otherwise. The opening of the second paragraph is [emphasis added]:
"Our findings don’t mean that Antarctica is growing; it’s still losing mass, even with the extra snowfall"
The second-last paragraph says [emphasis added]:
“Snowfall plays a critical role in Antarctic mass balance and it will continue to do so in the future,” Medley said. “Currently it is helping mitigate ice losses, but it’s not entirely compensating for them. We expect snowfall will continue to increase into the 21st century and beyond, but our results show that future increases in snowfall cannot keep pace with oceanic-driven ice losses in Antarctica.
So, your reference provides no support for your claim that the 2022 increase in SMB "started last century". Snowfall is not SMB - it is only part of it. Stop jumping from one measure to another, as if they are equivalent.
When you refer to "the last seven years then five of them were above average; four of them were far above average and none of them were far below average" you completely fail to tell us what "them" are. The article you link to provides no annual numbers for anything. This description does not appear to be consistent with the diagram you presented originally in comment 533, and I have no idea what data set you are talking about.
You appear to be taking small bits from articles that you read, misunderstanding what they say, and interpreting them (incorrectly) as evidence that supports your position.
-
Bart Vreeken at 18:56 PM on 10 March 2023Antarctica is gaining ice
Hi Bob, the increase of the SMB of Antarctica is not so very speculative. It started last century, this NASA study says:
climate.nasa.gov/news/2836/antarcticas-contribution-to-sea-level-rise-was-mitigated-by-snowfall/
When we look at the last seven years then five of them were above average; four of them were far above average and none of them were far below average. So, it's not only last year.
Most of the uncertainty is in the expected discharge, I think.
-
RichardBryan at 17:12 PM on 10 March 2023“It’s almost like a cult.” Activists shout down rural renewable energy projects
One of the effective ways clean energy advocates can fight back against this sort of harrassment is continuing to advocate for higher taxes on the fossil fuel industry, and tax credits for green energy installations.
-
Bob Loblaw at 10:49 AM on 10 March 2023Antarctica is gaining ice
Bart @ 541:
What Rob said to you.
You say the change in the average is "interesting". So what? The average went up a lot when 2022 gets added to the series.
- In 2007, the low value of about -350 would have dropped the previous average by 70 Gt/yr, because it was only the 5th value in the series (up to that point).
- By 2010, the series has grown to 9 values, so that -380 value would have dropped the average by roughly 65 Gt.
- By 2015, the time series has grown to 14 values, so the additional value of -350 would have dropped the average by 25 Gt.
This is simple arithmetic. Short time series see big jumps in the average when a single large value is added. It really has very little meaning.
You then go on to postulate "how much will the SMB increase"? You are speculating that this one-year large positive value is the key to the future trend. That is highly speculative. Not just uncertain - highly speculative. You are taking one value from a noisy signal, and treating it as if it represents a long-term trend.
You are focussing on the noise represented in a single value, and it really is not a good idea.
-
walschuler at 10:06 AM on 10 March 2023“It’s almost like a cult.” Activists shout down rural renewable energy projects
David-acct said:
"NIMBY does create some issues for worthwhile projects. A 375 Mw wind farm will require approx 3000 acres (assuming 80 acres per megawatt) or 35-40 square miles (assuming 10 mw per square mile. A typical gas generating plant generating 250-300MW will have a foot print of approx 15-20 acres. Approx 2 acres of land used for the actual turbine, & roads means the foot print for the 375mw is 750 acres, not including lower farm production.
So while it is regrettable, it remains understandable."
I am a little unclear what is meant by this comment. Is it about the well-head installation or a gas-fired power plant? If either one, it has in almost no case delivered the gas to the point of use. Gas pipeline rights of way need inclusion, and for the latter the former shouldbe added to the area of the gas fired electric plant. Then there is the territory at the surface affected by some types of drilling, and the territory below where water supplies may be affected, plus the surface area affected by that. How does that math come out??
-
Rob Honeycutt at 09:19 AM on 10 March 2023Antarctica is gaining ice
Bart @541... "After last year the average has changed, which is interesting by itself."
Again here, you're focusing on one data point, where the abstract you post is focused on the long term uncertainties. The 2022 datapoint may technically alter the 20 average, but that's pretty darned meaningless since the following years may likely revert to the long term mean.
What researchers are trying to do (to my understanding) is reduce their uncertainties for long term ice mass loss as it pertains to sea level rise contributions. Having a higher degree of confidence on whether we're going to see 0.3m or 1.3m of sea level rise by 2100 is very important information for the broad purposes of governments and societies to inform them how to prepare.
-
Bart Vreeken at 06:01 AM on 10 March 2023Antarctica is gaining ice
Bob Loblaw @ 539
I don't think focussing on the noise is a good idea ;-)
When we just look at the GRACE data then the year 2022 is one in a row of 20. After last year the average has changed, which is interesting by itself.
But during this 20 years things have changed. The extent of the sea ice has declined. So more water vapour comes to the continent, which gives more precipitation. The question is how this works out. The last year gave us a hint that it can add a lot to the Surface Mass Balance. The next question is: how much will the SMB increase, and how much will the discharge increase. Of course, that's very uncertain. In the paper I called it says in the abstract:
The surface mass balance in SSP5–8.5 simulations shows a pattern of strong decrease on ice shelves, caused by increased melting, and strong increase on grounded ice, caused by increased snowfall. Despite strong surface and basal melting of the ice shelves, increased snowfall dominates the mass budget of the grounded ice, leading to an ensemble mean Antarctic contribution to global mean sea level of a fall of 22 mm by 2100 in the SSP5–8.5 scenario. We hypothesise that this signal would revert to sea-level rise on longer timescales, caused by the ice sheet dynamic response to ice shelf thinning. These results demonstrate the need for fully coupled ice–climate models in reducing the substantial uncertainty in sea-level rise from the Antarctic Ice Sheet.
-
Bob Loblaw at 05:06 AM on 10 March 2023Antarctica is gaining ice
MAR @ 538:
Yes, the linear regression vs. "average" is a factor. The page I linked to shows a graph that starts at 0 ice loss in 2002 and ends with the current accumulated ice loss. It points out two specific values:
- +65 Gt in October 2002
- -2808 Gt in Febraury 2020
...for a total change of 2873 Gt in 19.3 years. That is a change of 149 Gt per year. It is not a regression of the time series. It also takes the maximum of 65 Gt at a time slightly after the record begins, and chooses the minimum in February 2020, not the final value at the latest point on the series.
As I said - noise in the system. Short record, year-to-year variability. Add close to a year at the start; add a couple of years at the end; results change. Not a surprise.
-
michael sweet at 04:52 AM on 10 March 2023Methane emissions from Siberian sinkholes
This you tube video demonstrates blowing up a soda bottle using dry ice and water. Nothing ignites. I used to telll the cop on our High School campus when I was going to do this demonstration, it sounds like a gunshot. I have blown a watermelon to smithereens by dong this explosion in a one liter bottle inside the watermelon. Definately an explosion. Note the tremperature is below zero C.
The energy for the explosion comes from the freezing water causing the dry ice to sublimate (turn into gas). The gas pressure builds until the bottle fails and explodes. Soda bottles are much louder than water bottles. (water bottles are thinner, soda bottles have to resist the pressure inside the bottles.)
-
Bob Loblaw at 04:15 AM on 10 March 2023Antarctica is gaining ice
Bart Vreeken @ 537:
Ahh, so you are focussing on the noise, not the signal. The year-to-year variation is large, and one year of adding ice does not a trend make. So, there has been a year where close 400 Gt was added - and there have been four years in the record you show where 300-400 Gt per year was lost (2007, 2010, 2015, 2018).
The "rebound" of 2022 is simply a strong positive departure from the long-term trend after several years where individual years were below the long-term trend. You might benefit from reading about Regression toward the Mean.
In a noisy, short data set, adding or removing one exceptional year will have a strong effect on the average. With only 20 years of record, +400Gt in one year will shift the average by 20 Gt. This is not exactly ground-breaking analysis.
And in continental-scale ice sheets, it takes decades to centuries for mass added in the central areas to reach the perimeter. You are familiar with the phrase "glacially slow", aren't you?
So again, exactly what is your point, other than "this is interesting"? And what, exactly, do you want me to read about in the paper you link to? Refer to a diagram, section of text, or something concrete.
-
MA Rodger at 04:06 AM on 10 March 2023Antarctica is gaining ice
The difference between the 114Gt/y and the 151Gt/y isvery likely that the former is an average and the latter a linear rate of loss calculated using OLS. That NASA (Vital Signs) graph showing the 151Gt/y also gives a 20.5-year mass loss Apr2002-Nov2022 of 2,352Gt which averages to 115Gt/y.
-
Bart Vreeken at 02:41 AM on 10 March 2023Antarctica is gaining ice
Hi Bob @534
I don't see a clear rebound effect in my figure.
And of course the mass gain of last year shall be exceptional. But at least it's an interesting thing to notice. And maybe the increasing precipitation can offset the increasing discharge in the coming years as we can read in the article below. As you say, the average mass loss is now something like 114 Gt per year. That's much less then the 151 Gt we read about on the website of NASA (Vital Signs).
-
Bob Loblaw at 01:42 AM on 10 March 2023Antarctica is gaining ice
One other thing to note in Bart Vreeken's graph in comment 533.
Bart's graph has a dotted line in it, and an equation in the upper right corner, which I presume is the regression equation for the line.
Note that the indicated slope is -0.0672 (so, almost zero), and the intercept is -113.83. This indicates an average mass loss of 113.83 Gt per year. A bit lower than the 149 Gt per year in the web page I linked to in comment 534 - but the page I linked to does not include the 2021 and 2022 data, which pull the average up.
-
MA Rodger at 01:05 AM on 10 March 2023Antarctica is gaining ice
Bart Vreeken @533,
You appear to be plotting out the GRACE/GRACE-FO data as per this NASA web page (which shows data to Oct 2022). This gravity data does not measure Sea Ice which is floating. And for clarity, it is not Surface Mass Balance which you correctly say had an exceptional year last year (as per this NSIDC post of January 2023, snowfall being high enough to "completely offset recent net ice losses from faster ice flow off the ice sheet for this assessment period. Most of the past decade has seen annual net losses of 50 to 150 billion tons."

So a record year for the 2023 Antarctic Sea Ice Extent minimum as well as a record year for the 2022 Antarctic Surface Mass Balance.
Antarctica doesn't get a lot of attention, compared to the Arctic cryosphere. Certainly for Antarctic Sea Ice, the mechanisms driving the variations is a lot less straightforward in the Antarctic.
-
Bob Loblaw at 00:33 AM on 10 March 2023Antarctica is gaining ice
Bart Vreeken @533:
What exactly is your point? The links between sea ice area and land ice mass are not simple, and have been discussed in the detailed sections of the blog post and earlier comments.
In your graphic, it is obvious that the two major years of land ice gain (2016, 2022) follow several years of strong mass ice loss. This is easily explained as a rebound effect.
This web page on Grace data has an embedded video with data to 2020. Rather than portraying the annual changes it shows the overall trend in the absolute value from year to year. Clearly, Antarctic land ice is losing mass in the long term - with short terms ups and downs.
Are you perhaps over-analyzing the significance of short-term changes, as is often done with temperature changes? (As seen in The Escalator).

-
Bart Vreeken at 23:07 PM on 9 March 2023Antarctica is gaining ice

It looks like the Antartican Ice Sheet had a very good year, as far as we can see. At least, the mass balance over the period november 2021 - november 2022 was far positive. This can be due to the very low extend of the sea ice. The Surface Mass Balance over the melting period of last year turned out very positive. I don't read much about this, the focus in de media is on the low extent of the sea ice. Any thoughts about this?
I did expect a new update of de GRACE data of December 2022, but it comes late again.
-
Bob Loblaw at 22:49 PM on 9 March 2023It's not urgent
Eddie:
SkS did a series on the ocean acidification issue a number of years back.
Part 0 provides an index to the series.
After it was complete, it was turned into a downloadable booklet.
-
EddieEvans at 19:57 PM on 9 March 2023It's not urgent
MARoger@
"The net carbon sink into the oceans is far more predictable than the carbon interchange in/out of the biosphere."
Using the global ocean as a carbon sink has consequences for biodiversity, increasing acidification. There's no free lunch, and no eternal waste disposal for the Anthropocene, I gather. I'm not up to date on the latest research; I left the ocean as a sink with Roger Revelle. I will update my understanding for sure. There are no positives in any of these GHG matters.
-
Rob Honeycutt at 15:25 PM on 9 March 2023Which state is winning at renewable energy production?
David @9... "The shift of the demand curve effectively raises the market price of the product."
Not necessarily. Specifically, with RE systems, what the tax credits are doing is making up for externalities. RE is operating in the energy marketplace and is therefore in competition with legacy energy generation from FF sources. Those FF sources have an effective advantage in that the byproducts of their uses have quantifiable, but uncaptured, harms to the global environment.
Regardless of whether a tax credit is making the energy product cheaper or making the RE provider more profitable doesn't matter. What matters is the overall benefit to the RE energy companies in lieu of direct taxes on carbon emissions.
Same applies to EV makers. They are operating in the automobile market with, initially, products that cost more to manufacture. Tax credits level the playing field between EV's and ICEV's for a time period while economies of scale can be achieved by EV makers. Remember, all the auto tax credits have sunsets based on the numbers of vehicles sold.
In the case of EV's, clearly the tax credits are benefiting the buyer because the cost of EV's is just now (or within a year or two) achieving parity with the cost of manufacturing an ICEV. Thus, up until now those tax credits have served to bring the cost of EV's in line with ICEV's.
-
Bob Loblaw at 11:42 AM on 9 March 2023“It’s almost like a cult.” Activists shout down rural renewable energy projects
David-acct:
Wind turbines may be spread over a large area, but not all the land in that area is removed from other functional uses. Farmers can easily use most of the land in that 750 acres, since the only place that can't be farmed is the actual base of the towers and any road infrastructure needed for maintenance.
A picture from the North Sea area in Germany:


