


 Arguments


Recent Comments
Prev 32 33 34 35 36 37 38 39 40 41 42 43 44 45 46 47 Next
Comments 1951 to 2000:
-
Climate's changed before
i think ther is mistake in italian version:
"I cambiamenti naturali del Clima del passato dimostrano che il Clima risente delle alterazioni del bilancio energetico. Se il pianeta accumula calore le temperature globali salgono. "
The planet don't accumulate heat (because is only transfer), the planet accumulate energy , not heat , the heat is only conseguence of more energy in the system
-
knaugle at 22:10 PM on 20 March 2023The Big Picture
The first time I saw a graphic depicting " TEN SIGNS OF A WARMING WORLD" was in 2010, with this NOAA page. It still remains relevant.
-
MA Rodger at 21:54 PM on 20 March 2023Climate Science Denial Explained
Eclectic @20,
The other denier you mention, Spencer, has been described as mixing religion with his science (eg by The Christian Science Monitor). As for him doing actual science, I remember hearing his 2010 book 'The Great Global Warming Blunder: How Mother Nature Fooled the World's Top Climate Scientists' (thus implying he is not himself a 'top climate scientist') was published with the expectation that the paper presenting the scientific work underlying that grand title would be refused publication. However it was published but, I heard, it has been shown to exaggerated the effect he was proposing, an effect which does exist but as a very minor effect.
-
Eclectic at 19:59 PM on 20 March 2023Climate Science Denial Explained
MA Rodger @19 ,
there is much in what you say. And sadly, the Iris Effect was a flop. And Prof Lindzen's earlier predictions of only a very slight rise in surface temperature have been (in retrospect) a giant flop too.
I base my "religious" comment on seeing a lengthy video interview of Lindzen (dated around 2006, IIRC ). The interviewer was very simpatico ~ and Lindzen did not hold back.
Has my subsequent opinion of Lindzen been influenced by a confirmation-bias about his later public speakings ? . . . well, quite possibly so (but I do try to make allowance). A mountain of motivated reasoning on Lindzen's part still seems evident to me. As you yourself say, there is no logical basis for the denialist viewpoint.
-
MA Rodger at 18:20 PM on 20 March 2023Climate Science Denial Explained
eclectic @18,
I don't see Lindzen's opposition to the science as being motivated by religion. I see it as a scientist of some repute who lost the conclusive scientific debate over AGW in the 1980s but refused to admit defeat. While such stubbornness is not to be condemed (skepticism being a big part of the scientific process), Lindzen 'crosses the line' and sets out unscientific messages. I still remember his rather ludicrous contribution to the 1990 film 'The Greenhouse Conspiracy' (YouTube) which actually convinced me of the opposite view that AGW was real and likely a big problem being politically kicked into the long grass. (The 'crossing of the line' into non-science is not a wholly climate denier thing but they do seem to spend much more time doing it.)
Through the years, Lindzen did (indeed still does - see Lindzen & Choi 2022) continue work attempting to show that climate sensitivity is low and AGW not a problem for humanity, most famously his 'Iris Effect' which turns out to be a real effect but one having the opposite impact and one threatening significant increased warming.
-
Bart Vreeken at 18:19 PM on 20 March 2023The Big Picture
michael sweet @124, it's a discussion about nothing.
I made an estimation of the part of the meltwater of Greenland that makes te sea level rise in the Netherlands. I showed a map where this estimation was based on. You showed a map with more melting on the westcoast of Greenland, so according to that my estimation was wrong.
In fact, this 12.5 percent was a wild guess, to show that only a minor part of the meltwater will influence the Netherlands. But the number kept coming back; Bob Loblaw wanted to know exactly where it came from and called it a 'magical number'.
-
Eclectic at 11:30 AM on 20 March 2023Climate Science Denial Explained
Foster @17 ,
I hope you found some amusement reading the Anthony Watts article. And reading maybe a few of its attached comments [best to look for ones with a high number of red-color "down votes"]. WUWT currently shows that article as having over 650 comments . . . a Platinum Medal score for a WUWT article, and demonstrating that it is doing well as a Hot Button issue for climate-denialists. Whew !
If you read the comments, you will see a lot of sniping & griping, but very little science at all.
As MA Rodger has touched on, you find prominent denialists such as Dr Lindzen and Dr Spencer who are driven by "motivated reasoning" derived from their emotional religious beliefs that the Divine Entity simply would not permit Earth's climate to depart from the comfortable Garden-of-Eden range.
However, most WUWT regular denialists fall into 3 groups :- the conspiritard/wingnut group ; the science crackpot group ; and the intelligent well-informed ones who neverthelesshave been captured by their own motivated reasoning (a sort of palace coup where emotions displace intellect). But obviously there is some overlap between groups ~ mostly the 1st and 3rd groups.
Foster , I would if I had my druthers, simply leave WUWT & similar sites to fester as they are. Yes, there is an argument that such disinformation sites ought to be "stopped". Undoubtably they deserve that fate. However, they may do more good than harm, by localizing denialists into their own echo chamber where they can blow off some steam . . . and it keeps them off the streets, so to speak.
-
Foster at 10:03 AM on 20 March 2023Climate Science Denial Explained
Thank you all for summing up and explaining why that recent blog on WUWT post by Anthony Watts is just again, more misinfomration. I'm no climate scientists but I often come here to learn more, research and hear from you all as I'm well aware climate change is a major problem and love to hear thoughts as to how we can all help combat it. A higher
I feel like something needs to be done to stop denier sites and the spreading of misinformation as it relates to climate change. Thank you all again! I enjoy reading the comments and articles here and continue to be an active member here.
-
michael sweet at 05:55 AM on 20 March 2023The Big Picture
Bart Vreeken,
Your post at 87 claims that "michael sweet @72 says my 12.5% was too low,"
Looking at post 72, I make no claims at all. I show a copy of ice lost on Greenland. I do not mention your claim at 12.5% at all. I believe htat I have never mentioned your claim at all.
It is poor argumentation to make obviously false claims.
-
Rob Honeycutt at 05:48 AM on 20 March 2023The Big Picture
Gootmud @115... I think you might benefit from a better understanding of how the greenhouse effect operates to warm the surface. In one sense, you are correct that the "saturated" in the sense that from the surface IR is going to interact with CO2 molecules. But the effect continues up through the vertical profile of the atmosphere, and since CO2 is a well-mixed gas, this is occurring at every level. The effect continues until IR reaches "emission altitude."
We know the earth emits at 255K (-18°C). The point in the atmosphere where it cools to that temperature is the effective emission altitude for IR leaving the earth. Lower altitudes can be "saturated" but what matters is the thermal gradient. As you add more CO2 that effective emission altitude rises, and when it rises the surface warm.
And that is all a very critical part of the Big Picture, here.
 Moderator Response:
[PS] Any further discussion of the saturation myth belongs here which also deals with the misconceptions in detail.
Gootmod - I would ask you to please use the "search" function, (top left) or the Arguments menu option to find frequently discussed points rather than here. -
Rob Honeycutt at 04:58 AM on 20 March 2023The Big Picture
Bart @116... You asked, "Yes I do agree with most of that, so whats the point?"
My point is, you're claiming that the Netherlands would see some level of benefit from the gravitational effects of the Greenland ice sheet melting, and that is demonstrably incorrect. Again, as your own citation states, the effect on the Netherlands is negligible. In other words, there would be little or no effect at all.
-
Eclectic at 04:51 AM on 20 March 2023The Big Picture
Gootmud @118 ,
I recommend you trust common sense. Give it a try !
No need to follow the alarmist contrarians at WUWT & similar. You have allowed yourself to be seriously misled. (But why did you choose that?)
-
Rob Honeycutt at 04:49 AM on 20 March 2023The Big Picture
Bart @116... The paper you're citing to making this claim says the opposite. It's saying there is virtually no effect on SLR in the Netherlands. The maps you keep posting from that paper confirm exactly this, that there is virtually no effect. It's at the zero point on the scale, so it is not taking away anything and not contributing anything.
-
Bob Loblaw at 04:47 AM on 20 March 2023The Big Picture
Bart @ various posts...
You don't see the problem with comparing numbers in % and mm/yr? You do understand the importance of units in geophysical measurements, don't you? 32°F is not warmer than 15°C. A person walking at 6km/hr is not moving faster than an airplane doing mach 0.8.
% is a ratio between two values that use the same units. It has a numerator and a denominator. The mm/yr in your figure in comment 84 are a "relative sea level change" - they are a difference from some unspecified base. They need context to become meaningful, and comparison is only possible if you can resolve differences in context and produce numbers with the same units.
Repeatedly in this forum, you fail to give context to quotes, diagrams, papers, etc. You change contexts at a whim, making your comments hard to follow and difficult to perceive. If you think people are misunderstanding you, then spend more time preparing your comments.
Now, back to your diagram posting in #84 (and repeated in #94). You failed to give context - in particular, you failed to given any indication of what those values are relative to. You also failed to give any source, until I asked. You didn't even include the caption that goes with the figure. Here is the figure, with caption:

Note that the caption says "relative sea level variations due to the gravitational and Earth rotational effects of ice mass loss". [Emphasis added]
Do we have any other things to consider as context? How about the last paragraph of the paper's introduction?
We stress,however, that we consider, here, only the gravitationally consistent signature of ice melt. We do not include the response of ocean dynamics to the additional influx of fresh-water nor other changes in ocean dynamics due to predicted climate change, which can have a significant impact on RSL over decadal timescales. We also do not include spatially variable thermosteric effects on sea level.
So, figure 2 in their paper has a lot of context that you have left out. What do they say about their analysis? At the bottom of page 623, they say:
It is important to consider the separate fingerprints of RSL from the major sources to investigate their individual gravitationally-consistent “fingerprints”, but for present-day and future trends in sea level, it is the combined signal that is important. To first order, this can be approximated as the sum of the individual sources. We show the combined RSL changes, from all land ice sources considered, in Fig. 4.
And here is their figure 4:

Things aren't looking so rosy for The Netherlands in that image. It certainly is not going to escape the effects of rising sea levels.
What else do Bamber and Riva have to say about their work?
In addition to GIA and surficial mass exchanges, there are two processes within the oceans that affect relative sea level. Steric effects (density changes due to salt and heat content variations) were responsible for about a quarter of the total SLR rise over the last 50 years, increasing to almost a half since 1993 but with large regional variations.
The paper clearly indicates that this regional fingerprinting (as displayed in their figure 2) is only one small part of a Big Picture (to get back to the topic of this blog post).
One more aspect of the paper you link to: it is doing an analysis base on Grace and other data up to 2008 - it is not a projection into the future. They even put a caveat in their Methods section (p622):
It is important to note, however, that this flux is time-evolving, including during the period of interest in this study. As a consequence, both the amplitude and pattern of RSL considered here may change in the future.
In short, you are frequently leaving out context of the information you provide - and as a result you are way over-stating the significance of what you present. Whether this in intentional or not, we cannot know.
All of this comes back to my very first question to you after your first comment here:
What exactly is your point?
You would be much better off with a small number of well-thought-out, reasoned, well-referenced posts than the scatter-blast that you've been doing.
-
Gootmud at 04:28 AM on 20 March 2023The Big Picture
Eclectic @117,
So...trust the experts?
-
Eclectic at 04:16 AM on 20 March 2023The Big Picture
Gootmud @109 ,
you seem very alarmed at the imminent prospect of Earth's oceans freezing over or becoming boiling hot. Have you been reading alarmist blogs such as Dr Judith Curry's ? . . . or the even less scientific WattsUpWithThat ? Warning ~ those "contrarian" sources are lacking in common sense.
And there is no need for you to be alarmed about climate scientists using "models". The scientists are not clueless about Earth's future climate ~ they are guided by a good knowledge of basic physics plus knowledge of Earth's climate responses to altered Greenhouse Gas levels in the past millions of years. And also by recent responses to volcanic aerosol events and minor fluctuations in solar output.
No models are required to get a straightforward understanding of how climate changes occur. Please feel more relaxed, and take the time to educate yourself from genuinely scientific sources.
But you need to be careful not to be fooled by the many BS sources (such as Curry's or the WUWT mentioned above).
-
Bart Vreeken at 03:50 AM on 20 March 2023The Big Picture
Rob Heneycutt, back to your original remark @74. There you say
"Hang on. Am I missing something or is Bart actually thinking that the gravitational mass of Greenland is going to pull sea level away from The Netherlands, when it's 3000km away, making their impacts of SLR nominal? Surely not."
Yes, I am actually thinking something like that. But it's a little different. At the moment the gravitational mass of the ice is attracting mass. 3000km is no problem, the influence goes much further. So, because of the ice mass the sea level here is higher then it should be without the ice. When the ice melts a part of this effect is gone, and because of that the sea level will drop here. On the other hand, there's the meltwater that distributes over the ocean. That aspect makes the sea level rise. The sum of these to is slightly positive.
And now you say:
"They're talking about fractions of a millimeter per year. So, at maximum, they're saying the effect around Greenland (deep blue) over the course of the next century would be on the scale of 5 cm, out of a potential of 1-2 meters of SLR."
Yes I do agree with most of that, so whats the point? The 2 m SLR is a bit to wild, KNMI talks about max 1.2 m in 2100.
-
Gootmud at 03:49 AM on 20 March 2023The Big Picture
MA Rodger @110, saturation is already here. More CO2 can't make the sky much darker than it already is within its absorption bands.
Negative feedback effects and magnetic fields are likewise neither magic nor speculative. They're demonstrably real physical phenomena, just like the greenhouse effect. Figuring out how all these factors interact to create warming or cooling climate is a dizzyingly complex job that can only be attempted with computer models.
Moderator Response:[BL] Frankly, Gootmud, you are very badly misinformed.
If you want to talk about saturation, the place to learn where you are wrong is on this thread:
At a guess, your "magnetic fields" probably has something to do with cosmic rays. Here is where you can find out you are wrong:
https://skepticalscience.com/cosmic-rays-and-global-warming.htm
For computer models, you need to go here:
And please read the Comments Policy.
-
Rob Honeycutt at 03:33 AM on 20 March 2023The Big Picture
Gootmud @102... One correction there. Arrhenius' work wasn't a thought experiment. It was actually based in what was mathematically understood at the time about radiative absorption spectra and the product of extensive calculations, all done without benefit of computers. Just lots of laborious pencil and paper calculations, I'm sure with the help of a small army of lab assistants.
-
Rob Honeycutt at 03:28 AM on 20 March 2023The Big Picture
For purposes of clarity...
Bart, @108 you stated, "On global scale this meltwater isn't neglectable (sic), and on locale (sic) scale (western Europe) the gravity effect isn't neglectable (sic). The last two things can neutralize each other. I hope it's clear now."
On a global scale there is clearly an important effect.
On a local scale (western Europe) the effect is negligible, meaning almost no effect at all, positive or negative.
The part where you say, "[t]he last two things can neutralize each other" is completely wrong. This is what I'm trying to explain to you.
You have made a very specific claim about the science. You have provided a citation to research in support of that claim (both good), but your interpretation of the citation is in error.
This is the time where it would be rational to carefully think about this, admit your error, and move on.
-
Rob Honeycutt at 03:12 AM on 20 March 2023The Big Picture
Bart... At this point I would highly suggest you thoroughly read the paper you're citing because you're just not grasping what they're discussing. In particular take note of the scale of the maps. They're talking about fractions of a millimeter per year. So, at maximum, they're saying the effect around Greenland (deep blue) over the course of the next century would be on the scale of 5 cm, out of a potential of 1-2 meters of SLR.
The region they refer to (northern Europe including the Netherlands, Atlantic coastline of Germany and along theArctic coastline of Russia [Fig. 2a]) would have a negligible effect, meaning neither net positive nor net negative. In other words, no effect.
Here is a link to the paper so you don't have to look it up again. Please read it thoroughly and carefully.
-
Rob Honeycutt at 02:58 AM on 20 March 2023The Big Picture
Bart @108... No, I have not made the wrong interpretation of the text. I'm reading it correctly. The word is not "neglectable," it is "negligible." And "negligible" means it's so small that it can be ignored. The word "neglectable" in the context of this discussion is nonsensical.
-
MA Rodger at 02:20 AM on 20 March 2023The Big Picture
Gootmud @109,
CO2 will not "saturate" prior to the planet warming to ridiculously high levels. The potential for some magic negative feedbacks to counteract further GHG warming or for some magnetic field effect to appear is lower enough to be ignorable. And I don't see why you need complex models to tell you that.
-
Gootmud at 01:05 AM on 20 March 2023The Big Picture
Eclectic and John Mason @104
We do need models to predict whether it will keep on warming. As CO2's absorption spectrum saturates, it can't trap more heat. Negative feedback effects like clouds might nullify any warming. Temperatures might drop due to independent effects like magnetic field changes much more influential than the greenhouse effect. We might be at 600ppm, freezing, and looking for ways to warm the Earth and slow the advancing ice.
Without models that account for all these effects, we.know nothing about future temperatures. We don't know ranges of likely changes. We don't even know the sign. A model need not be perfect--no model is ever perfect--but it must be representative of all the relevant physics if we are to trust its output.
-
Bart Vreeken at 20:38 PM on 19 March 2023The Big Picture
Rob Honeycutt @91
Unfortunately, you made a wrong interpretation of the text. The 'neglectable' is about the influence of meltwater from Greenland in western Europe. On global scale this meltwater isn't neglectable, and on locale scale (western Europe) the gravity effect isn't neglectable. The last two things can neutralize each other. I hope it's clear now.
-
Eclectic at 17:51 PM on 19 March 2023The Big Picture
Gootmud @106 , I've no argument against vitamin D, in moderation.
But when you apply common sense to the situation, it is evident that the "thousand other effects" must be so exquisitely balanced against each other as to be in toto largely insignificant in comparison to the well-known Usual Suspects [insolation, albedo, aerosols, and of course the biggies of the Greenhouse gasses group].
As a follower of (but not disciple of) the vague hand-wavey arguments put forward by Dr Curry, that forces unknown to human science are steering our planet's climate . . . I must say that Dr Curry is a disappointment, for she has provided no worthwhile evidence to back her statements.
I will say two points in Dr Curry's favor :-
(A) She has not actually mentioned Martians in her testimony to Congressional Committees ;
(B) She is not a science-denier of the Greenhouse Effect.
-
Gootmud at 17:05 PM on 19 March 2023The Big Picture
Eclectic @21,
Knowing about a greenhouse effect in principle gives us no guidance at all about what to do in practice, since a thousand other effects are also at work.
In principle sun exposure causes skin cancer. Does it follow we should remain indoors at all times? Of course not, because a thousand other principles also apply. We need to do things. We need vitamin D. We have evolved defenses against skin cancer. And so on.
-
John Mason at 16:26 PM on 19 March 2023The Big Picture
-
John Mason at 16:24 PM on 19 March 2023The Big Picture
Just having first coffee of the day so will deal with comment #100 in a piecemeal fashion.
"Sections 6 (Human GG are causing global warming) and 8 (warming will continue) overstate the case. We know those to be true not from a simple application of "fundamental physics" but from elaborate computer models trying to approximate physics too complex for us to grapple with any other way."
Assuming the first principles of this topic are correct (they are) then how can that statement be inaccurate? We've known for over 150 years that if GHG concentrations are driven upwards, then a warmer climate will be the eventual result and that the warming will take decades to develop to its fullest extent. Now that may be a blunt object approach, but remember that set of conclusions was reached long, long before computers were around.
Models are not perfect but nevertheless extremely useful. They help us interrogate complex and highly variable systems to see how they respond to changes in those variables. Think of them as tools in the tool-kit, alongside observations, human resources, basic principles and so on. For we don't need models to tell us it will carry on warming the more CO2 emissions grow. We;ve known that all along. -
Eclectic at 16:09 PM on 19 March 2023The Big Picture
Gootmud @102 ,
Quite agree, if you want some fine-tuning of predictions of future conditions ~ then go do your best with some complex math workings & models. Not an easy task to be very "fine".
But if you need pragmatic guidance as to what policies & actions are needed right now in the present day ~ then models are not necessary. Common sense is the necessary ingredient . . . and if you are interested in fine-tuning, then you can reassess the situation in 10 years regularly.
The climate scientists already have a sufficiently good idea of the relative importance of CO2 forcings in the overall Big Picture. Unlike the delightfully vague insinuations made by Dr Judith Curry & Co., there are no hidden Martians mysteriously manipulating Earth's climate (or if there are, then they are tragically ineffective at it).
-
Gootmud at 15:15 PM on 19 March 2023The Big Picture
Eclectic @101,
Yes, everyone agrees with Arrhenius that more CO2 means warmer temperatures, all other things being equal.
Which is fine as a thought experiment, but in real life other things are nowhere close to equal. Questions like what the temperature will be in 2050, or how much CO2 matters versus other climate drivers, require a much more detailed understanding of climate dynamics. Which is why researchers have spent decades developing elaborate computer simulations. These models are indeed vital to many of the article's claims.
-
Eclectic at 14:39 PM on 19 March 2023The Big Picture
Gootmud @100 ,
you are right that shutting down the old reliable (fossil fuel) power sources is premature, pending the establishment of a fully resilient new renewables and/or nuclear power system. That's simply common sense. Just as it's simply common sense to press ahead rapidly to achieve "Zero Nett Carbon", even though that will take decades to complete the transition.
But you are in the wrong, to think that "models" are vital (or even mildly important) in making a sensible pragmatic assessment of the climate situation. For example, back in the 1890's [not a misprint] a scientist was able to make a reasonable assessment of what happens as CO2 atmospheric level increases. All he needed to use was a pencil & paper [not a model or a computer in sight]. Granted, he had a better brain than me (and possibly than you, too). He was not in any way dependent on complex "models". Nor, using common sense, do the conclusions of climate scientist of today need more than basic physics ~ helped along by paleontological knowledge of Earth's climate history.
Economics ~ yeah, not really much of a science. Too much Friedman and freedom from common sense.
-
Gootmud at 13:49 PM on 19 March 2023The Big Picture
This article starts off strong with the first five sections.
Sections 6 (Human GG are causing global warming) and 8 (warming will continue) overstate the case. We know those to be true not from a simple application of "fundamental physics" but from elaborate computer models trying to approximate physics too complex for us to grapple with any other way.
To substantiate the statements, the article needs to show those models are rock solid and do reproduce all the relevant physics. But section 11 (legitimate unresolved questions) acknowledges the opposite.
The subsequent sections on net benefits and risks are therefore even shakier, because they rely on another layer of computer models. Like many of us post pandemic, I've become much more skeptical of pronouncements attributed to unnamed "experts" bearing computer models. Even on their own, state of the art economics models can predict next quarter's GDP only two quarters after it ends. For the article to persuade effectively, these model dependencies need buttressing.
The risk discussion needs to be brought up to date in light of the European energy crisis, which has shown "better safe than sorry" has a faulty premise. Shutting down cheap, reliable power sources is not safe at all but introduces massive hazards including economic collapse and war.
-
One Planet Only Forever at 13:33 PM on 19 March 2023The Big Picture
I find Bart Vreeken’s comments interesting, but not in the same way that Bart appears to be interested.
My interest is the Big Picture of the future of humanity and the development of sustainable ways for humans to share the limited capacity of this planet to be lived on sustainably, to not be compromised by the impacts of human activity. A significant part of that interest is understanding the possible peak effects of the harmful accumulating impacts of continued fossil fuel use.
Bart @84, starts with: “MA Rodger @82 your quote is about the global sea level rise, not the local SLR.” The set of images Bart presents are about ‘global sea level impacts’ of the loss of ice due to global warming. But Bart’s interest is limited to the impact on the Netherlands of ice loss from Greenland. The other presented ice loss evaluations do not ‘interest’ Bart as much. This selective regional, rather than Big Picture, interest can be observed in many of Bart’s comments.
Bart’s comments @533 and @537 on the recently updated SkS Climate Myth “Is Antarctica losing or gaining ice?” appear to be their first presentation (March 9, 2023) of what they find ‘interesting’. It is essentially the following: The most recent heavy snow fall on Antarctica, rather than all the other history of events on Antarctica, may be indicating the future of Antarctica. Why would that be ‘interesting’? Maybe because of what happens to the Netherlands due to ice loss from Antarctica as shown in the image set of Barts’s comment @84 referred to above.
And in Bart’s comment @560 indicates they live in the Netherlands and are concerned about sea level rise but “We have to monitor Antarctica very well, try to understand how it works, try to predict what will happen. But not with panic, that won't help us.” Their ‘interest’ in the potential that the most recent year of heavy snowfall on Antarctica indicating a very different future is like the claims that the lack of warming after 1998 indicated a very different future than the ‘panic about ending the harmful impacts of fossil fuel use, especially the global warming impacts. Many people tried to claim that post 1998 temperatures indicated ‘the end of the warming that some people were panicking about’. And Bart appears to be doing a similar thing by trying to claim that this recent year in Antarctica is a turning point of behaviour in Antarctica (as Bob Loblaw tried to point out in his comment @534 in response to Bart’s comment @533).
There is a wealth of evidence in Bart’s comment history that appears to indicate that their interests are not Big Picture. Their interests appear to be much smaller/narrower. They appear to be seeking ‘positive perceptions from the perspective of short-term regional interests’.
They may be correct about the interpretation of the Green lines of the images in their comment @84 and @87 ... but their lack of interest regarding the potential peak impacts (way beyond 2100 levels) on places like Bangladesh is what I find “Interesting” (and not in a Good Way). See My comment @68.
-
Rob Honeycutt at 11:23 AM on 19 March 2023The Big Picture
Bart @94... It's strange that you claim Bob doesn't understand the figures when you are the one directly contradicting what the authors of the figure are stating when they clearly say, "There is a negligible impact on the rest of northern Europe including the Netherlands..." Negligible, as in, "unimportant" and "not worth considering."
Avoiding responding to my posts doesn't make them go away.
-
Bart Vreeken at 08:53 AM on 19 March 2023The Big Picture
Bob @96 here's the source of the figure:
I don't understand your problem with % and numbers in mm/yr.
Again: In the example on the map there is a mass loss of 166 Gt/yr. 361.8 Gt of ice will raise global sea levels by 1 mm. So, in this example the sea level rise will be 166/361.8 = 0,46 mm. 12.5% of this is 0,0575 mm/yr.
Moderator Response:[RH] Shortened link so it didn't scroll off-page
-
Bob Loblaw at 06:09 AM on 19 March 2023The Big Picture
Bart @ 94:
Please explain how you make comparisons between numbers in % and numbers in mm/yr.
And please provide a reference for your interpretation of the "relative sea level change" - e.g. the source of the figure. Your interpretation of other figures and numbers in this discussion has been exceedingly unreliable.
-
John Hartz at 04:58 AM on 19 March 2023The Big Picture
The following article may contain updated data pertinent to the ongoing discussion of sea level rise on this comment thread.
NASA Uses 30-Year Satellite Record to Track and Project Rising Seas, Staff, NASA's Global Climate Change, Mar 17, 2023
-
Bart Vreeken at 04:22 AM on 19 March 2023The Big Picture
Hi Bob Loblaw, I'm afraid you don't understand the figure well.
Above a) you see the mass loss of Greenland where the calculation is based on. It says -166 Gt/yr. This causes a global sea level rise of something like 0,46 mm/yr. Due to the gravitation effect there are places on earth where the sea level rise is less then that, and places where it's more then that. The border between these two area's is the green line on the map between Africa and South America and in the Pacific. So, the Netherlands are in the area with less then 0,46 mm/yr sea level from Greenland, but it's more then zero. Then there is an other line, between yellow en blue. In the blue area there is no sea level rise by Greenland at all. Instead there is a drop of the sea level.

-
Bob Loblaw at 03:26 AM on 19 March 2023The Big Picture
Bart @ 87:
Thank you for your clarification of your position, and for providing such an excellent example of your complete incompetency in this matter.
Yes, 12.5 is larger than zero.
The problem is that your 12.5 magic number is a percent. As in "1 is 12.5% of 8", or "25 is 12.5% of 200".
In my comment 86, I am looking at the figure you provided in comment 84. The zero value in that figure has units of mm/yr. A value of zero means no difference from the global mean. If you want to convert any of those numbers to a percent, you need to know what the global mean value is, in mm/yr.
...except for one of those values. Regardless of what the global mean value is, a location where the relative sea level change differs from the global mean by 0.00 mm/yr will have a sea level rise that is 100% of the global mean.
So, the skill-testing question is:
- Which is larger? 12.5% of the global mean, or 100% of the global mean?
Remember, you've already claimed that 12.5% is higher.
-
Bob Loblaw at 03:12 AM on 19 March 2023The Big Picture
Rob @ 89:
Sorry, yes, I'm sure you understand the process. The way you'd worded it left it open to others thinking you questioned the gravitational effects, rather than just questioning the effect on The Netherlands, 3000km away.
-
Rob Honeycutt at 03:04 AM on 19 March 2023The Big Picture
Bart @84... If you were to actually read the paper you got those images from (like I just did) you would find the authors state, "There is a negligible impact on the rest of northern Europe including the Netherlands, Atlantic coastline of Germany and along theArctic coastline of Russia (Fig. 2a)." [emphasis added]
That's very different from what you're claiming. You're claiming, "Netherlands are close enough to Greenland to take profit of this effect..."
"Negligible impact" and "close enough to take profit" are very different conclusions, the former being the conclusions of the researchers and the latter being something you're making up on your own without the benefit of a full understanding.
Negligible means "so small or unimportant as to be not worth considering; insignificant."
-
Rob Honeycutt at 02:50 AM on 19 March 2023The Big Picture
Bart @84... You were doing so well in your explanation up to the point you started making up stuff on your own, like: "Netherlands are close enough to Greenland to take profit of this effect..."
The Netherlands are 3000km away.
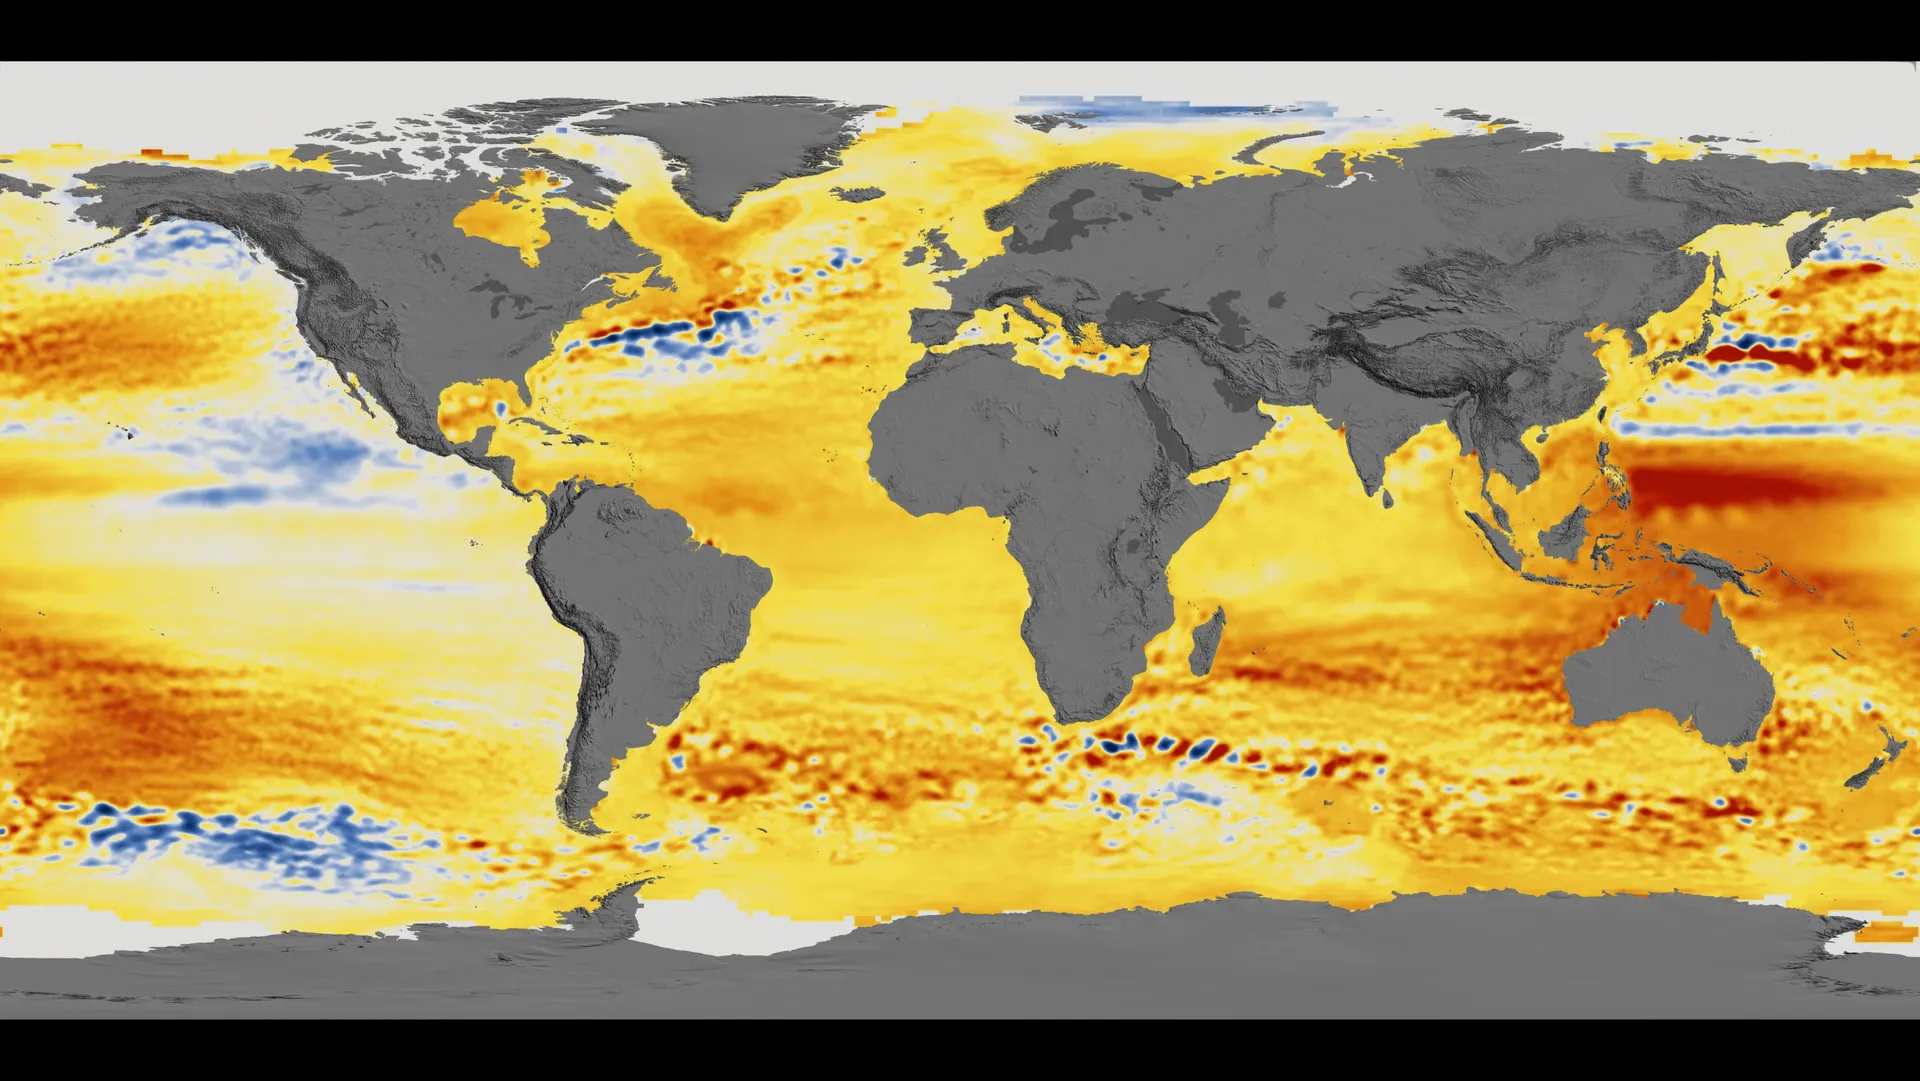
Here is a map from NASA, created through the JASON and TOPEX satellite missions to measure SLR over the past 23 years. This map represents the change in SLR over that period. Blue/white areas are where SL has fallen or stayed the same. Orange/red are SLR.
Now, look close at the area between Greenland and The Netherlands.
-
Rob Honeycutt at 02:24 AM on 19 March 2023The Big Picture
Bob @76... I'm very aware of the gravitational effects of the ice sheet. I'm just curious is Bart actually believes it has a substantive effect on The Netherlands 3000km away.
-
John Hartz at 02:17 AM on 19 March 2023The Big Picture
Speaking of Greenland, what is described in the following news article does not bode well for the future of the Greenland ice sheet...
Greenland temperatures surge up to 50 degrees above normal, setting records by Ian Livingston & Kasha Patel, Weather, Washington Post, Mar 8, 2023
The lede for this article:
The record-breaking warmth is raising concerns about melting summer ice.
-
Bart Vreeken at 23:08 PM on 18 March 2023The Big Picture
So, now michael sweet @72 says my 12.5% was too low, and Bob Loblaw @86 says it was too high. Who is right? One thing is for sure, it can't be me.
-
Bob Loblaw at 22:35 PM on 18 March 2023The Big Picture
In fact, looking closely at the upper right diagram of Bart's comment # 84, we see that The Netherlands falls pretty close to the 0.0 relative sea level change boundary in the colour code (light blue vs. light yellow).
-
Bob Loblaw at 22:32 PM on 18 March 2023The Big Picture
Bart @ 84: "but not enough to avoid sea level rise from Greenland completely."
....and none of these diagrams or papers you refer to support your original claim that The Netherlands would only see 12.5% of the global mean sea level rise.
-
Bart Vreeken at 22:30 PM on 18 March 2023The Big Picture
MA Rodger @82 your quote is about the global sea level rise, not the local SLR.
This is how it works. The Greenland Ice Sheet has a lot of mass, so it attracts sea water. Due to that, the sea level in a large area around Greenland is higher then it should be without the mass of the ice. When the ice starts to melt a part of this effect disappears. So, around Greenland the sea level will drop, not rise. Netherlands are close enough to Greenland to take profit of this effect, but not enough to avoid sea level rise from Greenland completely.
-
Bob Loblaw at 22:28 PM on 18 March 2023The Big Picture
Bart @ 81: "Well, that's great. Do you really think I would write about Greenland when I didn't know how it works? "
I only know as much about you as I have read in your comments here. Based on what you have written here, my overwhelming impression is that yes, you would write about Greenland when you don't know how it works.


