


 Arguments


Recent Comments
Prev 432 433 434 435 436 437 438 439 440 441 442 443 444 445 446 447 Next
Comments 21951 to 22000:
-
SemiChemE at 12:27 PM on 23 March 2017Models are unreliable
Here are a few references, discussing the importance of Ocean-effects on global Climate Sensitivity.
Balmaseda, Magdalena A., Kevin E. Trenberth, and Erland Källén. "Distinctive climate signals in reanalysis of global ocean heat content." Geophysical Research Letters 40.9 (2013): 1754-1759.
Meehl, Gerald A., et al. "Model-based evidence of deep-ocean heat uptake during surface-temperature hiatus periods." Nature Climate Change 1.7 (2011): 360-364.
Raper, Sarah CB, Jonathan M. Gregory, and Ronald J. Stouffer. "The role of climate sensitivity and ocean heat uptake on AOGCM transient temperature response." Journal of Climate 15.1 (2002): 124-130.
There are many, many more such papers. Clearly, the oceans are very important to climate Sensitivity.
As for the evolution of Ocean Currents over time, here's a nice summary:
https://earth.usc.edu/~stott/Catalina/Oceans.html
As you can see, prior to ~30 million years ago, the arrangement of the continents was different, which had a dramatic impact on ocean circulation patterns. The Atlantic Ocean was much smaller and the isthmus of Panama had not formed. Given that Atmospheric-Ocean coupling is a major factor in determining climate sensitivity (see references above) and that due to geological changes in the configuration of the continents the Ocean circulation patterns were different, it is entirely reasonable to believe that climate sensitivities prior to 30 million years ago may have been different from those today. Thus, as I stated before, I would be very skeptical of the relevancy of paleoclimate data from >30 million years ago for predicting the modern climate.
Moderator Response:[PS] Fixed link
-
Johnboy at 11:03 AM on 23 March 2017In-depth: What Donald Trump’s budget means for US spending on climate change
For what it's worth, my past experience in a Government agency was that President's budgets, assembled by the Office of Management & Budget, are not much more than an "exercise" for the administration to mostly display its philosophy with a general 10-year budget plan including spending and anticipated revenues. Our agency's budget office folks used to laugh that when it gets to Congress its given a glance and tossed under the desk and then they try to agree on Congressional Budget resolution, another 10-year "plan"which may or may not have much resemblance to the Presidents.
After all this, the real work goes to the Appropriations Commitees to knock appropriations to each of the agencies For the upcoming fiscal year. Lots of horse trading and "bringing home the bacon" back to the Congresspersons home District.
Borrowing from a phrase from the golf world, we used to joke, "Budget for show, appropriate for dough"
-
Tom Curtis at 10:08 AM on 23 March 2017Models are unreliable
PS inline @1029, SemiChemE's speculation is, I think, fairly obvious. Examples of changes in ocean circulation that would effect climate sensitivity include the opening of the Drake Passage between Antarctica and North America, the opening of the gap between Australia and Antarctica, the closure of the Central American Seaway between North and South Americas (with consequent strengthening of the Gulf Stream), and even the northward drift of Africa which is slowly strengthening the leakage of warm, saline water from the Indian ocean to the Atlantic Ocean, which leakage may have a significant effect on deglaciations. The extent of the effect on climate of these events is disputed in each case, but that they have some effect is, I think, incontrovertible. Each may have some role in the onset and/or intensity of recent glacial cycles; a sign that they have increased climate sensitivity over the geological average.
Nor are they the only geological changes that can impact climate sensitivity. Geological evidence shows that in periods with glacial caps climate sensitivity is greater. It follows that geological events that significantly increase or decrease CO2 concentrations will, respectively, decrease or increase climate sensitivity. The draw down of CO2 concentrations that resulted from the formation of the himalayas, therefore, has also likely increased climate sensitivity.
Despite agreeing with SemiChemE's speculation, however, I do not agree with his conclusion. We have climate sensitivity estimates across a very wide range of continental positions and glacial conditions. While the estimate of climate sensitivity from paleo data for one particular time may not be a reasonable analog of the modern Earth, we can expect the range of climate sensitivities across all times to constrain likely climate sensitivities today. In particular, we can expect modern climate sensitivity to be above within the range of climate sensitivities found in glacial conditions (as we are in a glacial condition).
Moderator Response:[PS] Understodd. Thank Tom, and apologies to SCE for not following his line of reasoning.
-
Tom Curtis at 09:22 AM on 23 March 20172017 SkS Weekly Climate Change & Global Warming Digest #11
Wol @15, you are correct. My statement was over general, and was not believed by me in its over general interpretation. I should more correctly have said that conservative parties are the enemies of science, and restricted that claim to the English speaking nations in the Americas and Australasia.
-
michael sweet at 07:16 AM on 23 March 2017Models are unreliable
SCE,
Here is a more suitable thread to continue this discussion.
Moderator Response:[PS] Thank you
-
CO2 effect is saturated
Nahle's incompetence isn't confined to how the greenhouse effect actually works.
He has claimed (nearly halfway down this page) that this sequence of pictures proves that Mars was warming between 1995 and 2005 because the polar caps were shrinking, implying that it must be the sun.
He apparently didn't understand (or forgot to tell his readers!) that each picture was taken a little more than one Martian year after the previous one, and that the changes in the polar caps are almost entirely due to seasons! (more on that in the thread Mars is warming)
A similar sequence at 13 months intervals of the Arctic from September 2005 to March 2012 would seemingly show a nearly 3-fold increase in sea ice extent, but we know what really happened in September 2012, don't we? -
Mal Adapted at 04:17 AM on 23 March 2017Global warming is increasing rainfall rates
I'll call SkS readers' attention to a germane US National Academy of Sciences report, Attribution of Extreme Weather Events in the Context of Climate Change. You can order a printed copy for $71.10, but you can download the PDFs for free.
-
michael sweet at 03:10 AM on 23 March 2017Models are unreliable
SCE,
Simply repeating a false claim that you read on the internet does not make it an argument. Your claim that "the social costs of planning for an overly pessimistic ECS would also be tremendous" is simply false.
The US Academy of Science warned President Johnson in 1965 that AGW would be a crisis for mankind in the future. How long do you want to wait?? Scientists have been sure since the 1990's that this is a critical issue that must be addressed immediately and you want to wait?
Let us look at the worst case . We start to seriously build out renewable energy (WWS). After 10 years it is more expensive than we expected and the consequences of AGW are less than we expected. We stop the build. We end up wasting a few hundred billion dollars on the energy build. The money goes to pay workers who spend it and improve the economy. It is a wash overall.
Since every time the IPCC puts out a new report it increases the damage already caused it is extremely unlikely the worst case will happen. The report I linked above (which you do not appear to have read) documents billions of dollars damage that are being caused already. To mention only today's newspaper, wildfires caused by AGW have caused several hundred million dollars damage already and the fire season has barely begun. The 11 million people who will lose their homes from sea level rise in Florida alone can go live in your house.
We wasted over two trillion dollars unsuccessfully trying to steal Iraq's oil. If we switch to WWS we will not need half the military we currently have. Jacobson estimates that WWS will cost less than conventional energy. The cost of solar and wind have plummeted since Jacobson made these estimates so his cost estimates are too high. You must support your claim that fossil fuels have a comparable cost to WWS. I have not seen any serious analysis that suggest fossil fuels are as cheap as WWS when all costs are included.
The cost of wind and solar have plummetted the last few years and they are now the cheapest form of energy period. You are arguing to preserve more expensive energy sources for what?? Jacobson identified the need for alternate materials for the turbine magnets years ago. Iron nitride magnets are one alternative. Others are being developed. Where are you going to get the beryllium you need for all those nuclear power plants?
No mater what is done, fossil fuels will run out in a few decades. When do you think we should start the switch to WWS?
You are skeptical of WWS. Perhaps if you read more about them you would be less skeptical. Read the Jacobson 2015 article I linked above.
Several hundred thousand people per year die from air pollution in the USA alone from your preferred energy source. All these people will live longer if we switch to WWS. The cost of medical care caused by coal pollution alone is over $40 billion per year. We will save all that money.
I am amazed that you claim (without any supporting data or citations) that WWS is a risky choice and then you are in favor on Nuclear. Toshiba is on the verge of bankruptcy from its nuclear adventures. No market economy will build any nuclear for decades. Raw materials (like beryllium and uranium) do not exist for a widespread nuclear effort.
Moderator Response:[PS] This is wandering completely offtopic. Unless there is comment on modelling, please use the search box to find a more appropriate thread and continue there.
SCE - please avoid stating opinions and hand-wavey arguments without providing the data/sources which form the basis of your opinion. And stick to topic.
-
vmarletto at 00:58 AM on 23 March 2017Global warming is increasing rainfall rates
Is the first letter of this article missing?
-
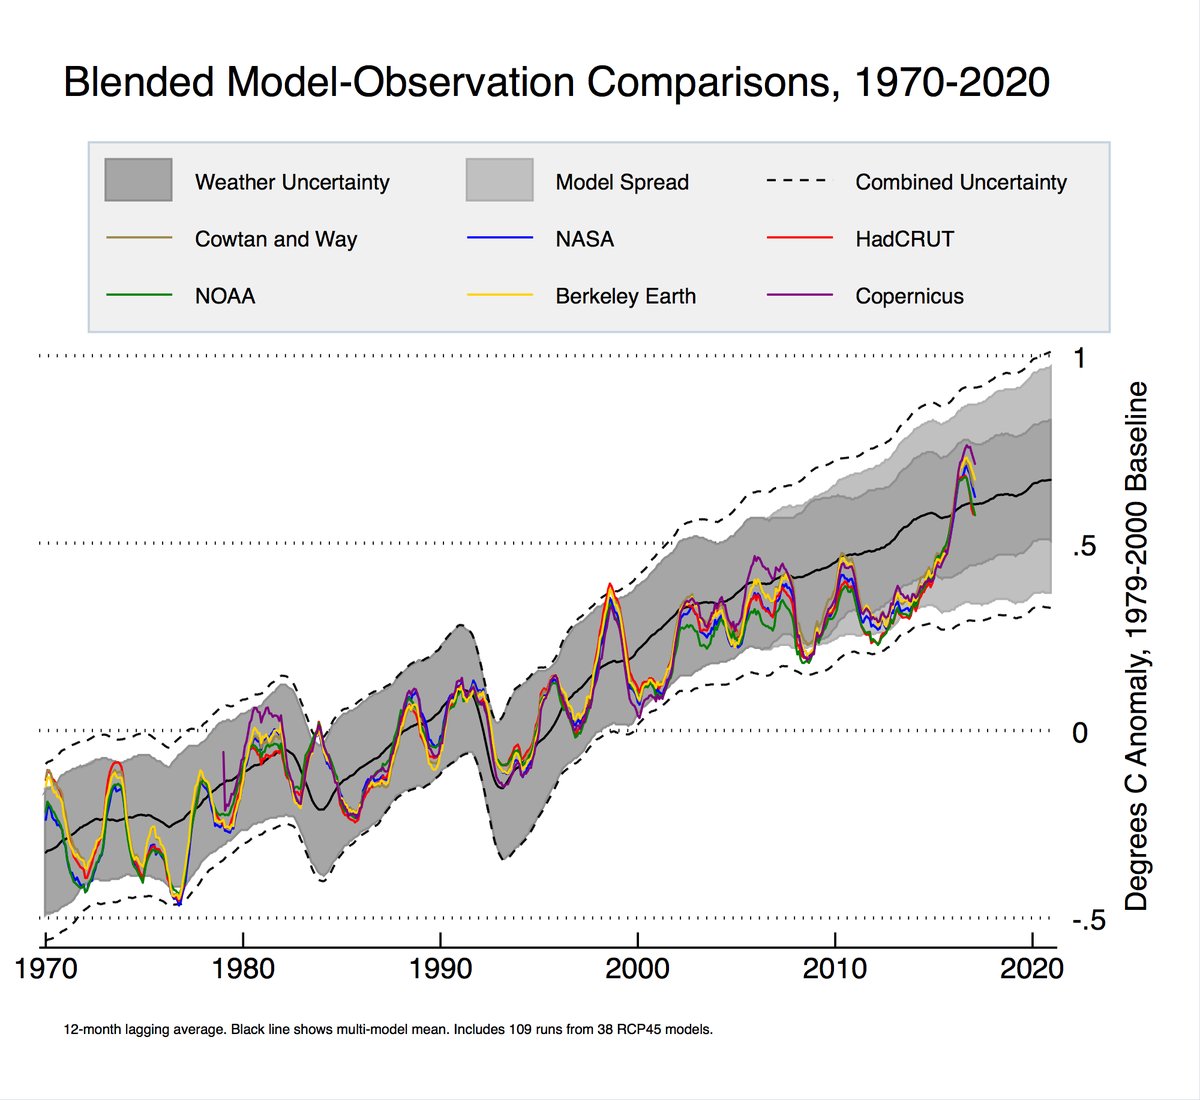
Rob Painting at 18:19 PM on 22 March 2017Models are unreliable
Latest climate model vs observations update - courtesy of Zeke Hausfather @ Berkley Earth:
-
SemiChemE at 15:26 PM on 22 March 2017Models are unreliable
michael sweet @1024
Why should I cite a peer reviewed report to back a claim that I never made? I never said that changing to renewable energy will be bad for the economy.
I stated that, "the social costs of planning for an overly pessimistic ECS would also be tremendous."
So, let's go for a worst-case IPCC ECS estimate of 6degC/doubling. How much would the U.S. need to cut it's CO2 emissions to avoid a 2degC increase in global temperatures? What would such a reduction cost?
Now don't forget that in the U.S. we don't make the best choice, rather we make the most politically expedient choice. So, how would we likely make up the difference? Probably by expanding fracking of natural gas (basically, what we've already been doing) and by expanding our subsidy to the Corn industry for ethanol-based fuels. Of course, the latter is especially troublesome, since it would cause food prices to spike, which would hit the most vulnerable in our society and because of the intensive use of hydrocarbons in agriculture, it would probably do little to reduce CO2 emissions.
It's important to get the science right and make reasonable attempts to adapt on reasonable time-scales.
As for renewable energy, it has it's place, but I'm skeptical it can be implemented at sufficient scale to replace our existing infrastructure in a timely manner. Large-scale adoption of wind and solar will also run into vital material shortages (eg. niobium for generator magnets). Finally, government subsidies to encourage adoption of renewables are tricky and can lead to unintended consequences (see Arizona's attempt at encouraging alternative fuels: http://www.sfgate.com/politics/article/Arizona-Taxpayers-Fuming-Over-200-Million-2720374.php)
Finally, with respect to renewables, I think we'd be better off investing in Nuclear as it's a proven technology with scale sufficient to meet our electricity needs, but that's a debate for another time.
Moderator Response:[DB] Off-topic snipped. Please post on the topic of the OP of this thread. Other topics and threads can be found using the Search function.
Please note that posting comments here at SkS is a privilege, not a right. This privilege can be rescinded if the posting individual treats adherence to the Comments Policy as optional, rather than the mandatory condition of participating in this online forum.
Please take the time to review the policy and ensure future comments are in full compliance with it. Thanks for your understanding and compliance in this matter.
-
SemiChemE at 13:42 PM on 22 March 2017Models are unreliable
Glenn Tamblyn @1021 & 1023 and scaddenp @1028
The paleoclimate data is interesting, but I have concerns about how relevant it is for our world today and for predicting climate dynamics into the future. My biggest concern is that climate sensitivity is likely highly dependent on the prevailing ocean circulation patterns, since these dominate the heat exchange between the atmosphere and the oceans, thus amplifying or moderating greenhouse gas effects. For this reason I would be very skeptical of any conclusions based on data older than ~30 million years, since at that time the modern continents were still forming and ocean circulation must have been different. Presumably, there are other such factors that would make even more recent data of questionable value, though I'm no expert on the topic and would be interest to hear from anyone with such knowledge. Specifically, how relevant is paleoclimate data to today's world and how far back do we still have a modern climate system (eg. modern ocean and jetstream circulation patterns)?
My next concern is the accuracy and precision of the available climate record. During the instrument era (~200 years), we have daily, monthly, and yearly data, accurate to within tenths of a degree. By contrast, the error bars for paleo reconstructions are surely much larger, probably on the order of degrees or even tens of degrees. Furthermore, depending on the particular proxies, they often represent annual or at best seasonal averages. Thus, it becomes hard to distinguish a short-term period of extreme temperatures from a longer bout of moderate temperatures.
Finally, as I mentioned before, the paleo data is somewhat geographically sparse. So, what is interpreted as a large gobal climate shift may simply be a local, temporary abberation.
Now, I'll shift back to the topic at hand, which is"How reliable are climate models?". The problem is that if the data set against which you are validating the model has large error bars, significant uncertainties in the temporal resolution, and large spacial gaps, it becomes too easy to tweak the model such that it fits the data, but for the wrong reasons. For example, one of the biggest challenges for the models is handling cloud coverage. The unit cells are often much larger than individual clouds, so parameterizations must be used to represent cloud coverage. This means the entire cell has some "average cloud effect", which may or may not reflect reality. The result is that the model includes a "fudge factor" of cloud coverage, which cannot be independently verified.Another such factor involves aerosols and particulates (think Sea-spray or Dust storms). In these cases, you need to know both the variation in the particle and aerosol densities, as well as the sensitivity of the climate to these densities. Clouds, particulates, and aerosols are important phenomena, which are known to impact global temperature and climate, so you can't ignore them, but we are just beginning to understand the factors that drive them, so by necessity our current models are quite crude. This means, we can probably "fit" many models to match paleo data, but it doesn't mean we are doing it correctly or that those models will be able to predict the future climate.
Only in the satellite era are we beginning to get the proper instrumentation, so that we can monitor cloud, aerosol, and particulate densities so as to verify that the assumptions that are put into the models are reasonable. Because of this, I would say that our current models are not very reliable, but there is hope that within the coming decades they will become much better.
Moderator Response:[PS] You make the assertion "My biggest concern is that climate sensitivity is likely highly dependent on the prevailing ocean circulation patterns, since these dominate the heat exchange between the atmosphere and the oceans, thus amplifying or moderating greenhouse gas effects", implying unmodelled feedback effects. To me this looks like hand-waving in extreme so please provide some sources for supporting that opinion.
-
Wol at 11:07 AM on 22 March 20172017 SkS Weekly Climate Change & Global Warming Digest #11
Tom Curtis @ 5:
>>It is also fairly clear that conservatives are enemies of science.<<
Don't fall into the same paradigm as deniers, Tom, by implying that ALL Xs are Ys.
Because one is of a conservative disposition does not automatically mean that one's brain is offline. As a conservative I am perfectly capable of assessing the arguments and coming to the conclusion that the science is correct.
-
Leto at 09:16 AM on 22 March 2017CO2 effect is saturated
Considering the rebuttals by Tom Curtis @447 and by Walter Hannah at MA Rodger's link @448, the paper linked by Wake appears to be incredibly poorly conceived... But even if its flaws were more difficult to spot, it should be clear that any valid paper disproving the greenhouse effect would make its author both rich and famous. Not only would the author become the new darling of the Koch Bros, touring the world giving triumphant defences of BAU fossil-fuel policy, the author would collect the Nobel Prize and all the other accolades befitting a genuine Galileo who had successfully overturned decades of understanding. Instead, the paper remains deservedly unpublished and largely obscure, and not even the denialists have bothered funding a round of much-needed editing for this paper. Thus, even for those unable or unwilling to follow the scientific rebuttal, there are ample clues that this is nonsense. Wake might want to consider what it is about his own world views that made him miss those clues.
-
MA Rodger at 08:41 AM on 22 March 2017CO2 effect is saturated
Wake @445,
The denialist paper you link to is actually five years old now, one of a number of crazy climatological ideas promulgated by Nasif Nahle. Concerning that particular paper, Walter Hannah of the Lawrence Livermore National Lab addressed Nasif Nahle’s Shaky Math last year.
-
Tom Curtis at 08:10 AM on 22 March 2017CO2 effect is saturated
Wake @445:
1) If you are going to say "actual measurements are a lot more indicative of the real world than computer modeling" you should at least point me to actual measurements rather than just a crude mathematical model (which is what Nahle's calculations amount to).
2) Nahle uses surface values for CO2 and H2O concentration. Therefore, even if calculated correctly, he would only be calculating relative emissivity for back radiation at the surface - not the effective emissivity for radiation to space which is the basis of the greenhouse effect. Therefore, the best that can be said for Nahle's calculations is that he simply does not understand the theory of the greenhouse effect.
3) Nahle uses the formula for the emissivity of a 128.2:1 H2O/CO2 isothermal gas mixture. Therefore, at best all he shows is that if the an isothermal gas in a container was 100% water vapour, adding 0.78% CO2 would reduce the emissivity of the gas mixture relative to the 100% water vapour. He goes on to demonstrate that adding oxygen to the H2O/CO2 mixture would further reduce emissivity. The obvious point is that if adding oxygen to a H2O/CO2 mix decreases emissivity, adding a H2O/CO2 mix to an oxygen atmosphere will increase emissivity. That is, it will induce a greenhouse effect. For a more detailed exposition of this point, go here.
To summarize, Nahle's calculations do not apply to the atmosphere as a whole because it is not isothermal; do not calculate the strength of the greenhouse effect because they apply to the surface layer only, and cannot calculate the effect of the change in outgoing radiation due to the presence or absense of a gas; and are incorrectly applied in any event. Worse, they are not observations and do not produce an observationally testable hypothesis with regard to atmospheric radiation. In contrast, the theory he wishes to rebut is based on models that apply the type of formula he is using radiation band by radiation band, layer by layer across a large number of layers in the atmosphere, each of which is small enough to be approximately isothermal. Those models produce observationally testable predictions which have been compared to actual observations as with this example from 1969:
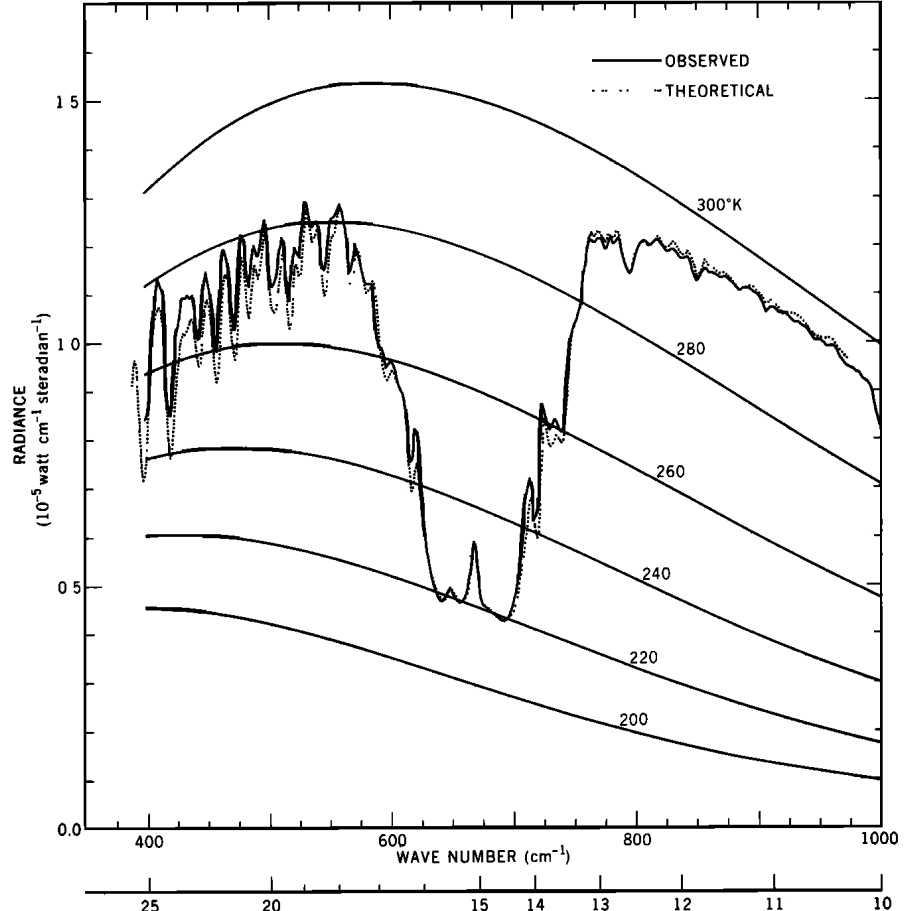
Those detailed, band by band, layer by layer models also predict a greenhouse effect from CO2.
-
Leto at 07:24 AM on 22 March 2017CO2 effect is saturated
Wake, your link points to a non-peer reviewed article with questionable conclusions, not to raw data as implied by your description of it as "actual measurements".
I will let more knowledgeable people comment on the alleged science in the article, but the article has not even been edited by someone who speaks English as their first language. If an article is to be taken seriously, proof-reading it is a minimum first step, followed by peer review.
-
Tom Curtis at 07:15 AM on 22 March 2017A Perfect (Twitter) Storm
michael sweet @40, it is helpful to put the results of Horton et al (2014), ie the paper on which the Real Climate article is based, into some context.
First, while the IPCC AR5 projected a 0.52 to 0.98 likely range for sea level rise in RCP 8.5, they add the significant qualifier that:
"We have considered the evidence for higher projections and have concluded that there is currently insufficient evidence to evaluate the probability of specific levels above the assessed likely range. Based on current understanding, only the collapse of marine-based sectors of the Antarctic ice sheet, if initiated, could cause global mean sea level to rise substantially above the likely range during the 21st century. This potential additional contribution cannot be precisely quantified but there is medium confidence that it would not exceed several tenths of a meter of sea level rise
during the 21st century."Therefore, according to the IPCC, the probability of a result exceeding the likely range is greater than the probability of it being below that range, but that the extent to which this is so is unquantifiable. To the extent that it does exceed it, according to the IPCC, it will be due to a partial collapse of the Antarctic Ice Sheet. Those experts who think the IPCC assessment is too low tend to think that the increased sea level rise will come from just such a collapse, and differ from the IPCC primarilly in their willingness to quantify the probality of the likelihood and extent of such a collapse in the 21st century.
Second, IPCC assessments represent an review of the evidence by a group of experts. It differs from a review paper in a journal primarilly in the far greater extensiveness of the peer (and non-peer) review of that results. As a review of the evidence, we should not expect the results to precisely match the results of a survey of expert opinion, although would should expect some similarity. Even if it were a survey of expert opinion, we would expect the upper bound to be set at "a value that 80% of experts think is the highest possible value" but rather at the median or mean estimate of the upper value by experts. That value would more closely approximate to the 95th percentile of a Probability Density Function (PDF) generated by averaging the PDF's of the experts. The box plots of expert opinion of the 5th, 17th, 83rd and 95th percentiles of expected sea level rise is shown in Figure 2 of the paper. Here is that part of Figure 2 relating to RCP 8.5 and 2100:

As an aside, I made a mistake in the text in that it should be Fig 2 b. In any event, by your of criteria expert opinion the upper limit should be above 2 meters, whereas by mine it is about 1.6 meters. For the 5th percentile, the lower limit should be below 0.5 meters by your criteria, and just above 0.5 meters by mine. In either case the IPCC underestimates the range of plausible outcomes.
Third, while the IPCC understates the likely consensus projection of sea level rise, it is a much better fit to the consensus projection of the most expert experts, ie, those with a h-index of 40 or above, whose likely range for RCP 8.5 is approximately 0.62 to 1 meter sea level rise by 2100 (see Figure 3 B). Again, this fits with the IPCC report being a review of the evidence rather than a statement of the consensus of the experts. Presumably the most expert of the experts will have a better grasp of the evidence, and certainly those with a higher h-index will have contributed more of the evidence that is being reviewed by the IPCC. This disparity of the most expert opinion, along with the significantly increased knowledge of the potential of Ice Sheet collapse that became available after the IPCC cut off period may be sufficient to explain the relatively optimistic position of the IPCC on sea level rise.
-
Wake at 06:35 AM on 22 March 2017CO2 effect is saturated
Tom Curtis - Thought you may not have seen this and since actual measurements are a lot more indicative of the real world than computer modeling it could be of interest.
http://www.biocab.org/Overlapping_Absorption_Bands.pdf
Moderator Response:[PS] Fixed link please learn to do this yourself using the link tool in the comment editor. Discussions here could be more fruitful if you tried applying some of your skepticism to your own sources.
-
nigelj at 06:34 AM on 22 March 2017In-depth: What Donald Trump’s budget means for US spending on climate change
Excellent summation. None of the cost cuts make any sense, and they will have a difficult time getting through congress, unless congress throws caution to the wind, and completely loose their minds. There's a risk of that. Anything seems possible these days.
There is no hard evidence of any inefficiencies at NASA, and the same cost cutting efficiency logic should apply to the military and border patrols anyway.
Trump wants to cut the very climate related spending associated with determing the exact areas of climate science that need more clarification like particulate emissions, clouds, etc. This looks calculated and cynical to disrupt the science as much as possible.
We are addicted to oil. It is like a drug that hits the same dopamine receptors in the brain as cocaine or sugar etc, with the same feel good factors and growing dependence. People are attached to big V8 cars or SUV's. It's a society wide, and global scale addiction.
-
william5331 at 06:11 AM on 22 March 201719 House Republicans call on their party to do something about climate change
These 19 must have kids and grandchildren. It tends to focus your attention.
-
michael sweet at 01:38 AM on 22 March 2017A Perfect (Twitter) Storm
JohnFornaro @38: Unfortunately, most scientists who study sea level rise consider the IPCC projections to be minimum sea level rise. According to RealClimate, a survey of sea level rise experts produced this graph:

Figure 2: Sea level rise over the period 2000-2100 for two warming scenarios (red RCP8.5, blue RCP3). The ranges show the average numbers given across all the experts. The inner (darker) range shows the 17 to 83 percentile values, the outer range the 5 to 95th percentiles. For comparison we see the NOAA projections of December 2012 (dashed lines) and the new IPCC projections (bars on the right).
For RCP 2.6 the difference is not that much, but for RCP 8.5 the low projection of experts is similar to the high projection from the IPCC. Because the IPCC always uses consensus numbers it ends up with low values for sea level rise.
It seems to me that while a low value that 80% of experts agree on is OK, for the high end they should use a value that 80% of experts think is the highest possible value. Apparently they use the high value that 80% of experts think is the lowest high value.
As side comment, when I searched on Bing for "Real Climate Sea Level Rise" Stephen Goddard was the first hit and several more hits from his blog were present. On Google the Real Climate article was the first hit. Where does Goddard get the money to buy the first place on Bing?
-
Mal Adapted at 12:09 PM on 21 March 201719 House Republicans call on their party to do something about climate change
For those not wholly despairing of the GOP, this is a hopeful sign. Wouldn't it be great if it signals a general turning away from irrationality by the party? Nah, that's too much to hope.
-
Tom Curtis at 11:32 AM on 21 March 2017A Perfect (Twitter) Storm
JohnFornaro @38. from the blog of Aslak Grinsted, a researcher into sea level rise, we have the following two graphs:


The images come from a discussion of Jevrejeva, Grinsted and Moore (2014).
-
JohnFornaro at 11:10 AM on 21 March 2017A Perfect (Twitter) Storm
Apologies for using a fone. This site is optimized for a desktop.
Anyhow, above, a comment was made in passing regarding a one meter rise in the oceans by 2100. This is more than a centimeter each and every year until then. Where is a link to a model or prediction which shows how much sea rise to expect in each year until 2100?
I'm rather familiar with the paucity of research in Scott Adams climate postings. I think that persuasion is a powerful tool for policymakers, but it is not the only way to make an argument.
T
-
nigelj at 07:05 AM on 21 March 201719 House Republicans call on their party to do something about climate change
Yes, it's good to see at least some Republicans embracing the climate science issue. It's science and technology that made your country great, not nearly bankrupt property developers.
-
nigelj at 06:45 AM on 21 March 20172017 SkS Weekly Climate Change & Global Warming Digest #11
William @13, I have heard of the possibility of north atlantic currents slowing right down, but not so much pacific currents, and this is where many of the coral reefs are. Maybe the experts know more on this.
But regardless, ocean temperatures dont have to change much to pose a threat to coral. There may not be much we can do now.
I agree with your money in politics comments. It's like a log jamming up the river of progress on so many things, including climate change. But the alternative is tax payer funded election campaigns, and many people are resistant to this, and don't see how it's in their longer term interests.
-
william5331 at 05:57 AM on 21 March 20172017 SkS Weekly Climate Change & Global Warming Digest #11
When the ocean circulation shuts down there will be a strong accumulation of heat in equatorial waters as this heat is not taken pole-ward. It is highly unlikely that any reduction of emissions now will save the coral reefs. We can only hope they will recolonize from small remaining pockets when we get back down to, say, 250ppm. None of us alive today will see this. The one ring that controls them all is money in politics. Remove this barrier and results are not guaranteed but they are possible. Leave vested interest money in politics and we will continue sitting in the middle of the freeway with the Mac Diesel roaring down on us.
-
Baraliuh at 05:39 AM on 21 March 2017It's methane
To add to my previews comment, I wonder if you have had a look at recent research by Susan Solomon involving methan (1)?
It seems that we have underestimated the effects of short-lived GHG's.(1) https://www.theatlantic.com/science/archive/2017/01/short-lived-methane-sea-levels-for-800-years-solomon/512588/
-
nigelj at 05:20 AM on 21 March 20172017 SkS Weekly Climate Change & Global Warming Digest #11
Xulonn @10, good points. Trump and Bannon have stated they want to deconstruct the so called administrative state. They forget these organisations are there for good reasons.
Of course like so many things in politics there us a small grain of truth in their criticisms. Bureaucrtaic organisations can become slow and over staffed sometimes, or in a small number of cases serve no useful purpose. But the way to fix these things is with some refined and subtle policies that scrutinise what they do, put caps on staff numbers for a period, etc.
You don't eliminate them all, or slash their funding in an arbitrary fashion. Trump is using a sledgehammer to crack open a nut. It is driven by ideology and nothing more.
Modern economies are complex and so will be their administrative apparatus. This is true at the level of government,and equally true within large companies. Much of the great economic advances of modern society as well as ancient societies is a direct function of the administrative state. Greece, Rome, the colonising powers, the modern consumer society, modern wealthy economies everywhere.
The real challenge we have is running bureacracies well, not getting rid of them. It can be done, and there are ample examples around the world.
-
Kiwiiano at 03:44 AM on 21 March 20172017 SkS Weekly Climate Change & Global Warming Digest #11
I've starting seeing news items featuring 'floating island cities' as a way of dealing with rising sea levels. I wonder how they plan on coping with seas like the Dorset coast photo above?
-
sauerj at 02:21 AM on 21 March 2017How Green is My EV?
Wake, @24: Thank you for taking the time to read my post. You have some good points. I am very happy to dialog with you on two minor details related to your post.
ONE: I am confident that you understand that my calculated 0.92 is not ICE efficiency (as the other posts assumed). I say this because you are referring to my post where the 0.92 is the calculated ratio of EV/ICE CO2 emissions when comparing the numerator EV's lbCO2/kwh (powered from Indiana power, 77%coal + 19%gas) to the denominator ICE's lbCO2/kwh (with the ICE having a engine-to-wheel efficiency of 21%, which is on the high-end ICE efficiency, see my post above for all the sundry references and the full blown math details). And, just to reiterate my numbers from above and clarify here: This EV/ICE CO2 emission ratio drops to 0.74 at the low-end ICE efficiency of 17% (see same reference). And, that Dave's (this article's author) EV/ICE CO2 ratio was 0.68. ... My worksheet calcuations can be found & downloaded from my google drive public folder HERE; see file name: 'Energy Cost Impact w-CO2 Fee_Rev1.xlsx'
Back to your note, and my response to it: I understand that you were simply saying that EV's probably don't operate as efficient (as per my reference EV efficiency of 62%) if you averaged the EV's efficiency over the whole gambit of operating conditions (city & highway), especially at higher-load highway driving. And, because of that, you felt that this EV/ICE CO2 generation ratio would be higher (up closer to my 0.92 calculated value) at these higher-load conditions. On this point, I would ask you to consider the following:
1) Power-is-Power: My calculations simply boil down to one thing only, and that is putting equal amount of "power to the wheels". It really doesn't matter if the car contains an ICE or an EV motor; power is power. And, that is all my CO2 ratio calculations care about.
2) Is the Leaf efficient simply because it is wimpier than the Escape?: You could be asking this valid question. This is a question that we could easily put to the test. Dave might be willing to answer the following question: What is the max speed of the Leaf (on level ground, w/ no wind)? And, how does this compare to the same for the Escape? If the two are comparable (say in the 90-100mph range), then I would say that this answer settles that the Leaf's high efficiency is not simply because it is wimpier than the Escape.
3) EV efficiency versus speed: Then you might think: But at those higher loads, the EV efficiency probably drops way off compared to the efficiency of the ICE. But, based on a quick google search, I don't think this is the case: results HERE (EV chart) and HERE (ICE, see chart at the end of section 4.1). It appears that the EV efficiency profile (vs speed) is near its peak thru-out most of its operating range, and the ICE efficiency profile (vs speed) certainly isn't any better (I think it is worse at speeds outside of its "sweet spot").
Does this information help settle that EV may, in fact, be equally efficient at the high-end (highway and hills) driving conditions???
Side clarification point: The EV chart above says that top end EV motor efficiency is ~92%. This is true for the motor itself, but when you include the inefficiency of the batteries (for example, the heat emitted from them), then the overall efficiency of the EV is lower (~62%) as per the reference I gave in my original comment. Although, back to Dave's study, the true EV efficiency value may well be higher than the abover reference 62%.
TWO: On your point about the net CO2 from lithium battery production: I have no idea how CO2 intensive lithium capture and battery production is. But, bottom-line, I don't care. Essentially, I'm defusing this lithium discussion by stepping back and looking at the forest instead of the trees. And, I would hope to appeal to your clinical, fiscally conservative moral sensitivies on this point (which we both have common ground on). ... This being: If a carbon fee was applied to carbon-based fuels (at their source) equal to the amount of future CC damage costs (at least ~$100/imperial ton CO2), then the CO2 intensity of everything would be fully transparent and we'd let impersonal economics answer what is the least CO2 intense way to move a 2000lb box of steel down the road.
And, to my greater point, the sooner we install said carbon fee & dividend policy, the sooner we apply non-bias forces (of the cost-vs-profit balance sheet) that will impersonaly settle what is the best technology of everything we do (including transportation). And, that the more important fight on settling these sorts of micro-details, and getting our economy re-tooled toward the best sustainable technologies, is to put most of our personal energy into building political-will to pass RNCFD (revenue-neutral carbon feed & dividend), as propsed by Citizens' Climate Lobby. So, my point here is, I don't care what the detailed nuanced truth is behind the CO2 generated to make lithium batteries, but if RNCFD and a $100/tonCO2 tax was applied, then we'd quickly find out what the truth is in an impersonal, transparent and fiscally responsible manner. And, if lithium batteries do have lower CO2 intensity than all other technologies, then the economy would be "all-over-them", because they would be the most profitable way to go.
So, I choose not to haggle over details that make us go around & around, and go nowhere year after year. I simply step back and say, what we are doing is wrong. We are polluting carbon and that has, and will increasingly cause, significant environmental costs to the future. And, the best way to re-tool what we are doing is put those future costs into our energy profile prices. And using the efficient RNCFD model (the least economic burdensome proposed mitigation policy available) will achieve this worthy goal. Don't worry about settling arguments that fixate on this tree or that tree, step back and deal with the whole forest in one shot.
Does this type of straight-forward, bottom-line (profit-vs-cost) lanuage speak to you on settling the truth behind these sorts of micro-technological details??? I would be overjoyed if you started to see a glimmer of logic with this sort of approach (RNCFD) on how best to transition ourselves to a fiscally responsible economy. ... If so, please consider sitting in on meetings at your local CCL chapter and hearing what they have to say??? You will be amazed at how logical and civil/respectful this organization is! ... Regards!
-
Baraliuh at 01:29 AM on 21 March 2017It's methane
When I consider the spirit that John Cook started this page; it seems you halted on animal prodcution (both your pages which touch on animal agriculture is a bit hindsighted, and it seems strange to have them seperated instead of just having one article on animal agriculture). This is indeed a climate science page, but you fail to take into account the potential CO2 mitigation by converting animal agricultural land to e.g., forests, or other crops that bind carbon to the soil. You also don't take into account future projections of climate impact from this sector. Which is the real suprise to me.
The projection in increased CH4 due to animal prodcution shows a great increase (1).
From (1) "We suggest that, by 2050, the livestock sector alone may either occupy the majority of, or significantly overshoot, recently published estimates of humanity’s “safe operating space” in each of these domains."By 2050 we will also expand our agricultural land by more then 1 billion hektars (2). The situation is dire, and you guys, for once, don't promote looking a head in time. I'm baffled, maybe even shocked. This 1 billion hectar isn't going to come from deserts. Its going to be carbon binding areas.
If china picks up a american diet they alone increase the production of animal products by 30 % (3).
All in all, the projections of climate impact from the agricultural sector is increasing not decreasing or stabalizing. One of the major contributers is CH4. To me, your articles on animal agriculture are close to red herring with a touch of a nirvana fallacy. Red herring because you only evaluate the past, and don't look ahead. Nirvana fallacy because it is not a silver bullet, and that you don't take into account the relative change of emissions.
Correct me if I'm wrong but, it is still true that animal agriculture has bigger emissions than all of transport combined---so why is it in your myth section?(1) http://www.pnas.org/content/107/43/18371.full
(2) http://science.sciencemag.org/content/292/5515/281.full
(3) http://www.pnas.org/content/110/51/20617?ijkey=2df9956a32971f1382740597a2ba246ddc06173d&keytype2=tf_ipsecshaModerator Response:[DB] Your claims are best addressed on this thread. Please read that thread and the comments in their entirety. If you still have questions, place them there. Thanks!.
-
Xulonn at 00:23 AM on 21 March 20172017 SkS Weekly Climate Change & Global Warming Digest #11
A couple of types of events that could tragically reveal the incompetence of the Trump administration:
- A military incident where a lack of diplomacy and crisis management could have a devastating effect and lead to unnecessary military conflict and possibly outright war.
- A natural disaster such as a major hurricane, earthquake or flood that affects heavily populated areas and/or critical infrastructure. (The understanding, forecasting, and dealing with natural disasters is heavily dependent on science - which is why I am commenting on it.)
Management of either of these types of crises requires a steady hand at the helm, and a competent and prepared staff to manage the details. Effective natural disaster management requires a willingness to examine and understand relevant science. I don't see any of these attributes in the members of current U.S. Executive Branch.
Michael Brown, the "horse lawyer" (a former head of the Arabian Horse Association) who was appointed to the FEMA Administrator post under President George W. Bush, had no training or experience in crisis management. "Brownie," as Bush affectionately called him, displayed an incredible lack of leadership and effectiveness in the planning for Hurricane Katrina in 2005, and managing the aftermath - as did President Bush himself.
With President Trump, it is even worse. Like many important appointed federal administrative positions, the offices of FEMA Administrator and Deputy Administrator are still vacant according to the FEMA website. There is currently no one at the helm for natural disaster planning and response in the U.S., and Trump himself is obviously not capable of the leadership to handle any such event.
Effective leadership of FEMA requires logic, reason, intelligence, a forceful personality with good communication skills, and the ability to face unpleasant realities head-on. Trump appoints only those who publically praise him, support his agenda, and basically kiss his butt - and is having trouble finding potential administrators and bureaucrats who have even a modicum of qualification. I fear that when the FEMA leadership positions are filled, it will be by totally unqualified toadies, and not top-notch qualified disaster response specialists.
If there is a major natural disaster - particularly in the U.S. - during Trump's term in office, I fear that there will be much unnecessary suffering, and many needless deaths.
-
John Hartz at 13:39 PM on 20 March 20172017 SkS Weekly Climate Change & Global Warming Digest #11
Recommended supplemental reading:
4 Reasons Why the Trump Budget Cuts Won’t Happen by Ed Kilgore, The Daily Intelligencer, New York Magazine, Mar 17, 2017
-
chriskoz at 11:21 AM on 20 March 20172017 SkS Weekly Climate Change & Global Warming Digest #11
Tom Curtis@4,
Thank you for bringing this budget analysis to my attention. I'm not surprised by its content.
You say:
From appearance, the only federal funding to research, mitigate or adapt climate change if those portions of the proposed budget are passed are those that have escaped the Trump administrations attention.
But I find therein:
One EPA climate program that would likely survive is the Greenhouse Gas Reporting Program, which measures emissions from industries around the country. Congress has mandated this monitoring, and getting rid of it would require legislative changes. So the EPA could still quantify US greenhouse gas emissions — it just couldn’t very much about it.
(emphasis original)
So, it might actually be that those aspects anaffected by this budget simply cannot be affected by the presidential order. No doubt the president would love to scale them back but he cannot. The case of GHG monitoring does not invalidate your point about presidential incompetence though: when he does not mention anything important, it's highly likely because he does not understand it.
-
nigelj at 10:39 AM on 20 March 20172017 SkS Weekly Climate Change & Global Warming Digest #11
And we can see what Trump and his team is trying to do. It's transparently obvious. He threatens to do totally outrageous things, hoping people will settle on slightly less outrageous compromises, that are still totally destructive.
Don't be sucked in by this crafty ignoramus. I know you guys posting above won't, but many will be tempted.
-
nigelj at 10:25 AM on 20 March 20172017 SkS Weekly Climate Change & Global Warming Digest #11
"It is also fairly clear that conservatives are enemies of science."
Crystal clear unfortunately. Only 6% of American scientists now identify as republican, according to Pew research
www.huffingtonpost.com/2009/07/10/only-six-percent-of-scien_n_229382.html
www.salon.com/2013/01/11/scientists_hate_the_gop_for_a_reason/
"One of the great political shifts in the past decade has been the move of scientists toward the Democratic Party, a casualty of the Republican Party’s war on reality. It’s not about politics for scientists, it’s about the fact that only one party accepts scientific findings on everything from global warming to evolutionary theory to what does and doesn’t prevent pregnancy. Only 6 percent of scientists identify as Republican, whereas 55 percent identify as Democratic. In October of 2012, 68 Nobel-winning scientists co-signed a strong endorsement of Obama, saying the President “has delivered on his promise to renew our faith in science-based decision making.”
The latest economic data (refer to this weeks economist journal) show the econimic recovery is increasing in America and globally. Wages are rising. This shows free trade and globalisation delivering benefits and that Obamas stimulation and low interest rates, and quantitative easing are delivering benefits (not that these things are totally without problems).
The so called "administrative state" Trump wants to destroy is clearly also delivering benefits. Recovery is always slow after financial crashes, any economist will tell you this, so it's taken a while to come through.
Trump risks wrecking all this. I know this seems a little off topic, but it puts in context how wrong his thinking is on so many things, and therefore how suspicious you have to be on his environmental matters.
And what on earth are these tweets about accusing Obama of wire tapping, without even the slightest evidence? Not very dignified, more like sandpit behaviour.
-
Tom Curtis at 09:13 AM on 20 March 20172017 SkS Weekly Climate Change & Global Warming Digest #11
Further to my comment @4, here is a more detailed report of Trump's proposed cuts to science research in general. The picture is grim, only being 'relieved' for some branches of science with extra funding drawn from funding released by cutting climate research.
This is now a distinct pattern. One of the fundamental arguments of deniers is that the science is still uncertain, that we need more research before we do anything. Now, however, the Harper government in Canada cut climate related research, defunded the preservation of data, and placed a gag order on scientists; the Abbot/Turnbull government in Australia defunded the Climate Commission that was supposed to advice it on climate science, and cut CSIRO funding on climate research. And now we have Trump trying to completely gut all climate research in the US, all climate programs in the US and UN, and also placing a gag order on scientists.
The evidence could not be clearer that conservative know that the science is against them, that their claims that it is uncertain are deliberate distractions. Otherwise they would fund more science, not less. It is also fairly clear that conservatives are enemies of science.
It is no surprise. Alternative facts do not fair well under scientific investigation.
-
Tom Curtis at 08:58 AM on 20 March 20172017 SkS Weekly Climate Change & Global Warming Digest #11
chriskoz @3, Trump's proposed budget cuts in relation to climate change are far more extensive than just his cuts to the EPA. Predictably, he also proposes to cut all funding to UN climate change programs, including funding to help poor nations to transition to a low carbon economy. He also proposes to massively cut climate related research, including at NASA and the Department of Energy. In fact a Trump spokesman has been quoted as saying that there will be no further funding of climate research. Further, climate change adaption programs at NOAA will also be cut.
From appearance, the only federal funding to research, mitigate or adapt climate change if those portions of the proposed budget are passed are those that have escaped the Trump administrations attention. Given their general incompetence, that may still be significant, but I would not count on it.
Nor would I be as sanguine as JH. While I do not expect most of the budget to pass, neutering action on climate change is close to the heart of many Republican members of Congress, and to their most vocal supporters. I do not expect a lot of pushback in that area of the budget.
-
chriskoz at 08:12 AM on 20 March 20172017 SkS Weekly Climate Change & Global Warming Digest #11
nigelj,
From our point of view as CS communicators & AGW mitigation advocates I consider a blessing that some many chaotic developments (anti-immigrations, anti-helthcare, border wall, racism and fake evesdropping allegations) are preoccupying this administration. Because if not preoccupied my his own-inflicted moronic mess, the president would urely focus on fighting the "chinese hoax". So far 31% EPA cuts are the biggest fight he's undertaken. But rest assured, far more to come, including wfforts to destroy Paris agreement. I only hope the US politicians come to (or are force to) terms with reality and impeach the moronic sociopath before he starts really damaging the environment.
Moderator Response:[JH] The annual budget proposed by the President is typically "DOA" in the Congress.
-
nigelj at 06:23 AM on 20 March 20172017 SkS Weekly Climate Change & Global Warming Digest #11
Correction - some of you Americans have elected complete clowns. I realise theres huge division of opinion. And my country is facing many similar issues and debates over how to regulate environmental matters, hence my interest. But all our political parties see at least some place for a central agency.
Moderator Response:[JH] Perhaps the old adage, "Give a man enough rope and he will surely hang himself." will be played out.
-
nigelj at 06:15 AM on 20 March 20172017 SkS Weekly Climate Change & Global Warming Digest #11
"Trump's administration on Thursday proposed a 31 percent cut to the Environmental Protection Agency's budget"
Yes correct, but it goes much further. Matt Gaetz, a republican member of the house of representatives has launched a bill seeking to "completely eliminate" the EPA as below. He wants to leave it to the individual states.
Part of Geatz"s rhetoric is that environmental rules are allegedly costing jobs. He provides no evidence, and given unemployment has fallen from 11% to about 5% over the last 8 years it's hard to see where his evidence would come from. The EPA has implimented various emissions rules over this period, but unemployment has fallen. I would suggest he would actually find evidence environmenal rules create jobs, given they inevitably lead to development of new technologies.
It hardly needs to be said how senseless it would be to eliminate or cut the EPA. Before the EPA and things like the clean air act, there were all sorts of different rules in different states, and it was inconsistent and confusing, and became a race to the bottom.
Environmentals standards were mostly pretty poor quality back then. Levels of pollution were very high.
You would have another huge problem, with environmental issues decided by individual states. The environment doesn't really have any borders, so it will lead to endless fighting among the states.
These are some of the very reasons regulation by individual states didn't work in the past, and why the EPA emerged. Is Gaetz so stupid he can't work that out?
You Americans have elected complete clowns. We in the rest of the world are just stunned, I cant tell you.
Moderator Response:[JH] Rest assurred, many, if not most, Americans were also completely stunned by the election of Trump and are totally embarrassed by his antics and actions since he was sworn into office.
-
Cedders at 18:39 PM on 19 March 2017We're coming out of the Little Ice Age
The focus of this article is the LIA, so none of the three rebuttals address the Thames Frost Fairs mentioned by David Evans. As Robin at 57 mentions, these fairs were not every winter. BBC article: "between 1309 and 1814, the Thames froze at least 23 times and on five of these occasions -1683-4, 1716, 1739-40, 1789 and 1814 - the ice was thick enough to hold a fair".
As a Londoner, I can say it now seems implausible the Thames would freeze at London Bridge because it has been embanked by Bazalgette, flows fast in both directions, and is navigable and tidal as far as Teddington Lock. However, when it was shallower and slower, flow could become blocked at the Old London Bridge, which was demolished in 1831. There may be research into how important the LIA was as a factor in Thames freezing, but I recall reading how it was mostly down to commercial and architectual changes.
Separately, research published Jan 2017 clarifying the 'pre-industrial' global temperature baseline as mid-eighteenth century rather than 1850-1900 makes a difference of about 0.1 °C, which actually has policy implications related to Paris targets, shaving off a few years of inaction. That seems to give an indication of the order of magnitude of any difference the LIA made at a global scale.
-
barry1487 at 17:00 PM on 19 March 2017Ben Santer on Seth Meyer’s Late Show – How Climate Deniers Lie
Apologies for typos.
-
barry1487 at 16:59 PM on 19 March 2017Ben Santer on Seth Meyer’s Late Show – How Climate Deniers Lie
At the present time the Earth's ecentricity of it's orbit is near it's minimum. This means that the Earth remains closer to the Sun for the entire year.
IIRC, this has little infuence on the annual average insolation. Average distance to the Sun over a year is very similar at highest and lowest eccentricity, but there are significant (single-digit percentage) differences in distance and insolation at closest and furthest from the sun. At Eccentricity, thus, has an impact on the magnitude and lengths of the seasons. Also, at high eccentricity, velocity of the Earth is fastest the closer it is to the sun. I'm not an expert, though, and I'd wonder if the seasonal timing of eccentricity would make a difference - eg, whether the closest part of the orbit is in Wnter or Summer. But I don't think it's true that "the Earth remains closer to the sun for the entire year" at minimum eccentricity, or, if it does owing to velocity changes, that this would have much impact on annual/decadal/centennial scale temps.
Axial tilt is halfway between it's maximum (which helped end the last ice age) and minimum (which leads to cooling). Minimum will be rached around 11,800 AD.
Northern summers occut at aphelion currently, which should see milder extremes and cooler global temps.
People may be lining up to tell you how mistaken you are owing to you being mistaken.
Earth orbital variations have combined for a slight cooling phase since the Holocene Maximum after the ned of the last ice age, and would either hold pattern or continue to cool for another 23,000-50,000 years, when the next glacial maximu would occur.
Something else worth noting - these orbitally forced changes happen over tens of thousands of years. They have pretty much no impact at centennial scale.
-
Doug_C at 13:13 PM on 19 March 2017A Perfect (Twitter) Storm
nigelj @36
"Thin Ice" is an excellent book as was "Censoring Science" about the efforts of some in the Bush administration to silence climate scientists working for NASA, NOAA and other government agencies.
I live in the BC Okanagan and changes here have been significant in recent decades. Massive wildfires from droughts and heat waves, rapidly shrinking alpine glaciers that help ensure our rivers maintain flow year round and huge areas of this province are covered in dead and dying pine trees from beetles that are no longer controlled by harsh winters.
Thanks for your comments, it always helps to get a better picture with personal updates from the other side of the planet.
-
nigelj at 06:45 AM on 19 March 2017A Perfect (Twitter) Storm
Doug C @35
Yes without CO2 the planet would be very different. Too little and it would be much colder, too much and we head towards the extremely hot conditions on Venus.
I read a book ages ago called "Thin Ice" by Mike Bowen. This talked a lot about Lonnie Thompson, I think. You have probably read it, but just in case you haven't I mention it.
Our glaciers in NZ have lost approximately 40% of their ice mass over the last 100 years, and this is too long a period to blame on simple natural variation in my opinion. Photos of this sort of thing were the main thing convincing me we are altering the climate, I guess because it's visible and tangible.
We are probably talked out on these issues for now, but I wanted to mention that book.
-
Paul D at 21:17 PM on 18 March 2017How Green is My EV?
Regarding Wake comment.
Fuel cell vehicles use hydrogen, which is an energy carrier, not an energy source. In that respect fuel cells serve the same purpose as batteries, they enable energy storage and transport of energy.
There is also the issue of the production of hydrogen. One day if/when nuclear fusion becomes a practical reality and hydrogen can be produced efficiently with minimum of energy losses. Hydrogen will be more practical.In any case Na-ion batteries look as if they could be realistic replacements for Li-ion batteries.
http://cen.acs.org/articles/95/web/2017/02/solid-new-approach-sodium-batteries.html
-
Tom Curtis at 17:58 PM on 18 March 20172017 SkS Weekly Climate Change & Global Warming Digest #10
Further to my comment @4, the IEA has released its estimate of 2016 energy related emissions, which again show no growth over the prior year:

It also indicates that there are signs of the decoupling of economic growth and emissions growth:

Although that estimate does not include emissions from cement use, agriculture or land use change, which probably combine to result in a overall increase in anthropogenic emissions, still this would be a good sign were it not for the recent election of Donald Trump, which will almost certainly reverse the trend towards minimal emissions growth.
Prev 432 433 434 435 436 437 438 439 440 441 442 443 444 445 446 447 Next


