


 Arguments


Recent Comments
Prev 492 493 494 495 496 497 498 499 500 501 502 503 504 505 506 507 Next
Comments 24951 to 25000:
-
MA Rodger at 01:41 AM on 4 March 2016Explainer: how surface and satellite temperature records compare
HK @5.
Are you sure about those TMT trends? I get the +0.133ºC/decade for TMT v4.0 but I get +0.083ºC/decade for TMT v3.3. As I'm tapping this comment out, I have a thought that the +0.125ºC/decade could be TLT v3.3.
-
KR at 00:25 AM on 4 March 2016Explainer: how surface and satellite temperature records compare
Many of the updates to the satellite records, in particular updates with large changes to trends, have been over diurnal cycle corrections. Looks like the most recent paper (Mears and Wentz 2016) involves a big one, replacing GCM estimates of the diurnal cycle drift with internal consistency checks from the satellites themselves.
The new temperature record is now more consistent between satellites, as well as more consistent with total column water vapor over the tropics, so it seems well supported.
It will be interesting to watch the UAH group (Drs Christy and Spencer) react to this - UAH is now the extreme outlier with its low trend, the unverified V6 being much more so than V5.6.
-
HK at 22:39 PM on 3 March 2016Explainer: how surface and satellite temperature records compare
The revision of the RSS data I mentioned in my last post has now been updated to include February -16. That changes the TMT trend from 0.125 to 0.133 K/decade. This revision (v4.0) has also been applied to the TTT channel (temperature total troposphere), with the revised trend now being 0.172 K/decade. The TLT channel has not been revised yet, but when it is, it will probably show an even bigger trend than the TTT, as it is less influenced by the stratosphere than both TMT and TTT.
It seems that at least one satellite record is starting to agree pretty well with the surface records!
-
Daniel Bailey at 21:51 PM on 3 March 2016Antarctica is gaining ice
"Antarctic ice? If the land ice is melting but the sea ice is increasing"
In reality, Arctic sea ice is at a record low and global sea ice is diminishing.
"Sea ice increases in Antarctica do not make up for the accelerated Arctic sea ice loss of the last decades, a new NASA study finds. As a whole, the planet has been shedding sea ice at an average annual rate of 13,500 square miles (35,000 square kilometers) since 1979, the equivalent of losing an area of sea ice larger than the state of Maryland every year."
“Even though Antarctic sea ice reached a new record maximum this past September, global sea ice is still decreasing,” said Claire Parkinson, author of the study and climate scientist at NASA’s Goddard Space Flight Center in Greenbelt, Md. “That’s because the decreases in Arctic sea ice far exceed the increases in Antarctic sea ice.”
“When I give public lectures or talk with random people interested in the topic, often somebody will say something in the order of ‘well, the ice is decreasing in the Arctic but it’s increasing in the Antarctic, so don’t they cancel out?’” Parkinson said. “The answer is no, they don’t cancel out.”

NASA LINK
NATURE LINK
NSIDC LINKFurther, Antarctic sea ice is shrinking, now statistically indistinguishable from the long-term average:
-
wili at 12:48 PM on 3 March 2016Climate scientists worry about the costs of sea level rise
Not just about see level rise, but wrt costs of gw generally:
m.insurancebusinessonline.co.nz/news/lloyds-makes-call-on-climate-change-206300.aspx
"An increase in temperature of more than 2 degrees could lead to a lack of affordable insurance" -
bozzza at 12:15 PM on 3 March 2016Climate scientists worry about the costs of sea level rise
Sea ice and sea level rise are not in a direct relationship.
When do we say that they are and is this the signal that markets are waiting for?
-
Glenn Tamblyn at 11:07 AM on 3 March 2016Antarctica is gaining ice
B14
" don't we have two separate causes?" Yep. Maybe more than 2.
Sea Ice has increased a little in the last few years although mainly at the maximum in winter. This year, at the summer minimum it is rather low. Drivers of sea ice extent? Possible changes in sea water salinity, changing the freezing point of the water. Changes in the winds around Antarctica, driving more spreading of the ice and freezing over of the open water created. The wind patterns may have changed due to a combination of the current Pacific Decadal Oscillation which has now started changing, and the ozone hole allowing more sunlight to reach the surface rather than being absorbed in the stratosphere; the extra energy from this may have accelerated the winds.
In Antarctica land ice doesn't melt much - it is too cold. Rather it flows slowly to the coast and eventually breaks off as icebergs. Factors changing this? Ice sheet breakup. Floating ice sheets (not seasonal sea ice) act as buttresses, slowing the speed with which land ice can flow. Some have broken up. Grounding line retreat. This applies particularly in West Antarctica where the 'land ice' is actually sitting on the sea floor 100's and even 1-2000 meters below sea level. Sea water intrusion at the grounding line is causing some retreat of the grounding line, so that ice that was grounded ends up floating, and easier for icebergs to break off. The key here is what is happening to sea water temperatures at the base of these sheets, 100's of meters down. This in turn can depend on differences in what is happening to different currents at different depths.
Some recent research also suggests there is a critical threshold wrt the height of ice cliffs. It seems ice when it contains cracks isn't strong enough to allow ice cliffs to rise much more than 100 meters above sea level. Otherwise it breaks off. Then buoyancy of the remaining submerged ice can then break that off from the main ice cap.
Ice is way more complicated than just melting and freezing. -
Tom Curtis at 08:28 AM on 3 March 2016Water vapor is the most powerful greenhouse gas
shorter arationofreason @228, "I have had this random thought bubble. This random thought bubble disagrees with the conclusions of 1000s of scientists who have devoted tens of thousands of person hours to the problem. Therefore the 1000s of scientists must be wrong, and so wrong that only utter stupidity or corruption could explain the error."
The breath taking arrogance displayed demonstrates that 'arationofreason' is on a very short ration of reason indeed.
Among the facts that arationofreasonneglects in his thought bubble are that:
1) The CO2 contribution to the total greenhouse effect is about 20%, not 1%;
2) The 1.7 W/m^2 is the change in the CO2 contribution since the preindustrial, not the total contribution;
3) Because CO2 does not precipitate out with reduced temperature, while water does, the upper troposphere has very much less H2O than does the surface, but very close to the same amount of CO2, resulting in CO2 dominating IR absorption and reemission in the upper troposphere;
4) Because H2O precipitates out with reduced temperature, eliminating all CO2 (and hence 20% of the total greenhouse effect) would result in the precipitation of a great deal of the H2O in the atmosphere, reducing the IR impact of the remaining H2O. That in turn would precipitate out yet more H2O, and so on. The net effect is that in the absence of all long lived greenhouse gases, and assuming there had been no increase in the extent of ice sheets and/or deserts (ie, that albedo only changed due to reduced cloud cover, and increase in snowfields), only 10% of the current H2O would remain in the atmosphere, and temperatures would plumet by around 35 degrees celcius.

You don't need to be stupid or corrupt to not realize the above. All you need to do is to mistake abysmal ignorance for wisdom.
Moderator Response:[PS] You know better but thanks for tackling the substance.
-
wili at 07:21 AM on 3 March 2016Mapped: The sensitivity of the world’s ecosystems to climate
There is something a bit odd about the top map. It shows low to mid sensitivity of vegetation productivity in the area of Syria, even though they have had such a bad drought there, that many attribute at least part of the political chaos there to the displacement it caused of subsistence farmers and herders there. Am I missing something?
-
wili at 07:18 AM on 3 March 2016Climate scientists worry about the costs of sea level rise
Sooo, when do people and companies situated along the low lying coasts start to bolt--to get out before property values really plummet.
It seems to me that, whenever this happens, it will be a quite sudden and thorough crash of value, never to recover (although there could be a couple 'dead cat' bounces alont the way).
-
arationofreason at 07:16 AM on 3 March 2016Water vapor is the most powerful greenhouse gas
Water vapor has been capturing IR since the planet acquired water. If as AR5 calculates there is an additional capture of IR by CO2 of 1.7 watts/m2 this represents ~1% additional forcing increase. Through the mechanisms of IR capture, convection, latent heat release upon condensation, WV transfers heat to the upper troposphere where WV radiats heat to space.
Note that the earth is radiating IR to space to balance the solar energy absorbed from the sun to stabilize the earth temperature. WV does the major share of this job. We know this since there is no other significant physical material and physics available to do this heat transfer to space. As such WV responds to any forcing by increasing this heat transfer to space. Responding to heating by cooling is the definition of Negative feedback. Thus the 'science is settled'. Without significant Positive feedback of some sort, there is not enough CO2 greenhouse heating to be of consequence.
Either the '97%' of the science community is too stupid to understand this simple logic or else they are willing to sell their reputations for their share of the $2.6 billion research funding from the govetrnment. Since I refuse to participate in adhominin attacks, I must assume that answer lies with the former assertion.
Moderator Response:[PS]
The hubris involved in assuming physicists are wrong when in fact you have misunderstood the physics is frankly astonishing.
Please note that posting comments here at SkS is a privilege, not a right. This privilege can and will be rescinded if the posting individual continues to treat adherence to the Comments Policy as optional, rather than the mandatory condition of participating in this online forum.
Moderating this site is a tiresome chore, particularly when commentators repeatedly submit offensive, off-topic posts or intentionally misleading comments and graphics or simply make things up. We really appreciate people's cooperation in abiding by the Comments Policy, which is largely responsible for the quality of this site.
Finally, please understand that moderation policies are not open for discussion. If you find yourself incapable of abiding by these common set of rules that everyone else observes, then a change of venues is in the offing.Please take the time to review the policy and ensure future comments are in full compliance with it. Thanks for your understanding and compliance in this matter, as no further warnings shall be given.
-
B14 at 07:03 AM on 3 March 2016Antarctica is gaining ice
Maybe someone could help me understand. Antarctic ice? If the land ice is melting but the sea ice is increasing, don't we have two separate causes? It don't understand how you can have both with the same environment.
Anecdote: When the glacier covered Maine the plate was 200 feet below sea level. The glacier melted away ( from global warming?? ) and the land plate floated up and is now 4 feet above sea level. Or did the sea level fall because the land mass moved up. I am sure someone out there could explain this to me. please!
It seems to me when a tectonic plate looses massive amounts of weight ( ice ) in this case, it makes sense that it might move up because it is floating on magma ( or something like that ).
I also wonder about wind mills too. If our "climate" is dependent on air streams; based on earth rotation and adiabatic rise, then if we take the heat ( energy ) out of the wind we have not, will that not affect the wind currents driving our local climates?
-
HK at 06:17 AM on 3 March 2016Explainer: how surface and satellite temperature records compare
Have you seen the latest from Tamino?
Carl Mears & Co have published a new paper describing a revision of the RSS data with focus on the diurnal correction. This revision increases the trend for the middle troposphere (TMT) from 0.078 to 0.125 K/decade over the period 1979-2014.
If the increase of the lower troposphere trend (TLT) is comparable to this (60 %), it should equate to about 0.2 K/decade – pretty close to or even slightly more than the surface data!So, are we seeing the end of the satellite pause in more ways than one?
-
MA Rodger at 04:55 AM on 3 March 2016Explainer: how surface and satellite temperature records compare
There were actually signs of something happening in the high-latitude NH satellite data for January. Both UAH v5.6 and RSS TLT post anomalies for the Arctic, with UAH further split into Land & Ocean. Both these data sets show a big record-breaking January for the Arctic.
-
Tom Curtis at 01:01 AM on 3 March 2016GWPF throws out centuries of physics, climate scientists laugh, conservative media fawns
BBHY @8, you are too generous.
Mills not only looks in the rear view mirror - he cherry picks break points to ensure a low trend for the final term for the segmented trends; and simply omits the trend term from his analysis to ensure a zero trend for the full autoregressive model. That is, for figure 5 above, his analysis finds a trend of 0.6 C per century, which he then simply omits in order to make a projection. For figure 6, his analysis finds a reduced trend in the final segment due to a cherry pick of 0.8 C per century (it would have been closer to 2 C per century with objectively determined breakpoints), which he then simply omits to get a zero C per century trend for his prediction. (Details from Nick Stokes at Moyhu)
On top of that, he has performed a statistical analysis showing that total radiative forcing is a robust predictor of temperature, with a Transient Climate Response of 2.1 +/-1 C per doubling of CO2 (significantly greater than IPCC estimates). Therefore he knows that the temperature history of the 20th century is a result of radiative forcings, not of a random walk.
-
BBHY at 21:37 PM on 2 March 2016GWPF throws out centuries of physics, climate scientists laugh, conservative media fawns
Isn't this sort of like driving your car by looking only at your rear view mirror? I mean they used temperature data from the past, so they have a view of where the climate has been, but I don't see how that predicts what's in the future.
Seems a bit like a turkey scientist, on the eve before Thanksgiving, performing a statistical anaysis of the previous 364 days and concluding with confidence that tomorrow will be just like every other day.
-
Tom Curtis at 08:30 AM on 2 March 2016Explainer: how surface and satellite temperature records compare
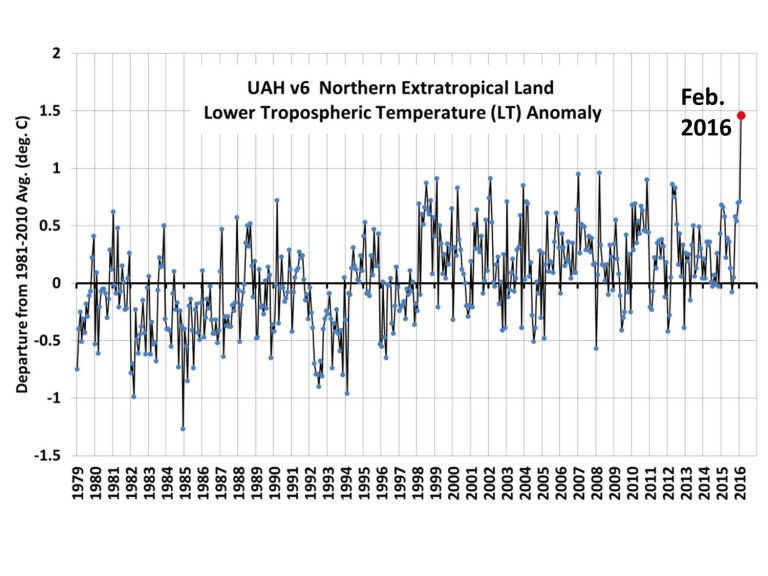
To save clicking on Tom Dayton's link (unless you want the detailed discussion):
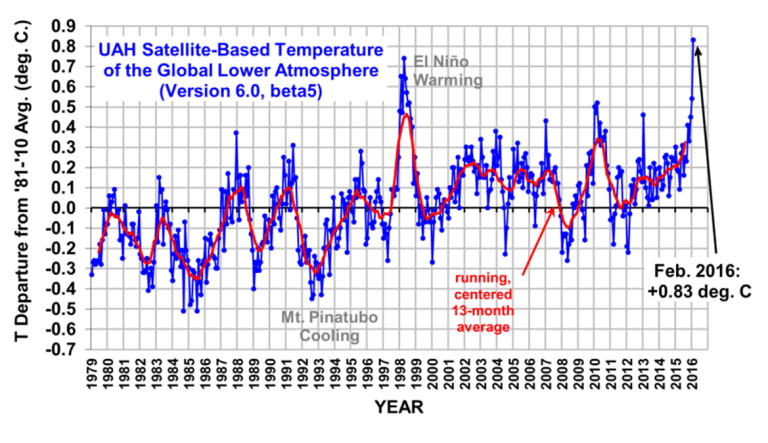
In that detailed discussion, Roy Spencer draws attention to the fact that the new monthly record is not entirely due to El Nino, given that it was not a record for the tropical anomaly. Rather, the El Nino warmth was boosted by some other (unnamed by Spencer) factor, which boosted the NH extratropical land temperatures to unprecedented values:
-
Tom Dayton at 05:21 AM on 2 March 2016Explainer: how surface and satellite temperature records compare
UAH 6 for Feb. 2016 is available. Whoops.
-
keithpickering at 02:42 AM on 2 March 2016GWPF throws out centuries of physics, climate scientists laugh, conservative media fawns
I think it may be a problem for the GWPF when their scientist-for-hire produces the required drivel at such a level of detail that it is instantly falsifiable.
My climate prediction: Expect GWPF to hire someone less verbose, and more opaque, in the future.
-
MA Rodger at 19:13 PM on 1 March 2016GWPF throws out centuries of physics, climate scientists laugh, conservative media fawns
Tom Curtis @5.
The ridicule I present @3 is indeed unscientific but when a paper is as you say "not worth the paper it's written on," that paper hangs on to the very edge of science by its fingertips. Add to that the comments by McKitrick in the GWPF's forward (saying how important this paper is for policy makers) and Mills' no-temperature-increase-this century prediction reported in the press: given such a situation, for an academic to remain silent and not set out where he stands - that is unforgivable in science. The paper could just as as well be written in crayon in the kindergarden.
And do note that this particular set of GWPF are the Global Warming Policy Foundation. This part of the GWPF is a registered charity (an educational charity no less, so that'll learn you!!) and being a charity that £3,000 paid to Mills was part funded by the UK taxpayer. Yet again the Gentlemen Who Prefer Fantasy bring legitimate UK charities into disrepute.
Resorting to ridicule may not be entirely appropriate within an SkS comment thread where scientific analysis should not be drowned out by laddish invective but on the interweb generally I do consider ridicule an effective response to these GWPF jokers.
-
sidd at 14:42 PM on 1 March 2016Antarctica is gaining ice
That should read "Table 5" not "Table 10"
-
Tom Curtis at 14:14 PM on 1 March 2016GWPF throws out centuries of physics, climate scientists laugh, conservative media fawns
MA Rodger @3, your are correct about crudeness and inappropriateness of using cherry picked break points in this sort of study, although the references to 'kindergarden' are uncalled for. Also uncalled for are suggestions elsewhere that Mills is only publishing a report of this nature because of the fee he recieved from the GWPF. He has taken a similar line in the (dubious) Journal of Cosmology, although at least avoiding the fraudulent practise of cherry picking in that paper.
What is interesting is that in 2009 in Climactic Change, Mills performed an analysis showing that:
"Using an updated data set of global temperature and radiative forcings, it has been shown that temperature and total radiative forcing cointegrate and that this relationship is stable across the period from 1850 to 2000. A robust estimate of the temperature sensitivity to a doubling of radiative forcing is calculated to be in the range of 1–3◦C, with a point estimate of just over 2◦C. Since we cannot reject the hypothesis that the different radiative forcings have an identical impact on temperature, this result can also be interpreted as providing the temperature sensitivity to a doubling of atmospheric CO2 concentration."
(Note that the "temperature sensitivity" discussed is the Transient Climate Response.)
Thus, Mills has shown that total radiative forcing is a robust predictor of meant global temperature.
Mills also analysed NH trends in 2006 using a variety of methods, concluding that:
"In summary, then, although the techniques investigated here display certain idiosyncrasies, they share the common feature of a ‘long wave’ in trend NH temperatures with a pronounced warming trend since 1970. The range of trend functions provided by these techniques should, however, temper the enthusiasm of anyone tempted to use them for extrapolating trend temperatures far into the future."
That last caution is wise given the limitations of purely statistical techniques. Had Mills taken it at face value, he would never have published his latest excrescence for the GWPF. Needless to say, if purely statistical trend prediction are dubious for predicting the future, purely statistical trend prediction based on cherry picked break points is not worth the paper it is printed on.
Further, in a peer reviewed trend analysis in 2009, he wrote:
"As can also be seen from Figure 2, the trend slopes are all approximately constant, at around 0.03oC per annum. This implies that, at this current rate of trend increase, Northern Hemisphere temperatures will be some 3oC higher by this time next century. Being parametric, the stochastic trend model provides a standard error for both the current trend level and slope: these are 0.05 and 0.01 respectively. Forecasted trends will also have standard errors. Although the forecasted trend in 2105 will be around 3.6oC (above the 1961-1990 mean), it will have a standard error of 2.3oC attached to it, indicating the imprecision with which such long run forecasts are necessarily accompanied by: a 70% prediction interval runs approximately from 1.3 to 5.9oC. This long-range trend forecast is very much in line with the projections made by the Met Office’s Hadley Centre coupled atmospheric-ocean general circulation models, HadCM2 and HadCM3, using a ’business as usual’ scenario that assumes mid-range economic growth but no measures to reduce greenhouse-gas emissions."
That paper also analysed the Central England Temperature series (CET), in which he found two short term trends of similar magnitude to the late twentieth century trend, but that is to be expected when that series represents temperatures over a small region. Hemispheric and global series, in contrast, will show the average over many regional trends and consequently be far less variable. Consequently, we need not expect temperatures of 14.08 C by 2005 (as predicted from the CET trend), and contrary to Mills assertion, that temperature is not inline with model predictions.
Taking the three papers together, Mills own work has shown that radiative forcings are a robust predictor of temperature, while statistical patterns in temperature patterns alone are not a robust predictor of gobal temperature. Further, purely statistical predictions are downgraded by cherry picking trend periods. Therefore, to treat projected trends based on cherry picked data as refuting climate models, whose results are consistent with the robust predictions of temperature from radiative forcing directly contradicts Mills' own work. In short, not only does he know that is work in the GWPF report is of poor quality - not only does he know that it is not robust - but Mills knows the conclusions drawn for him by McKittrick in the introduction are directly contradicted by Mills actually peer reviewed work.
It is no wonder that he refuses to confirm that he considers his result to be credible.
-
sidd at 12:23 PM on 1 March 2016Antarctica is gaining ice
That Zwally paper is interesting. Set aside the matter of the total mass change for a moment, and look at the changes between 1992-2001 and 2003-2008, the delta column in Table 10 or by eyeball from Fig 9. Mass waste in PIG, Thwaites and neighbours had doubled in the periods covered in the paper, the you can see the hole burning toward Ross, Ronne and the Transantarctic mountains. Recall that we are now in 2016. So apart from an overall constant, the trends agree. Fig 9 indicates that Totten is another place to watch, and I am glad the Amery doesn't seem to be waking up, at least in this data. -
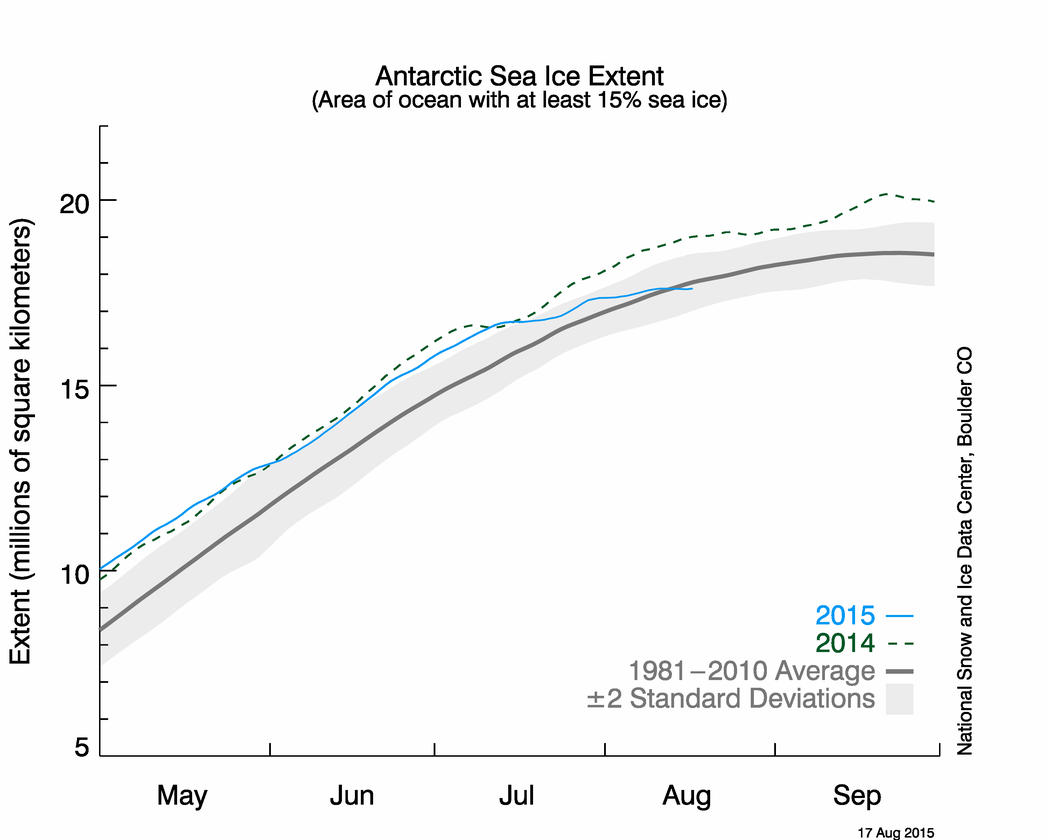
Glenn Tamblyn at 08:40 AM on 1 March 2016Antarctica is gaining ice
Iceman
Here is the latest sea ice extent for Antarctica.
Fairly low for this time of year.
Yes there has been some increase in the maximum in recent years. But we will have to wait and see as to whether that is an ongoing increase or not.
And Rob is right, The Zwally paper is new and is an outlier result compared to other studies. Too early to assess whether it will stand or not. -
KR at 07:51 AM on 1 March 2016GWPF throws out centuries of physics, climate scientists laugh, conservative media fawns
Mills' paper starts with the assumption that climate temperature changes are a non-stationary process, which is to say a random walk.
Unfortunately for his hypotheses, a physical system cannot exhibit a random walk without violating the Conservation of Energy - it must be trend-stationary to forcings, potentially varying around that trend but with an ever-increasing returning tendency when it does. A random walk, on the other hand, can accumulate variations either + or - from the forcing levels, leading to a situation where the climate would either gain or lose energy forever; that is just physically absurd.
Note that trend-stationary behavior is clearly demonstrated from a proper application of test for random-walk behavior (which the climate doesn't exhibit), see here and here for some very clear analysis by Tamino.
Given that bit of nonsense as a starting point, nothing else in Mills paper physically follows, including his 'eyecrometer' picks of breakpoints. If someone ever tells you that climate exhibits 'non-stationary' behavior or is a random walk, you can assume that they don't know physics, and you can ignore the rest of their spiel.
-
scaddenp at 05:54 AM on 1 March 2016Earth is warming 50x faster than when it comes out of an ice age
We are likely to be in a La Nina by year end and even if not, another La Nina will come and with it, a redistribution of water onto land. Just as surely will be deniers cries that "sealevel is falling". It makes no sense to be concerned about short term trends. With his "just saying", I am pretty sure Gingerbaker is aware of that too.
-
MA Rodger at 04:32 AM on 1 March 2016GWPF throws out centuries of physics, climate scientists laugh, conservative media fawns
The technical basis of this GWPF Technical Paper No1 actually rests on a method that is well known here at SkS. The result rests wholly on the method employed to identify the break-points in the HadCRUT4 & RSS TLT data series. This method is not without its critics so GWPF Technical Paper No1 presents the reasons for employing this method in Note 9. And these reasons are that the 'author' (posh word for kid with crayon) Terence C. Mills of Loughborough University (likely attached to the university's kindergarden) feels he can argue that (firstly) alternative methods are less well developed that his chosen approach and (secondly) break-points can be identified over the full length of the data series when using his chosen method.
This chosen method thus allows him a level of flexibility unavailable with any of the alternatives.
The method utilises a very powerful piece of equipment call a Mk1 Eyeball. Yes, you have it right. The kid with the crayon is cherry-picking his breakpoints visually. Note 9 does make plain that other break-points can still be considered but the kid with the crayon is happy to ignore any of that and go with his prediction for temperatures out to 2020. And I note there is some press coverage showing that the kid with the crayon has got his hands on a longer ruler than the one used in GWPF Technical Paper No1. He is reported predicting global tempertatures out to 2100(And they are talking years not hours!!) based solely on the data 2002-2014. The kid may well know that short sets of noisy data (less than 18 years or so) give statistically unsound results but he probably hasn't learnt to count up to eighteen yet.
9. The break-points were determined ‘exogenously’, in other words by visual examination of a plot of the series. This was done for two related reasons. First, methods for determining breaks endogenously remain in a relatively early stage of development (see Bai, 1997; Bai and Perron, 1998, 2003,McKitrick and Vogelsang 2014) and their properties in dynamic regression models have not been completely established. Second, these methods require observations to be ‘trimmed’ from the beginning and end of the sample to ensure that the tests have reasonable properties: any trimming at the end of the sample will make it almost impossible to find a break that occurs near the end of the sample, as may well have happened in this series, this being the well documented ‘pause’ or ‘hiatus’ in temperatures. Consequently, other researchers may wish to explore alternative break points: certainly bringing the last break point forwards from December 2001 will begin to produce a significant positive trend for the fifth regime.
-
Rob Painting at 04:28 AM on 1 March 2016Antarctica is gaining ice
There are a whole bunch of studies that show the Antarctic (land-based) ice sheet is losing mass versus Zwally's study that claims otherwise. Zwally's work is currently incompatible with Holocene sea level history and recent assessments of the sea level budget.
So there's a considerable volume of scientific work arguing against it. We'll just have to wait and see if Zwally's work stands up to scrutiny. If it does, we will change the text accordingly. Changing it now would be premature.
As for Antarctic sea ice, that's very interesting and very likely related to the wind trends and their effect on the polar gyres. SkS will have a new post on that in a few weeks.
-
scttharding5 at 04:26 AM on 1 March 2016GWPF throws out centuries of physics, climate scientists laugh, conservative media fawns
It's like saying that the burner on my stove isn't going to heat up based on past patterns, and ignoring the fact that I just lit the gas.
-
Iceman at 04:00 AM on 1 March 2016Antarctica is gaining ice
"Update Nov. 7 2015
A study published by Jay Zwally and his team on Oct. 30 (Zwally et al. 2015) has suggested that until 2008 there might have been a bigger increase in ice on East Antarctica than there is a decrease in the west, meaning that total Antarctic land ice is increasing."
There is nothing in that study to suggest that he ice gain that has been occurring for 10,000 years has stopped.
The Science has shown that Antarctica is gaining ice. Clinging to this false claim that the "science says" Antarctica is losing land ice shows poor alligiance to science. -
Iceman at 03:54 AM on 1 March 2016Antarctica is gaining ice
"Satellites measure Antarctica is gaining sea ice but losing land ice at an accelerating rate which has implications for sea level rise."
This "argument" is clearly wrong. Antartica is gaining land ice mass and sea Ice. This should be corrected if this site claims to offer science as answers.
http://www.nasa.gov/feature/goddard/nasa-study-mass-gains-of-antarctic-ice-sheet-greater-than-losses -
Jim Hunt at 02:33 AM on 1 March 2016GWPF throws out centuries of physics, climate scientists laugh, conservative media fawns
Note also that the Global Warming Policy Forum is attempting to pull the same stunt with a porky pie production line of Arctic sea ice misinformation. For all the gory details of this long running saga please see:
The Great Global Warming Policy Forum Con
Dear Benny,
I note that the GWPF webmaster has still not taken on board any of the helpful [Arctic sea ice] advice I have proffered over the last few weeks, and has now posted some inaccurate information about “global warming”. Will he or she never learn?
Apparently not!
-
wili at 01:53 AM on 1 March 2016Earth is warming 50x faster than when it comes out of an ice age
Thanks, ms and noa. Looking at earlier years, one might assume that this most recent divergence from the linear trend is just that--a temporary blip. But of course, it could be the beginning of a new, steeper linear, or the beginning of an exponential trend. If the latter, the question is what the doubling time will be.
As with many things, we won't know for sure till it's in the rearview mirror. -
noa at 22:50 PM on 29 February 2016Earth is warming 50x faster than when it comes out of an ice age
He might be refering to this graph from AVISO Data. If you look only at the data from Jason-2 you get a SLR rate of 4.31 mm/yr. Of course this is a very short time span, so I do not thin it has any significance as of yet.

-
scaddenp at 11:54 AM on 29 February 2016Volcanoes emit more CO2 than humans
Clapper, large volcanoes in this era mostly cool the earth temporarily thanks to aerosols which persist for a few years. In the distant past, gigantic volcanic eruptions sustained for a long time (Large Igneous Provences) are associated with mass extinctions. See here (and the other part) for more detail. Short answer is that you need volcanic activity like hasnt been experienced for 100s of million years to get something comparable to human FF emission rates.
-
michael sweet at 11:27 AM on 29 February 2016Earth is warming 50x faster than when it comes out of an ice age
Wili,
Here is a link to the Colorado data.
I am not sure what the last entered date is. Perhaps Gingerb has a better graph. 2015 goes way up, but 1997 did also. 2014 does not look bad to me. It looks like the data was close to the long term line until the start of 2015. We can hope that the data will return to the long term mean like it did in 1998.
Moderator Response:[PS] Please try again. You cant insert a PDF as an image.
-
Clapper55 at 11:14 AM on 29 February 2016Volcanoes emit more CO2 than humans
I would like to see more about what would have to occur in order for volcanic activity to make humans decreasing carbon emissions not effective. I also want know how much if any volcanic activity has on global warming and compared to humans effects.
-
wili at 10:03 AM on 29 February 2016Earth is warming 50x faster than when it comes out of an ice age
Gingerb, could you share your source on those figures?
-
Tom Curtis at 07:36 AM on 29 February 2016Breathing contributes to CO2 buildup
hydman1 @58, in all photosynthesis in plants, molecules of CO2 combine with molecules of water to produce sugar and oxygen. This is the general formula:

There are different pathways to achieve this reaction, but the initial and final reaction products are the same for all pathways. Therefore there is no difference in the efficiency of plants in converting CO2 (plus H2O) to O2 (plus C6H12O6).
What there is is a difference in is the biomass of different ecosystemts and/or crops per hectare; and hence a difference in the amount of carbon stored per hectare. That difference, however, is accounted for under the rubric of Land Use Change (LUC).
Building CO2 converters, ie, machinery that takes CO2 and seperates the oxygen from the carbon cannot (due to conservation of energy) use less energy than is produced by burning coal, and due to inefficiencies, will likely use substantially more. Any such solution, therefore, cannot work without the majority of the economy being sustained by non-fossil fuel energy. At that point, it would be simpler, and much cheaper to simply substitute the non-fossil fuel energy for the current fossil fuel energy use.
-
hydman1 at 06:25 AM on 29 February 2016Breathing contributes to CO2 buildup
The notion that there is an eco balance to cancel respirated co2 and only co2 emissions from other sources should be considered is rediculous. There is no proof that the crops that replaced other disiduous plants that were growning on the ground before the crops were planted were or are any more efficient at converting co2 to o2. The real fact is that the yield of crops have largley been increased by improved germination, resistance to disease, irragation, and the control of pests as much as the number of acres dedicated to agriculture over the last 50 years. Those changes do little or nothing to affect the co2 consumption by crops. In the US farmland was allowed to remain unplanted in order to reduce food surplus and increase crop futures. The reason that we contiune to hear the bable from environmentalist groups about carbon emmissions is that they are more about self preservation. The notion that population control is the real answer to all these issues is unthinkable to them because for many of the leaders of this cause, that is where there power base comes from. The earth has a finite capacity for filtering out co2 strictly based on vegetation. Maybe we should be building co2 converters instead or shutting down coal if favor of nuclear power or trying to convert to wind which can only work if it was a globally connected power grid. That is decades or centuries away.
Moderator Response:Thank you for taking the time to share with us. Skeptical Science is a user forum wherein the science of climate change can be discussed from the standpoint of the science itself. Ideology and politics get checked at the keyboard.
Please take the time to review the Comments Policy and ensure future comments are in full compliance with it. Thanks for your understanding and compliance in this matter.
In particular, please note the "No inflammatory statement and accusations of fraud".
-
There's no correlation between CO2 and temperature
SOMMERSWERD - ...And your question is in fact a query about CO2 absorption saturation, which is more appropriately dealt with on the appropriate thread.
Moderator Response:[PS] Fixed link
-
There's no correlation between CO2 and temperature
SOMMERSWERD - Actually, I did answer your question. Atmospheric absorption is concentration and hence pressure/altitude dependent, with sea level pressure and concentrations of CO2 absorbing all CO2 frequencies in a matter of meters.
What matters for the greenhouse effect is at what temperature (and hence rate) IR is emitted to space - that occurs at altitude, when there is insufficient CO2 above the effective emission altitude to absorb the majority of the outgoing IR.
Increasing CO2 simply raises the effective emission altitude - and there is in fact solid data showing that over the last 50 years the tropopause where the effective emission occurs has risen a few hundred meters. Given the lapse rate relationship, that altitude change accounts for the observed rise in temps over that period.
So in detail the answer is "it depends on what you're asking". All CO2 frequencies get fully absorbed at the surface (with corresponding thermal emission), the strongest absorption lines continue to absorb a majority of the IR at those frequencies until pressure drops enough to allow >50% through to space, and changes in CO2 concentration simply change that altitude - where again >50% of the emitted IR at those wavelengths escapes the atmosphere. Your question "...how much energy remains to be affected?" is therefore somewhat meaningless without more context.
-
SOMMERSWERD at 05:42 AM on 29 February 2016There's no correlation between CO2 and temperature
KR
My question was simple but you have not responded. No discussion; just a question that you do not respond directly.
Moderator Response:[PS] KR pointed you to a more appropriate thread for discussion of question. It is off-topic here. Please take the discussion there. Offtopic discussion will be deleted from this thread.
-
Glenn Tamblyn at 04:43 AM on 29 February 2016Earth is warming 50x faster than when it comes out of an ice age
sidd
Sounds like this is new findings from including the fracture mechanics of ice cliffs.Assentially it seems to be saying that an ice edge more than 1000 meters high, so 100 above the water, 900 below, in water 900 meters deep or more is unstable. So a sheet 200, 500, 800 meters thick at it's edge is stable, whether it is floating or not.
The ice in the WAIS is largely over 1000 meters thick then tapers to less than that at places like the Thwaites. So the edge of the Thwaites doesn't suffer from this instability. But if it retreats back into deeper water, where the ice is thicker, it can become unstable. -
There's no correlation between CO2 and temperature
SOMMERSWERD - See CO2 is saturated for a discussion of this. The real effects of greenhouse gases take place in the upper atmosphere when the concentrations drop to the level that IR can escape to space, and increased levels of CO2 just raise that altitude. There is no 'saturation' issue.
Moderator Response:[PS] Fixed link
-
SOMMERSWERD at 01:25 AM on 29 February 2016There's no correlation between CO2 and temperature
Hi from Spain. I have a question:
"How much of the thermal radiation energy from the Earth in the band centered on the 14.77micron wavelength that is resonant with the vibrational mode of CO2 has already been affected by the current atmospheric CO2 concentration, and how much energy remains to be affected?”
A greeting and thanks in advance
-
tcflood at 15:48 PM on 28 February 2016How Exxon Overstates the Uncertainty in Climate Science
It seems to me that the main problem is that the graph (at least at the scale in the online postings) is illegible for *anyone* and so it invites misrepresentation. It would best be presented as a set of five graphs: four that show all the model results for a each of the four RCPs so as to give a good impression of the scatter of the models; then one graph that shows four *averages* of all the results for each of the RCPs. Such a presentation would be much harder to misinterpret and misrepresent.
-
sidd at 14:07 PM on 28 February 2016Earth is warming 50x faster than when it comes out of an ice age
Interesting. Alley says "decades" for Thwaites ... possibly. First time i heard him say decades. -
Gingerbaker at 07:41 AM on 28 February 2016Earth is warming 50x faster than when it comes out of an ice age
"... a doubling time from a 1mm per year ice sheet contribution to sea level in the decade 2005-2015 would lead to a cumulative 5 meter rise by 2095.""
SLR doubled in 2015 from 4.1mm/year in 2014 to 10mm in 2015. Just sayin'.
-
swampfoxh at 06:58 AM on 28 February 2016How Exxon Overstates the Uncertainty in Climate Science
Up is still up. All of the RCP are "up". I think some of the problem has to do with a person's perception of the impact of a "couple degrees of temperature. With respect to the climate in the dining room on the night your boss is coming over for dinner, a couple of degrees means nothing. Climate scientists know that a, "couple of degrees of global averaged higher temperatures is a "big deal"". So, let us not fret much about the Exxon folks or anyone else that doesn't get it. Keep plugging away at the scientific efforts and the peer-reviewed results and more people will "sign on" to solutions, even if we "extinct-ify most of the human race before we "get there". After all, the globe could use a drastic population reduction...think how much CO2 we wouldn't be pumping into the atmosphere? (There, I've said it) Sorry.
Prev 492 493 494 495 496 497 498 499 500 501 502 503 504 505 506 507 Next


