Arguments


Recent Comments
Prev 63 64 65 66 67 68 69 70 71 72 73 74 75 76 77 78 Next
Comments 3501 to 3550:
-
Fixitsan at 17:59 PM on 25 July 2022Taking the Temperature: a dispatch from the UK
Regarding the CET it seems to show no net gain in temeprature between about 1760 and 1910. An amazing sight to see, shoudl I be ever tempted to read news headlines which assert that temperatures have been rising continuously throughtout the industrial revolution. Not in Central England, they haven't.
Of course it depends if you use the 10 year or 30 year average but short term trending allows more noise through but regardless of that, warming only seemed to being in 1910 on the CET terecord, reached temperatures as high as those seen in 1730 by about 1940 (it remained colder than 1730 until 1940) and since 1940 we have seen a discontinuous warming, which incudes a cooling starting in the 1960's which doesn't finish cooling until the 1990's
With a lack of variability in atmospheric CO2 levels over that 100 or so year period (the change in CO2 has been steady and predictable, rarely variable) being coincident with the CET record during that time, it's visible to see that the theory of more CO2 = more warming is not being measured by instrumentation in the last 100 or so years. That is not to say that CO2 does not cause warming, but the CET record doesn't show what I believe many epople might understand is happening in their own minds when picturing the promoted relationship between CO2 and temperature on it's own
-
Fixitsan at 17:42 PM on 25 July 2022Taking the Temperature: a dispatch from the UK
@ Bob ""I'm not sure exactly what sea level rise has to do with temperature records""
No, perhaps reading any press article which consistently ties the two together ought to be all you need to do to raise your awareness.
Say 'climate change' on any high street, hear ' sea level rise' addended
Perhaps though you weren't aware of any previous connection between temperature and sea level ? Have you heard of a thing called climate change thepory ? Perhaps ? Maybe ? Oh well, hideaway.
-
Fixitsan at 17:37 PM on 25 July 2022Taking the Temperature: a dispatch from the UK
One Planet, with reference to your own referenced series extracted from CET
Why was there a cooling starting at around 1972, with temperatures not recovering tot heir pre 1970's level until the 1990's if CO2, the alleged cause of all warming, was rising throughout the same period ?
The theory is more CO2 = always undoubtedly more warming.
-
Bob Loblaw at 03:26 AM on 25 July 2022Taking the Temperature: a dispatch from the UK
A nice statistical analysis of this UK heat wave, including references to CET, over at Tamino's:
-
One Planet Only Forever at 02:49 AM on 25 July 2022Taking the Temperature: a dispatch from the UK
One more (last) poke at how hard it is to misunderstand what the HadCET dataset shows:
- The following webpage "Met Office Hadley Centre observations datasets: HadCET", is the page linking to downloads of the dataset. The dominant feature on that page is a graphic presentation of each year's 'Mean Temperature difference from 1961-1990 average'. What it shows is hard to misunderstand.
- The Wikipedia page for Central England Temperature has a section called "Trends revealed by the series" includes a graph of the 10-year and 30-year moving averages. That shows that prior to 1950 there was only a brief period (around 1735) when the 30-year average was close to being as warm as the coolest values since 1950. And since 1990 the 30-year average has consistently 'statistically significantly' increased. It also shows that the current 10-year averages are warmer than any 10-year averages before 1990. And it also shows that the annual data points cover a broader range than the 10-year average, which has a broader range of values than the 30-year average. That should lead to understanding that the monthly values would have a larger range than annual values, with daily values having an even larger range of values.
-
One Planet Only Forever at 05:12 AM on 24 July 2022Taking the Temperature: a dispatch from the UK
Fixitsan says: "We are definitely only talking about a single location on the planet which continually monitors the temperature, unlilke [sic] most locations on the planet."
If the implication is that the region covered by CET is a single location on the planet which continually monitors the temperature, unlike most locations on the planet (the problematic part of the point), then we are not talking about the same thing, or at least 'we' have not yet developed a shared common sense of the bigger picture (reasonable common awareness and logical common understanding based on all of the evidence).
Where I live in Canada, scientifically collected (with Stevenson screens and all the other protocols) temperature data is available back to 1884 (when the region I live in was being harmfully over-taken in a 'settlement way' by the invading European colonizers - another emerging understanding that misleading marketing has held at bay for centuries). I am sure there are many other locations with longer histories of temperature data than the region I live in, not just CET.
Check out my comment on the Skeptical Science New Research for Week #29 2022.
There are many unreasonable reasons for the difficulty in establishing a common sense understanding regarding many issues these days. The power of misleading marketing is probably the most damaging scientific development by humans, likely more damaging than nuclear weapons or the diversity of fossil fuel developments.
-
Bob Loblaw at 03:57 AM on 24 July 2022Taking the Temperature: a dispatch from the UK
Wow. Fixitsan sure has a wild game of "look, squirrel!" going on.
From an original claim that a long list of temperaure records from the Central England Temperature series represented UK "national" values, he's gone into full retreat. No longer calling it "national" (he must have run out of "national"s in his keyboard, having used it nine times in his first post), he's backed down to calling it "regional" (not unreasonable), and then local, and finally (in comment #24) saying "We are definitely only talking about a single location on the planet which continually monitors the temperature, unlike most locations on the planet."
His game-killer statement? "But there is clearly 1 location on the earth where that is not true." (He's talking about places with record highs.)
Now, if he had looked at (and understood) the figures provided in the article, he would see that the rise in temperatures across the globe is not uniform. Here is the original figure, copied again:

Notice how the maps show a range of colours? The dark red ones are the hottest (relative to their normal temperature), and the blue ones represent locations that were colder than normal, with a range of colours in between. And Fixitsan seems to think that this is news - and devastating to the science of climate change. Of course, it is not. It's just a variation on the myth "It's freaking cold!" that Skeptical Science already has a page on.
If he understood anything about weather, he would also know that "climate" includes variations about the averages. Gradual warming does not mean that we'll never see cold again (see above link about "it's freaking cold!"), and it also does not mean that we'll never see record cold temperatures set. What we do see is records highs being set a lot more frequently than record lows - as would be expected in a warming climate. It turns out that Skeptical Science has a post about that, too.
https://skepticalscience.com/Record-high-temperatures-versus-record-lows.html
So, Fixitsan still hasn't said anything that is actually new, or that goes against our understanding of climate and climate change. He's just repeating myths that have been around for years - and debunked many times.
His closing comments on temperature seem to be: "...the question needs to be asked about how many other areas do not align with the global trends, and therefore apparently challenge the notion that global warming is not global (affecting everywhere) at all."
Guess what? Some areas are warming less than (or more than) other areas, and some may even show some cooling, but none of this represents any challenge to climate science. In fact, observations such as increased warming at the poles, regional variations in warming, etc. are all things that were predicted by climate theory. Fixitsan's "show stoppers" are actually confirmation of the science.
Then, running out of myths to retreat to on temperature, Fixitsan has jumped the shark to start going on about sea level rise. He's not doing any better on this. All he seems to have is some newpaper headlines and misinterpretations of same.
I'm not sure exactly what sea level rise has to do with temperature records, but I guess the discussion is a least on topic with the UK slant of the blog post.
Having seen his sea level "gotchas" torn to shreds, will we see Fixitsan jump to chase another squirrel? There are lots to choose from. Check out Skeptical Science's Most Used Climate Myths, choose your favorites, and place your bets!
-
MA Rodger at 03:05 AM on 24 July 2022Taking the Temperature: a dispatch from the UK
Fixitsan @33,
So, are you sitting comfortably? Then I'll begin.
The Edinburgh News may appear distributed nationally across Scotland if you live in Edinburgh, but elsewhere it is absent from the shop shelves although it maybe they keep it below the counter for the conveneince of Lothian folk.
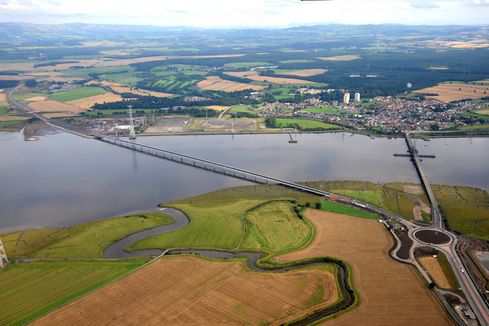
The new bridge at Kincardine has been called the Clackmananshire Bridge since 2008 (previously the Upper Forth Crossing) and it is named as such by the original article in the Scotsman. Mind, you folk down-river may have a different name for it.
But as pointed out @ 26, whatever it is called and whether or not it has "a high water clearance of 9m to the underside of the deck" is all rather irrelevant as it is a hump-hacked bridge (although a very long one) with its approach roads (as with the old Kincardine Bridge) built across the flat lands alongside the water. So with a bit of SLR you maybe can cross the bridge dry-foot but you'd need a boat to access the bridge. This was presumably what the original copywriter at the Scotsman was saying when he tapped out "areas near the Clackmannshire Bridge were identified as at risk" while his editor and some credulous Edinburgh hack then added in the ridicule which you are attempting to prolong.
-
One Planet Only Forever at 02:30 AM on 24 July 2022Taking the Temperature: a dispatch from the UK
Fixitsan,
Regarding the Scotsman article about things near Edinburgh likely being ‘below annual flood levels in 2050’ have a look at the Climate Central map that is linked in the article:
“A map produced by Climate Central, an independent organisation of leading scientists, shows the most under-threat areas.
The map predicts the impact climate change would have by 2050.”
The presented description of the actual Climate Central map is “Land projected to be below annual flood level in 2050”.
Indeed, the approach roads to the Kincardine Bridge and Clackmannanshire Bridge (not the tops of the bridges) are indicated to be below the likely annual flood level in 2050. The approaches to the A91 bridge over the Forth would also be below the likely annual flood level in 2050. And the approaches, and significantly more road length, to the M9 and A905 crossings of the River Carron are also below the likely 2050 annual flood level.
That leads to understanding an answer to your question in your comment @24: "What is one to say to someone who shows to me that the hottest May was nearly 200 years ago ?"
The problem appears to be a lack of interest in more fully, and more logically, investigating things, even things that are rather easy to more logically fully investigate and better understand.
-
One Planet Only Forever at 02:04 AM on 24 July 2022Skeptical Science New Research for Week #29 2022
The following BBC News item is research related.
The audacious PR plot that seeded doubt about climate change
The opening of the investigative reporting story is:
"On an early autumn day in 1992, E Bruce Harrison, a man widely acknowledged as the father of environmental PR, stood up in a room full of business leaders and delivered a pitch like no other.
At stake was a contract worth half a million dollars a year - about £850,000 in today's money. The prospective client, the Global Climate Coalition (GCC) - which represented the oil, coal, auto, utilities, steel, and rail industries - was looking for a communications partner to change the narrative on climate change."
And a concise summary point in the investigative reporting story is:
"What the geniuses of the PR firms who work for these big fossil fuel companies know is that truth has nothing to do with who wins the argument. If you say something enough times, people will begin to believe it."
And people are more likely to believe a misleading/deceptive claims if they have developed a desire to benefit from believing the claim, no matter how harmfully incorrect their desire can be shown to be.
More telling is that it appears that many 'whistle-blowers' are only now speaking up, decades after the beginning of the disastrous damaging plot they worked on as secretively as possible (and after Harrison died in 2021). Many other people have already broken through the attempts by the nasty deceivers and cheaters to hide what they are doing or find other ways to get away with understandably harmful actions.
There have already been other evidence-based reports, notable is Merchants of Doubt (the 2010 book by Naomi Oreskes and Erik M. Conway), on the sordid and wicked things done in the grand massively damaging deception schemes that some very wealthy powerful people and a bunch of greedy others undeniably pursued (and continue to try to get away with).
-
John Mason at 01:22 AM on 24 July 2022Taking the Temperature: a dispatch from the UK
Fixitsan #34 -
It is, and I found it quickly long before you posted the link by a simple search - but it did not get widely-circulated in the denialosphere, probably because it's so self-evidently ridiculous. That means even they didn't think they could get away with using it to attempt to undermine climate science - always their prime objective. Was probably the work of an intern with about 3 days of experience!
-
Fixitsan at 01:14 AM on 24 July 2022Taking the Temperature: a dispatch from the UK
John Mason you said " it has evidently slipped into some dark obscured recess or other."
It is right there up above, don't let anything stop you from earnestly demonstrating a commitment to truth and redo their maths as you see fit
-
Fixitsan at 01:12 AM on 24 July 2022Taking the Temperature: a dispatch from the UK
MA Rodger, clearly not a local, the bridge in Clackmananshire is the Kincardine Bridge, known by no other name.
The Forth Bridge pertains to either the Forth Rail Bridge or Forth Road Bridge, either way, well over 50m or more above sea level.
The Edinburgh News is distributed nationally in Scotland, with the Herald and the Scotsman.
But just for the sake of pedantry as you[ve opened that gate, the Kincardine Bridge (The old one or the new one, you did not specify ?) has a high water clearance of 9m to the underside of the deck.
9m/28 years = 321mm per year of sea level required. Looking forward to hearing you explain how that is possible, when the highest ever during the meltwater period was approximately 60mm per year.
Nearly 1mm PER DAY
You're deluded if you think it is possible, but I cannot wait to hear you explain , how ?
-
John Mason at 00:48 AM on 24 July 2022Taking the Temperature: a dispatch from the UK
Though I would have enjoyed setting things straight with the article, it has evidently slipped into some dark obscured recess or other. You can write an instructive piece on any type of climate misinformation - and I've seen cases where such yarns have actually come from the denier stable in a deliberate attempt to muddy the waters! I do not put anything past them, frankly.
-
MA Rodger at 00:37 AM on 24 July 2022Taking the Temperature: a dispatch from the UK
Fixitsan @27-29,
Why are you persisting with this crazy misinterpretation?
I wouldn't ever describe the Edinburgh News as a 'national' which you appear to have done. It is the Scotsman which is the 'national'. And you are continuing to blather on about the famous Forth Bridge when it is quite evident that the article (its text identical, cut-&-pasted by the Edinburgh News with adjustments for locale from the Scotsman) refers to the bridge further up the Forth at Kincardine but "Clackmananshire" was too long to fit into the headline. -
John Mason at 23:24 PM on 23 July 2022Taking the Temperature: a dispatch from the UK
FixitSan #20:
Had you contacted us when you first heard of this article, we could have done a number on it for sure. We're a small international team of volunteers and can't be everywhere at once1 -
Fixitsan at 23:21 PM on 23 July 2022Taking the Temperature: a dispatch from the UK
Another national newspaper, this time the Kelpies and Forth Bridge could end up under water in 28 years time. The Kelpies are these things
https://www.scottishcanals.co.uk/destinations/the-kelpies/
30 metres high, 28 years, =1071 mm per year ...3mm PER DAY....are they smoking drugs ?
https://www.scotsman.com/sport/football/international/climate-change-could-see-kelpies-and-forth-bridge-under-water-2050-1401090
No it's not drugs, it's fearmongering, and the raising of awareness with the unexpected consequence that kids are demotivated at school due to anxieties about the future.
-
Fixitsan at 23:17 PM on 23 July 2022Taking the Temperature: a dispatch from the UK
https://www.edinburghnews.scotsman.com/news/forth-bridge-and-leith-could-be-under-water-2050-due-climate-change-1328692
-
Fixitsan at 23:14 PM on 23 July 2022Taking the Temperature: a dispatch from the UK
The nespaper published that the Forth Bridge could be under water by 2050 (link attached). That was the headline
Depending on whether you mean the transport deck or the top of the bridge dictates the rate required to cover it
Most people have heard of the Fort hBridge and you can find the facts yourself, and I'm sure divide the deck height by the numebr of years to 2050
How have no scientists taken to the media to discredit fatuous and idiotic claims ?
Published 2019
https://www.edinburghnews.scotsman.com/news/forth-bridge-and-leith-could-be-under-water-2050-due-climate-change-1328692
The bridge is 110m above high water, and 137m above it's foundations, and there's 28 years to 2050 = 3.9 m per year required
I previously used the deck whicht and 31 years and rounded down but still produced 1.5m of sea level rise per year
That newspaper headline sat on the stands, in front of children.
If you're a scientist do you ever respond to nonsense unicorn facts like this or does the fact it helps to 'raise awareness' )in the worst possible way) by creating deep anxiety and causing some children to actually consider suicide due to the hopelesness of their future, or do you just leave this distorted truths to remain ?
I note at the last Extinction Rebellion protest the banner wording demanded 'Tell the Truth' ...so science...when are you going to dispute the fearmongering side of this debate, it clearly does more harm than good if children are left to develop anxiety about a lie
Tell the truth and be responsible.
This isn't just one newspaper on one day, the claims are frequent and equally stupid to anyone with even a basic engineering qualification, for no apparent reasons.
If you're interested in scaring children you have no right to claim ethical integrity as far as I'm concenred, and if as a scientist you fail to demand newspapers retract lies and distortions then you cannot expect people to think you are doing anything but enjoying riding the wave
-
MA Rodger at 23:10 PM on 23 July 2022Taking the Temperature: a dispatch from the UK
Fixitsan @24,
Forth Bridge under water?
I think you are referring to a bizarre report in the Scotsman from back in 2019. Or perhaps it is better described as being a spoof headline that snuck into print by mistake. If I were a subscriber of a paper offering up such a ludicrous story (and my local rag does occasionally get itself carried away with creating seriously bad nonsense, as well as giving column inches over to climate change denial and exaggerated climate threats) I bash off a strong letter highlighting their incompetence.
There were may local newspapers that picked up on the report of October 2019 by Climate Central entitled 'FLOODED FUTURE:Global vulnerability to sea level rise worse than previously understood' . What drew them to the report was the Coastal Risks Screening Map that accompanied the report. Your Forth Bridge story does rather take the biscuit, looking more Sunday Sport than Scotsman so why you bring it up here, I'm not sure.
-
John Mason at 22:15 PM on 23 July 2022Taking the Temperature: a dispatch from the UK
The fastest rate of sea level rise I can think of was Melwater Pulse 1A. Estimates as to the rapidity vary but tend to be around 40-60mm per year over several centuries. Have never heard of anyone citing 1500mm a year! Perhaps you would be good enough to provide a link.
-
Fixitsan at 22:06 PM on 23 July 2022Taking the Temperature: a dispatch from the UK
I don't recall ever suggesting there has been no warming.
We are definitely only talking about a single location on the planet which continually monitors the temperature, unlilke most locations on the planet.
I suppose most people would think that the hottest day of any month, or the hottest average recorded temperature for a whole month would by now, given the frequency and strength of argument update in the media, show without doubt that all the hottest months are relatively recent.
But there is clearly 1 location on the earth where that is not true.
What is one to say to someone who shows to me that the hottest May was nearly 200 years ago ?
I'm in the UK, the UK news swamps me constantly with global warming warnings whenever a single hot day comes along and an idiot lights a fire (clearly even at 100C dry grass doesn't burst into flames, ignition is still always required, self ignition never happens at lower temperatures)
I have a similar issue with sea level rise to be honest, living near to the Forth Bridge which the Scottish National newspaper warned could be under water by 2050. A brief calculation reveals that in order to cover the Forth Bridge the required rate of sea level rise is 1500mm per year. Nasa shows it is currently 3.4mm per year and the historical record shows sea levels have risen at between 1.5mm to 3.5mm per year for about 7000 years.
Who checks the media ? certainly nobody in the science community seems to pull them up for these outrageous claims, but should someone suggest that there hasn't been as much warming as the IPCC says, or the danger is less than claimed, the science community as it is, only puts it's gloves on then, but never when claims are reidiculously overstated and that is a very disappointing judgement to have to make of people who claim to be deeply interested in truth and facts
Sea level rise, we were told would cause The Maldives to be evacuated within 30 years, is another outrageous claim I need to mention as I'm on the subject. I can say that now , because that claim was made 30 years ago and since then the population of the Maldives has doubled and banks lend easily to build sea front resorts and CO2 levels have increased accordingly. I guess we need to throw bank managers in with other people who are acting irresponsibly together with scientists who permit lies to be published
Back to the Forth Bridge, anyone can see where the high tide mark was in 1892 photographs and hold it up today to see where the hgih tide mark is today, and discover that the sea level rise over the past 130 or so years is nothing unusual.
I'm dining tonight with a couple of mid 20's people, who fear, literally fear, sea level rise in this area thanks to media lies and exaggerations, which were made with absolutely no consideration for either what has gone before or what is most likely to happen next (According to NASA). All I'm saying is their distorted view of reality spoils what could otherwise be a good night out. And I bet they would not believe me if I said the hottest month of May in the UK happened hundreds of years ago, despite the record showing otherwise. They're virtually convinced this isle is about to be washed away
Science, sort yourself out, and please, please, shoot down the messengers of lies who predict 1500mm of sea level rise per year, that's nearly 5mm PER DAY are you absolutely out of your mind ? If you allow those lies to persist the net result is it becomes difficult to believe scientists
I am sure at this point in time that a reader of this message is actuvely taking out his TI calculator to try to prove how 1500mm per year is actually possible.
No it isn't, put the calculator away, write a letter to the people who are lying in the news and demand they tell the truth instead if you're a decent sort of human being
I think there has been some warming over the past 100 years
I believe there can never be climate stability, and climate change is the only possible scenario given the large numbers of inputs and feedbacks which are never stable
Therefore I feel it is irresponsible of science to allow any sort of publishing of an argument which claims we can 'get control' of the climate as if the temperature will stabilise and never change once again. It's unicorn thinking. Dire. Idiotic. It needs to be stamped out or else science is guilty of permitting lies to be propogated
-
Bob Loblaw at 11:49 AM on 23 July 2022Taking the Temperature: a dispatch from the UK
MAR:
Thanks. I was going to see if Fixitsan could come up with any sort of analysis as to just what CET actually covers - e.g. station locations and such - but he so far seems to just want to run away from his "national" statement. If he addressed the coverage issue in a realistic fashion, I was going to come back to the suitability of instrumentation in the early periods. You've pre-empted that. (No harm done.)
Even the Wikipedia page has this statement (emphasis added):
This is remarkable given the small region of the world that the CET series represents which results in high variability relative to a temperature series that represents a much larger area, such as the global mean surface temperature.
So far Fixitsan seems to be pretty good at providing a Gish Gallop of numbers, but he's pretty short on understanding what they mean.
-
MA Rodger at 09:44 AM on 23 July 2022Taking the Temperature: a dispatch from the UK
Bob Loblaw @17,
The CET is described as "representative of a roughly triangular area of the United Kingdom enclosed by Lancashire, London and Bristol." That would give it a centre somewhere near Stratford-on-Avon and only the western edge of your red area sitting within that triangle which extends mostly to the south. One problem with using early daily data (or even monthly data) from CET is that it is not using standardised thermometer hosuings. The Met Office do give ranked regional, national and UK-wide monthly averaged data for max min & mean temperatures but only go back to the start of use of the Stevenson Screen in the 1860s. These at least would be "sticking with national averages" which as described by Fixitsan @2 indeed would be "a better guide to what is happening in terms of trends over a larger sample area," although advice apparently then ignored.
These UK-wide top-rankers come in:-
Max Temp - Jan 1916, Feb 2019, Mar 2012, Apr 2011, May 2018, Jun 1940, Jul 2006, Aug 1995, Sep 1895, Oct 1921, Nov 2011, Dec 2015, Winter 1989, Spring 1893, Summer 1976, Autumn 2006, Annual 2014.
Mean Temp - Jan 1916, Feb 1998, Mar 1938, Apr 2011, May 2008, Jun 1940, Jul 2006, Aug 1995, Sep 2006, Oct 2001, Nov 1994, Dec 2015, Winter 1989, Spring 2017, Summer 2018, Autumn 2006, Annual 2014.
But single months and even single years ar subject to a lot of noise so listing out these top-ranked months etc and reflecting on the length of time thay have maintained that top-rank is doing little more than examining randomness. Even for annual means, this UK-wide data provides a randomness spread of +/- 0.9ºC (2 sd) and the rankings will be latching on to even rarer events than 1-in-20.
So the argument set out up-thread by Fixitsan is baseless.
Added to that, the statement @2 that "most of the CO2 was produced before 1989" is wrong. In terms of FF emissions, more has now been emitted since 1989 and in terms of the rise in atmospheric CO2 levels, 1989 sit at about halfway from pre-industrial, but not forgetting the poor old climate system does need a decade or more to get its reaction to climate forcing working significantly.
-
One Planet Only Forever at 09:31 AM on 23 July 2022Taking the Temperature: a dispatch from the UK
Fixitsan @18,
Now we are getting somewhere. But there is further to go.
As you now see, looking at month averages rather than day averages changes things. April 1775's ranking is not the same as the ranking of that warmest April date you found.
Extend that learning to check where the overall year average of 1779 ranks relative to the February 1779 ranking.
The next step is to calculate the 11-year average for the years 1774 - 1784 (centered on 1779) and compare it to the most recent 11-year average. Then compare the 31-year averages (1764-1794 to the most recent 30 years). Is 1779 the centre of a 'period that was warmer than the most recent period'?
Another part of understanding this is that the amount of average global warming since pre-industrial times is only now slightly more than 1.0C. And the Arctic has warmed signficantly more (it really has). So the amount of average increase in a non-arctic area would be less. Review the data set to see if the range of temperatures for a specific date is less than 1.0C (It will be a far larger range of variation). You would also find that the range of average monthly values for February, or April (or any month) was also far more than 1.0C, but less than the range of values for any day within the month. Same goes for the annual values.
Finding a warmest day, or month, or even year, in the distant past in a regional temperature data set is not unexpected. But the warmest 30-year average in the global data sets are the most recent 30 years. And each month is almost certainly warmer than that month 30 years ago. So the 30 year average is now increasing with each new month of global data, even if the new month is a little cooler than the previous year. However, the much higher range of daily values could see a daily value that is cooler than the value 30 years ago. But, statistically speaking, it is more likely that a day this year will be warmer than that date 30 years ago.
-
nigelj at 08:46 AM on 23 July 2022Taking the Temperature: a dispatch from the UK
Fixitsan @18
A hottest month (or day) record in for example the UK in January 1916 doesn't prove the UK isn't warming or that the planet isn't warming. We have clear evidence the UK and world are warming.The old record is likely caused by a rare combination of weather events that concentrates energy in the climate system in one place to cause a temperature record. The planet could warm a couple of degrees as a whole, but it could be a long time before such a rare combination of events happens again, and with global warming added thus setting a new record.Eventually as the planet warms all the old records will be broken but it will take time.
-
Bob Loblaw at 08:11 AM on 23 July 2022Taking the Temperature: a dispatch from the UK
Fixitsan:
You are not addressing the unsuitability of using CET as a "national temperature". You said you are the UK. Surely you understand that the Midlands is not the entire nation?
Not every local area follows the global pattern. This in not at all surprising, and is totally expected. Your "month after month, apparently everything just gets hotter" is a complete strawman argument.
-
Bob Loblaw at 08:02 AM on 23 July 2022Human CO2 is a tiny % of CO2 emissions
A note on the Basic tab of this rebuttal. An astute reader noticed that the paragraph under Figure 1 stated that 40% of the additional carbon is absorbed, but this disagreed with the values in the figure. A check of the original source confirmed the reader's observation. It appears that in the original writing, the 60/40 split was reversed.
The rebuttal has been corrected to use the 60% value.
-
Fixitsan at 07:51 AM on 23 July 2022Taking the Temperature: a dispatch from the UK
I understand your reservation about a single day in a single month, we need to compare a longer spell, like a while month in a year.
We have that data too in the CET, managed by Hadley Centre for Climate Change
Hottest January, 7.5C in 1916
February, 17.9C in 1779
March, 9.2C, 1957
April, 11.8C, 2011
May, 15.1C, 1833
June, 18.2C, 1846
July, 19.7C, 2006
August, 19.2C, 1995
September, 16.8, 2006
October, 13.3C, 2001
Novemeber, 10.1C, 1994
December, 9.7, 2015
Well now there are more warmer average months being declared in recent years, but has there really not been a warmer February since 1779 ?
All of the CO2 produced since 1779 failed to produce a warmer February than that year. WHat was so unusual about that year I wonder which made it the hottest ever even before any manmade climate change had begun.
May 1833, and June 1846 ? We haven't had a hotter May or June since before 1850, yet month after month, apparently, 'everything just gets hotter'
Regarding the regional/local aspect of one single temperature record, if it doesn't reflect the trend of the global patterns of temperature anomalies, the question needs to be asked about how many other areas do not align with the global trends, and therefore apparently challenge the notion that global warming is not global (affecting everywhere) at all
-
Bob Loblaw at 07:45 AM on 23 July 2022Taking the Temperature: a dispatch from the UK
Fixitsan (in several comments):
Hmmm. You seem to be rather inconsistent in your selection and discussion of data. In your first comment (#2), you make specific reference to the Central England Temperature (CET) record, but then you start talking about "national" temperatures. In fact, your comment #2 uses the word "national" nine times.
The CET is indeed well-known and documented. Wikipedia has a page for it.
It also appears that many (if not all) the record temperatures and dates that you provide are for the CET. The Wikipedia pages says that the "Central" in CET refers to the Midlans of the UK, and links to a page that contains the following map:

Yet, when I follow the link that John Mason gave in comment #4, to the UK Met Office report, they provide an animated GIF image of the maximum temperature comparisons for specific hot summer days in the years 1976, 2003, 2019, and 2022 (this week). When I look at those maps, I see that the Midlands usually is not part of the hottest regions of the UK for any of those maps. (Follow the link to the report to get a full-sized image.)

You also make the comment (third paragraph of comment #2) that "The strength of reporting on local temperature highs always seems to be given more importance then another useful metric, the national average temperature."
So, I have one question (for now): why are you using a regional analsyis of temperature (CET), and presenting it as a "national ...temperature"? Are you not making exactly the same mistake that you are saying other people should not be making?
Please provide a justification for treating CET as a "national temperature", when it is clear that it does not represent the area of the UK that tends to have the hottest temperatures. Why did you select CET, with its limited geographical coverage, for this purpose?
-
One Planet Only Forever at 06:23 AM on 23 July 2022Taking the Temperature: a dispatch from the UK
Fixitsan,
In your comment @9 you state "Can you explain why there hasn't been a hotter April than 1775 after 247 years of CO2 production ?" while offering as evidence that 'one day in April 1775 was the warmest in the record (of temperatures in a small part of the planet)'.
That leads to the requested test that 'the overall average of the Month of April 1775 be performed and compared to all other overall April values in the data set. That tests the claim that 'finding a hottest day in a month is consistent with that Month also being the hottest'.
But, more logically based on all the global evidence (not just a region's evidence), the understanding is that human activity has 'statistically significantly' caused significant rapid recent warming resulting in 'statistically significantly' higher local temperatures to occur more frequently.
Investigating a data set for part of the planet and finding a day in April 1775 that was warmer than any other temperatures on that date in other years in that data set (btw, was it statistically significantly warmer?) does not 'statistically significantly' contradict the understanding based on all of the evidence that "human activity has 'statistically significantly' caused significant rapid recent warming resulting in 'statistically significantly' higher local temperatures to occur more frequently."
-
John Mason at 06:03 AM on 23 July 2022Taking the Temperature: a dispatch from the UK
Rearranging deckchairs on the Titanic is the first thing that comes to mind!
-
Fixitsan at 05:09 AM on 23 July 2022Taking the Temperature: a dispatch from the UK
How did April 'stand up'...to what ?
As I clearly pointed out to you that August's hottest peak temperature and hottest average temperature were on different days, then so to it could be expected the same for April.
The highest peak temperature for April was 25C, on 16th April 2003, and the highest daily average for April was 19.7C on 29th April 1775.
Given the wide spatial separation of individual thermometers it's no surprise that we always see a new peak in some areas, year after year, as the occasional coincidence of the highest regional temperature aligning with a recording thermometer occurs
-
One Planet Only Forever at 04:52 AM on 23 July 2022Taking the Temperature: a dispatch from the UK
Fixitsan,
Presenting a failure to comprehend my comments would be your fault. Repeating a clearly questionable point is still questionable.
How did the average for all of the month of April 1775 stand up? Surely that hottest day value you found is consistent with the month of April 1775 being the warmest in the record.
By the way, thank you for accepting that the MET was correct to warn about and report high local maximums.
-
Fixitsan at 04:01 AM on 23 July 2022Taking the Temperature: a dispatch from the UK
One Planet
Have you no answer as to why April and May have never had a higher daily average temperature than before the industrial revolution , about which it is said caused global warming, as in all places ahve got warmer.
Clearly there's at least one place where that doesn't seem to have happened and I wonder, how many others after that ?
-
One Planet Only Forever at 03:56 AM on 23 July 2022Taking the Temperature: a dispatch from the UK
Fixitsan @9,
"I suggest you review night time temperatures whcih don't appear to have risen statictically significantly".
Still sticking to 'hottest day maximum temp in a month - a day in April 1775', denying the logical fallacy of that methodology, says everything that needs to be said. You didn't even check the average of max and min on a day to see if your belief stands up to that weak test ( a weak one because you claim the nights are not statistically warmer). And, of course, you evaded the stronger test (logically built on your preference for averages) of where the Average of all of April (max and mins) in 1775 ranks in the list of Aprils.
The facts clearly contradict the story you are trying to sell. Everyone can confirm that independently. Also the warming of the nights is "statictically significant - confirmed to have happened in the temperature records everywhere". Though admittedly, as has been said, "There are lies, damn lies, and then there are the twisted ways some people abuse 'data manipulation - like statistics'.
I, and some others, strive to pursue and rely on logical understanding that best explains all of the evidence.
The logical understanding based on the evidence of the comments you have provided is you 'statistically' appear to 'confidently' prefer 'poorly justified beliefs' over 'logical improved understanding based on all the evidence'.
-
Fixitsan at 02:31 AM on 23 July 2022Taking the Temperature: a dispatch from the UK
Bear in mind (this weakens my argument because it is disrespectful to the Met) that the Met pulled out of the lucrative business of long range weather forecasting (of vital importance to farmers everywhere, because getting it right at planting time can be worth 15% moire profit), because their moderate level of accuracy was surpassed by a more superior method which included solar and cosmic activity, while previously the Met Office had stated they did not think the sun affected the UK's climate.
Surely, climate only exists because of the sun.
No sun, no climate, and no climate change.
I say that with confidence as someone who firmly believes climate stability is a pseudo religious belief, and, there doesn't seem to be any evidence that the multivariant input based climate of the earth should ever see those variable parameters stabilise, ever, due at least to the fact that they all feedback into one another in various ways and particularly crucially, with different rates of change.
Stability is an impossibility and as far as I'm concerned the expectation of climate stability is a fools errand
-
Fixitsan at 02:22 AM on 23 July 2022Taking the Temperature: a dispatch from the UK
@ One Planet, I suggest you review night time temperatures whcih don't appear to have risen statictically significantly
Can you explain why there hasn't been a hotter April than 1775 after 247 years of CO2 production ? Do you even accept the notion that 1775 was the year of a record hot April day, and no other April since records began have had a higher average ?
Seemingly you suggest that it could have been hotter at night, are you saying it is your belief that in the April of 1775 there was record high night time temperatures - what would be the reason for that ?
The fact that you can suggest an alternative theory doesn't make the proposed theory incorrect. Just as I suggest that while I can read much fearmongering about how the world is getting warmer I can find an interpretation of the data which doesn't really support it, shouldn't you be willing to accept that, if you're open minded about it a hotter April or May should have occured by now after the output of CO2 from the industrial revolution, creating over 1Celsius of temperature rise last century. How many people do you realistically think would accept that after 200 years of Industrial revolution that April and May have never been hotter than before then ?
-
Fixitsan at 02:14 AM on 23 July 2022Taking the Temperature: a dispatch from the UK
@ John Mason. The qualification parameters for entry into the CET record are not applicable to the CET.
The Met office comment on many observed temperatures, but those sources are not affiliated to the CET record, depsite the Met mentioning them. The Met comment on many temperature measurements every year, none of which form part of their managed CET record
Be honest you don't know if it was hotter 20 years ago in a place where there was no thermometer. Statictiscally possibl;e, as thermometers are located on such a small amount of area of the UK
-
One Planet Only Forever at 01:47 AM on 23 July 2022Taking the Temperature: a dispatch from the UK
Fixitsan @2,
The following logical understanding supports the MET Office warning about and reporting localized extreme maximum temperatures:
Heat can kill. And a person in a location of extreme heat does not have the ability to turn on the "National Average" to reduce the Heat they experience.
-
One Planet Only Forever at 01:30 AM on 23 July 2022Taking the Temperature: a dispatch from the UK
The daily average would more correctly be the average of the max and min temperatures that day. The night could be warmer.
-
One Planet Only Forever at 01:26 AM on 23 July 2022Taking the Temperature: a dispatch from the UK
Fixitsan @2,
A focus on averages by month would logically lead to comparing 'monthy averages' rather than hottest average day in a month.
That evaluation should Fix It for everyone concerned.
And an average would be the average of day and night values, not an average of the daytime highs.
-
John Mason at 01:16 AM on 23 July 2022Taking the Temperature: a dispatch from the UK
UKMO have just posted this:
https://www.metoffice.gov.uk/about-us/press-office/news/weather-and-climate/2022/july-heat-review -
John Mason at 00:51 AM on 23 July 2022Taking the Temperature: a dispatch from the UK
Not sure what point(s) you are trying to make here but let's start with your claim in paragraph 4. To wit: "when we saw our national record peak temperature occur (37.3 recorded by the Met Office, which does not include RAF airports as data sources"
Erm, the Met Office tweeted this on July 20th: -
Fixitsan at 00:15 AM on 23 July 2022Taking the Temperature: a dispatch from the UK
As a UK resident I have a vested interest in the situation we just experienced, although, being located 15 miles of Edinburgh I note that the rain we had on the hottest day of the year stood no chance of being reported as anything unusual, given the hysteria bias trending towards bad news selling better than good.
I awoke today to an outside temperature of 13 Celsius, so that was summer then, eh ?
The strength of reporting on local temperature highs always seems to be given more importance then another useful metric, the national average temperature.
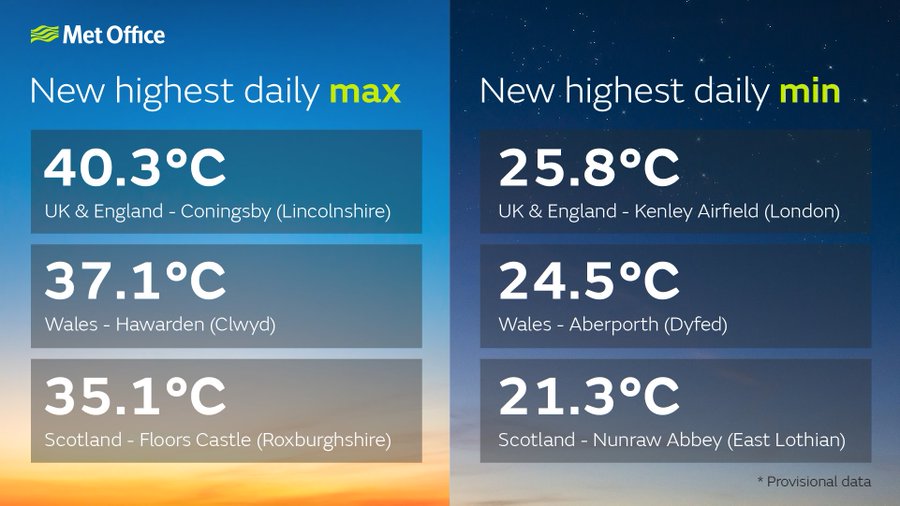
Perhaps it goes without saying that nobody would be surprised to hear that on the 19th July 2022, when we saw our national record peak temperature occur (37.3 recorded by the Met Office, which does not include RAF airports as data sources) , we also saw a new record in the national average temperature being broken, at 28.1Celsius (for the whole of the UK covered by the national temperature monitoring service)
This all relates to the recording of temperatures by the Met Office at Hadley Centre, who maintain the worlds longest running instrumental temperature record which began in 1659, known as the Central England Temperature record, CET, meticulously maintained by them, and data from which is at the core of many climate models.
So it was a record July for both peak and average temperatures. Regardless of whether you include an RAf station or not. Fair enough
Of course the data is still only temporally corelated to reality. Nobody knows for sure if last year we had the hottest peak temperature on record occuring between two measuring stations, hence why a high peak recorded temperature isn't quite as reliable as the national average, (although the press certainly seem to think there is more newsworthiness and therefore £'s creation potential in scary news about high peaks, disregarding averages in the process)
Therefore, sticking with national averages and not instantaneous single location peak temperatures seems a better guide to what is happening in terms of trends over a larger sample area, nationally, than a single point reading at an airport somewhere can be relied on for.
In turning to the data of the well regardied CET record now, for a look at other national daliy average (mean) temperatures the next month August was hottest in the year 2020. With 25.2C on 12th August 2020 (The highest peak for any August day, recorded by CET, is 33.4C on 3rd August 1990
This means if we use averages then we can see that the two months discussed so far have their record average tempertures occuring in just the past 2 years, eliminating all doubt that warming is occuring. Hopefully
So having shown the effectiveness of using a daily national average temperature, instead of an instantaneoud peak value, lets consider the other highest peaks
Highest average for any January on record ? That was 13.6C on 23rd Jan 1834. That's right, the most recent hottest January average temperature in the UK was at a time when Marie Antoinetter was consort to Prince Louis and Charles Babbage was still working on the design for the analytical engine
The highest February average ? 12.8C on 4th Feb 2004, anpother quite recent one
Hottest March ? 15.2C on 30th March 2017, more confirmation of recent warming here
Hottest April ? Bear in mind the story is that the industrial revolution is the cause of all global warming, it seems strange that both April and May highest averages both occur before 1800, arguably before the indurtial revolution really got going. How come all of the CO2 from the industrial revolution has yet to produce a hotter April or May average than a date before the revolution itself happened ? Very odd, but all reliable data nonetheless from the Met Office and the worlds longest running reliable instrumental temperature record
Hottest June ? 22.9C 3rd June 1947, the year the cold war began. Hasn't global warming made a hotter day than that in June during the past 75 years ? It appears not
July and August I've already mentioned
September ? 22.3C on 2nd September 1906. Cars had wooden wheels back then. Have all the emissions from all the cars made since then not made Septembers any warmer than in 1906 ? Definitely not !
October ?, more recently again, 20.1C on 1st October 1985. It's the year of Live Aid. But still, 37 years of death inducing global warming since then still hasn't given us a hotter October, yet
November ? 15.5C on 5th November 1938, 11 months before the start of WW2 in Europe. Didn't all the munitions emissions, and emissions from cars, and all the flights in aircraft and ships since the start of WW2 produce a hotter November than one before WW2 ? No !
December ? 12.7C on 12th December 1994. This means that every person born in Britain since 1994 have yet to experience a hotter December average temperature than the one in the year they were born, 28 years ago (but yet they might well be the ones which think it just keeps getting hotter month after month, given that they've also had the most exposure to the 'it's always getting too hot' paradigm, which is produced if you only look at randomly produced peak temperatures, and not averages
So to recap, lets recall the amount of serious messaging about climate change which probably dates back to 1989, when Mrs Thatcher addressed the UN and stressed the importance of a worldwide commitment to reducing CO2. Anything since then is a year in an era when it has been fine to suggest we might only have ten years left to live, or only a few days left before doomsday due to climate change, and recall how most of the CO2 was produced before 1989, so how come that of the 12 months in every year, only 5 of those months have been hottest since 1989, and 2 were hottest before the start of the industrial revolution (which apparently causes global warming, except not in April or May)
-
Bob Loblaw at 22:15 PM on 22 July 2022Taking the Temperature: a dispatch from the UK
"Can you spot 1976 amongst 2014-2021?"
Oh, I know! I know! Pick me! Pick me!
Could it be.... the one in the middle?
It's like watching an episode of Sesame Street:
One of these things is not like the others,
One of these things just doesn't belong,
Can you tell which thing is not like the others
By the time I finish my song? -
One Planet Only Forever at 07:03 AM on 22 July 2022Recklessness defined: breaking 6 of 9 planetary boundaries of safety
The analogy of the dangerous bus is good. But a Structure analogy may be better, though far less amenable to engaging and colourful story-telling.
An important point is the unsustainability of life on this planet if any of the identified safe limits (boundaries) are exceeded. A related understanding is that it is likely that additional Boundaries will be identified (the ‘Novel Entities’ category is for newly identified boundaries). And the competition for popularity and profit has proven it is very unlikely to investigate and limit the harm done by its developments.
The Structure analogy would be something like this:
- This amazing planet is the only structure/system available to humans that is certain to be able to support life that humans can be a sustainable part of.
- An environment developed that has sustained a diversity of life for millennia. Life evolved in ways that were sustainable parts of the developed evolving structure/system.
- Like any physical structure (building), parts of the global life support structure can be degraded. What is important to the future of life is that ‘critically important aspects of the structure are not impacted beyond the safe limits (degraded or over-loaded)'. The Planetary Boundaries are critically important structure aspects. In Structure design they would be like the elements of the Primary Structure System. If part of the primary system fails the entire structure will fail. The life support structure is at risk of failure if any of the critical boundary safe limits are exceeded. And the magnitude of the failure will increase the longer, and more severely, any safe limit is exceeded.
- Through the millennia the global life support structure has had parts (regions) develop to be very unlivable ‘considered to be deserted’. But the changes were almost always gradual enough, or localized, allowing life to continue to evolve and adapt to the slow changes. However, occasionally something happened that pushed things beyond a global safe boundary for life and did it so rapidly that a lot of life perished.
- It is helpful to identify which boundaries are beyond the safe limit. But what is more important is the history and current trend regarding each critical concern. Ocean acidification looks OK at this moment (below the safe limit). But if the trend is ‘rapid recent increase likely to continue that way for a while’ then it is a potentially larger problem than a case where impacts are beyond the safe limit but are declining. And that ‘trend rate’ evaluation would clearly indicate that Climate Change is a major problem (note: in the original Planetary Boundary evaluation, done only a few years ago, Climate Change impacts were below the safe level).
Humanity has developed, for the first time in history, to undeniably be ‘pushing things beyond global safe boundaries for life so rapidly that a lot of life has and will perish’. Many critical aspects of the planetary life support structure are being rapidly severely degraded because of ‘human development’. And many, but not all, members of the developed global leadership (the global wealthy and powerful) struggle (fail) to help stop the obvious undeniable destruction. The unhelpful ones try to:
- maintain their status in the Status Quo (maintain popularity and profitability)
- deny or diminish the severity of problem (promote deliberately misleading marketing to get people to misunderstand the issue)
- stifle, threaten, or attack anyone who tries to raise awareness or improve understanding of the problem and the required corrections of the developed Status Quo.
-
One Planet Only Forever at 03:41 AM on 22 July 2022Recklessness defined: breaking 6 of 9 planetary boundaries of safety
Hedeholt @2,
I tend to agree that ‘developed measures of poverty and its reduction’ (said that way for a good reason), are not based on a fuller understanding of what is going on. The Sustainable Development Goals do a decent job of presenting the required corrections of what has developed. And limiting global warming impacts makes it easier to achieve and improve on the SDGs.
Indeed, independent farming families can incorrectly be counted as ‘living in poverty’ if they do not appear to participate in economic activity. And they can be harmed by having global trade reduce their ability to benefit from selling their produce in their local markets. But in many cases their lives can be at unnecessary risk due to many things including:
- a lack of sustainable access to food and water (lack of assistance in times of need)
- a lack of health care
- a lack of education (including not learning how to farm more sustainably)
Properly discovering who needs help to sustainably improve their lives is challenging. Many people living in rain forests only need to have the negative impacts on their environment ‘by others’ stopped. They only need ‘assistance’ if the harm done to their environment will not be stopped.
That is a way to understand many developed problems. ‘An individual or collective portion of humanity’ develops activity that is beneficial (profitable) for them or their group (sub-set of humanity), but is understandably detrimental to other life (including, but not restricted to, future generations of humanity). And that group mislead themselves and others into believing that their actions are ‘not unacceptably harmful’ or that their harmful unsustainable activity benefits other humans. They try to claim that the broader benefits of their harmful profitable pursuits include reduced poverty levels. But they do not rigorously investigate their claimed benefits to ensure that the improvements are valid and sustainable.
That understanding applies to the Ozone case (and climate impacts and so much more):
- Some humans developed ways of personally benefiting that were damaging the ozone layer.
- The ones benefiting did not investigate if what they were doing was harmful.
- Eventually, people external to the systems of pursuit of benefit discovered that harm was being done and how it was being done.
- The marketplace competition for ‘more perceptions of improvement’ failed to respond to becoming aware that the developed popular and profitable activities were harmful.
- Even learning that the damage done to the ozone layer was going to be harmful to the ones benefiting from the damage done did not result in effective marketplace corrections.
- It took some time, but eventually global leadership powers agreed to actions that would collectively reduce the harm done. But even their agreement allowed harm to continue to be done. Each nation’s leadership was allowed to decide how rapidly they would stop the harmful activities.
The Climate Impact story goes beyond the story regarding Ozone impacts.
An added step in the climate impact story is the massive continuing efforts by ‘beneficiaries of fossil fuel use’ to raise doubts about the need to rapidly stop the harmful activity, efforts to delay correction of what has developed. And one of their most twisted misleading marketing efforts is claiming that reducing fossil fuel use will harm the poorest.
The only people who can really be excused for attempting to benefit more from fossil fuel use today are the people who are living less than basic decent lives (including the desperately poor in the supposedly more advanced nations). The richest can afford to reduce their pursuit of fossil fuel benefits (they could have afforded it 30 years ago). And the richest should be helping the poorest improve their lives with minimum harm done, with minimum pursuit of benefit from fossil fuel use, even if that causes the richest to lose some degree of their ‘developed perceptions of superiority’.
-
hedeholt at 00:02 AM on 22 July 2022Recklessness defined: breaking 6 of 9 planetary boundaries of safety
I agree totally in the dangerous way we 'drive' right now. However, at the same time, to me the metaphorical story misses the point and especially in its post-script talking about the 'successes'. To me (and others) is the extreme poverty graph based on a false narrative that instead, arguably, shows how more self-sustained (often productive small local farmers) been made to consumers of goods in a global marked driven economy that make the same person living a much more 'poor life' in the outskirts of global south’s megacities. Having their own small farm didn’t require money to live a decent life, while you with even 10 USD/day become much more vulnerably and miserably if you need to buy everything you need (in spite of statistics claiming the opposite). I recommend Jason Hickel’s book “The Divide” (2017), and especially its second chapter, for those interesting in data and discussions underpinning this alternative explanation. I’m not very sure about the details re the ozone hole, but I suspect that that challenge rather became a market opportunity, than something that question the kind of system and way of ‘driving’ we have today?
-
David Hawk at 21:00 PM on 21 July 2022Recklessness defined: breaking 6 of 9 planetary boundaries of safety
Well said. In 1985 this might have been ignored as ad hominen material. In 1975, when I managed a major Swedish environmental deteioration project, showing why we are incapable of managing phenomena like climate change, this story of the human bus would have been laughed at. In 1979, when the results of that project were presented to OECD, a very angry Director of the US EPA called it a hoax. Now that climate change is essentially outside management, we see this sotry as "interesting." Humans?
A 2019 book, "Too Early, Too Late, Now what?" republishes the 1979 work and is "interesting." A 2022 clarification of the thesis urgency was seen as a "non-book" by Amazon and sold in candles, so you could morn as you read. After dessent by book buyers it was moved to the T-shirt section, where harsh depression is placed by youth up front.
Moderator Response:[BL] Once again, you are treating each post you make as a chance to advertise your old book. In the future, any such comments will be deleted in their entirety, instead of just deleting the offending portion.
You are violating the "Excessive repetition" section of the Comments Policy (as well as, possibly, the .no spamming, sloganeering, and off-topic sections).
Please note that posting comments here at SkS is a privilege, not a right. This privilege can be rescinded if the posting individual treats adherence to the Comments Policy as optional, rather than the mandatory condition of participating in this online forum.
Please take the time to review the policy and ensure future comments are in full compliance with it. Thanks for your understanding and compliance in this matter.