


 Arguments


Recent Comments
Prev 755 756 757 758 759 760 761 762 763 764 765 766 767 768 769 770 Next
Comments 38101 to 38150:
-
Russ R. at 03:19 AM on 20 February 20142014 SkS Weekly News Roundup #7
Thank you Tom,
I don't have the bandwidth to maintain numerous parallel debates threads (I have a full time job and a fiancée who's becoming increasingly annoyed with me for paying more attention to climate blogs than to her.)
I'll make a few concluding comments to others here been patiently awaiting responses, and I'll continue discussion with you.
-
YubeDude at 03:08 AM on 20 February 20142014 SkS Weekly News Roundup #7
@64
His is a tsunami of irony; he decries the use of manipulative and misleading rhetoric by using manipulative and misleading rhetoric...”Hey kettle, you’re black!” Said the pot unabashedly and with a total lack of self awareness.
Not sure what I enjoy more, his fluid use of language and the wave upon wave of subtle yet obvious sophistry or that awesome goatee. -
Composer99 at 02:49 AM on 20 February 20142014 SkS Weekly News Roundup #7
I would say Tom Harris' title is correct - climate rhetoric can and does undermine rational decision-making; only it happens that it is his content (and his climate-related work in general) that constitutes the undermining rhetoric.
-
YubeDude at 01:58 AM on 20 February 20142014 SkS Weekly News Roundup #7
@62
Here is the link and a couple of excerpts...
"It is not surprising that language has always been an important weapon of war. Delivered with rhetorical flare, language has driven ordinary citizens to perform heroic acts of self-sacrifice in defence of their countries, while pushing others to incomprehensible acts of stupidity and barbarism.
Rhetoric is key in the political battle over climate change. With global warming virtually non-existent during the past 17 years..."
And of course...
"Carbon is a solid, naturally occurring, non-toxic element found in all living things. It forms thousands of compounds, much more than any other element. Medicines, trees, oil, even our bodies are made of carbon compounds."
If Tom will allow me, I believe what he is trying to say is Carbon is harmless and that there is "virtually" no warming; along with saying that language (albeit purposefully mendacious and manipulative) can encourage stupidity. I do believe he got this last part right; the first part not so much.
Opinion: Climate rhetoric undermines rational decision-making FEBRUARY 4, 2014
Moderator Response:[RH] Shorten link that was breaking page format.
-
Dikran Marsupial at 01:36 AM on 20 February 2014How we know the greenhouse effect isn't saturated
mgardner wrote "And what the attenuation would be for IR radiation in some CO2 band through that 'layer'."
FWIW, I think you are missing the point, what matters is the temperature of the atmosphere from which outbound photons are not absorbed. It doesn't really matter how much IR is attenuated in the "opaque layer" as some of the energy of the absorbed photons will still be transmitted to the "translucent layer" via collisions, convection and re-radiation. As it happens, IIRC, the opaque layer isn't actually saturated either, but it would make no real difference if it was, or whether it had enough CO2 to be saturated ten times over. What matters is the energy of outbound IR that isn't absorbed on its way out into space.You may find part 2 of the RealClimate blog post of some interest as well.
-
How we know the greenhouse effect isn't saturated
mgardner - The "...thickness of an 'opaque' 'layer' just below..." would be all the way from that altitude to the ground. And it's not, properly speaking, a single opaque to transparent transition, but rather increasing mean path length (10's of meters to kilometers) with decreasing GHG density, until ~50% or more of the IR photons in GHG frequencies are escaping to space.
Some additional resources for you: Trenberth et al 2009, Earths Global Energy Budget, figure 1:

Also an excellent GHG Java simulation from PHET that shows absorption re-emission events varying with GHG concentration, as well as the ability to run some glass plate "layer" experiments.
-
mgardner at 00:30 AM on 20 February 2014How we know the greenhouse effect isn't saturated
HK et al
I did some more searching and came up with this:

If I understand correctly, we take something like 5km to be the altitude above which attenuation of IR by CO2 is negligible--"where energy radiates freely to space".
Now, without telling me about how it all varies with season and latitude, and all of the complications involved in doing the calculations, can I find out about what that altitude would be if we double the CO2 concentration? Is it 100m higher, or 1km higher, or 4 km or what? I can eyeball that the temp changes between 5-10C in 1 km.
I would also like to know, again, order of magnitude, what the thickness of an 'opaque' 'layer' just below that original 5 km altitude would be. And what the attenuation would be for IR radiation in some CO2 band through that 'layer'.
This is what I'd like to see represented on a graphic. I'm beginning to realize that there may not be one anywhere with that kind of resolution, and perhaps I will set up a chalkboard, draw some diagrams, take a picture, and post it here to have you guys check it out.
-
Composer99 at 00:15 AM on 20 February 20142014 SkS Weekly News Roundup #7
Unrelated to what will hopefully be a fruitful discussion between Tom Curtis & Russ R., I see the Vancouver Sun opinion piece describes some recent misinformation efforts by Tom Harris (who you may recall was sending young minds down the path of denial while teaching at my alma mater).
-
michael sweet at 20:53 PM on 19 February 20142014 SkS Weekly News Roundup #7
Chris:
I think everyone sees what is going on and understands why. Tom has decided that he has the patience to continue with this discussion anyway. I think this is a good learning experience for the rest of us to see how to deal with this type of intrangience, which is common on other blogs. If nothing else, it shows that SkS interacts with people who think blog posts trump peer review.
I have learned a lot from reading Tom's last couple of posts. It will be interesting to see where it goes.
-
Dikran Marsupial at 19:58 PM on 19 February 20142014 SkS Weekly News Roundup #7
Tom, sure, best of luck, it is fortunate that Russ has someone with the patience to go over all of this in detail, lets hope that he can make some use of it.
-
wili at 18:37 PM on 19 February 2014Vision Prize: scientists are worried the IPCC is underestimating sea level rise
Anyone interested in keeping up with all things related to accelerated sea level rise should keep an eye on postings by ASLR here
Moderator Response:[PS] Fixed link
-
Cedders at 14:37 PM on 19 February 2014Extreme weather isn't caused by global warming
Of course! There's a roughly exponential factor besides the difference in temperatures. "water holding capacity of air increases by about 7% per 1°C warming" Trenberth KE (2011) Changes in precipitation with climate change. Clim Res 47:123-138
Thanks for sorting that out for me, Rob.
-
Tom Curtis at 12:52 PM on 19 February 20142014 SkS Weekly News Roundup #7
Rob @57, thanks. I hope the dental bills are not too high ;)
Chriskoz @58, my understanding of the weekly news roundups is that they do not have a specific topic. For that reason I switched the discussion with Russ from another thread so we could explore a wide range of issues necessary to show that the issues he raised, and which I quoted @28 do not allow inaction on climate change as a rational choice (or at least, not if we take equity to be a genuine value). I certainly do not want my discussion of those issues to interfere with discussion of other independent issues Russ has raised here.
Moderator Response:[PS] Your understanding is correct.
-
chriskoz at 12:31 PM on 19 February 20142014 SkS Weekly News Roundup #7
This thread has gone way off topic.
To put things back on track, I want to recall the reason this whole haywire discussion started: Russ@1 critique that the two of the articles above (by Nicholas Stern and Justin Gillis) are using seemingly contradictory arguments to suit the common cuase, to quote Russ:
you [presumably Nick & Justin] can't use an argument (i.e that specific weather is clear evidence of climate change) when it suits your cause (as with heat in Australia) and then turn around and argue the opposite when it doesn't suit you (as is being done with the cold in the US)
Russ does not explain what he means by "specific weather" and "your cause", but later @4, he explained that he means "particular local weather event" and "your belief that global warming is a serious problem that requires urgent policy action".
Mod [JH] asserted the articles do not apear contradictory if you read them in full. Why no one picked on that? Indeed, after reading them, I found out that:
1. Both Nick & Justin are talking about global weather events. Nick is talking about several "extreme event", like recent floods in UK, typhoon in Philipines, heat waves in OZ, to prove his point that weather has gone crazy worldwide, with unprecedented damages. Justin is taking about recent cold and warm temperature extremes, arguing that the globe is indeed warming on average, despite his fellow US citizens opinions: "it cannot be global warming because it's so cold here". So it is clear for me, that both article do not talk about "particular local weather event" only, as suggested by Russ@1@4
2. I note that only one author (Nick) is advocating policy actions in his article. Justin does not talk about any policies. So, it's incorrect suggest that a "belief that global warming is a serious problem that requires urgent policy action" is a commonpiece of those two.
Therfore I conclude, that Russ in his post@1 either:
- intentionally misrepresents the content of the articles he's commenting about, or
- does not care about the content of the articles and if his comments are accurate and in the proper context
In either case, he uses the distorted interpretation of the articles as an excuse to create a strawman argument, according to his agenda. In the ensuing discussion, he's been jumping from topic to topic, continuing to cherry-pick the data and selective-quoting from articles presented to him, creating further strawman arguments.
-
denisaf at 12:19 PM on 19 February 2014Customizable Global Warming Widget Metrics
Why select this one example of the malfeasance of the technological systems of civilization. What about metrics that depict the rate of loss of aquifer water, top soil, nutrients in soil, forests, flora and fauna, irreplaceable natural material resources (including oil), marine food chain.
Moderator Response:[PS] because this site is dedicated to debunking climate myths. Lets not go offtopic please however worthy the sentiment.
-
Rob Honeycutt at 12:01 PM on 19 February 20142014 SkS Weekly News Roundup #7
You got it, Tom.
I'll just sit in the corner over here and grind my teeth. ;-)
-
Tom Curtis at 11:34 AM on 19 February 20142014 SkS Weekly News Roundup #7
Could I make a request to other participants on this forum that they leave it to me to respond to Russ in relation to his responses to my post @28 and following discussion. I know there is plenty to respond to in what he writes, and of necessity I am not covering all points. However, just from the points I am covering it is becoming plain that Russ is very, and inconsistently selective in which evidence he will admit. Adding more voices to the debate will distract from that point, and also make it less likely the discussion will continue to the end where it covers those areas Russ incorrectly percieves as his strong points.
Moderator Response:[PS] This is a reasonable request and I would ask participants note the "No dogpiling" rule. Corrections or further elucidations of comments would help but please dont add new distractions.
-
chriskoz at 11:27 AM on 19 February 20142013 Among Top Ten Warmest on Record
Dave@1,
I second that. And it's a pity that such good, information-rich article as this one receives so little commentary attention from our fellow bloggers while the Weekly News Roundup #7 thread is going haywire feeding a troller (user-named Russel R.) who has high-jacked it to feed his strawman arguments.
It's worth noting that the global temperature data used in this WMO report may be biased low if it does not include the CW2014 correction for lack of coverage in Arctic (look at figure 2 therein and compare to to figure 1 in this article, which one do you think should go to the resources page?) Looks like data the figure 1 in this article is based on combined NCDS/GISS/HadCRUT, so it's probably less biased than HadCRUT itself, but it's still revealing to compare it to CW2014 Hybrid data where 2013 comes up warmer than 1998.
-
Tom Curtis at 11:26 AM on 19 February 20142014 SkS Weekly News Roundup #7
Russ @47:
1) Fundamentally the Transient Climate Response (TCR) is a function of feedbacks and thermal inertia. By definition, the Equilibrium Climate Sensitivity (ECS) is the response after thermal equilibrium with the oceans is reached, and, ergo, is not a function of inertia. On the other hand, thermal inertia is a confounding factor in calculating the ECS from empirical data. Getting these details right matters.
Turning to the substance of your comment, you claim that "...geological evidence points to a planet see-sawing between two relatively stable equilibrium climate conditions, which suggests high sensitivity in the middle of the range, and low sensitivity at either end of the range". That, however, is the reverse of the true situation. As global temperature falls, ice sheets creep towards the equator in the NH. As the edge of the ice sheet, and perhaps more importantly, the southern limit of winter snowfall creeps closer to the equator, it must deal with more direct sunlight, with the consequence that the albedo effect becomes greater and you have a stronger climate sensitivity. Conversely, with rising temperature, humidity rises, and with it the strenght of the water vapour feedback. In fact, water vapour concentration rises with the fourth power of temperature so that in the right conditions, increasing temperature mean that water vapour can force a runaway greenhouse effect. The right conditions include strong enough insolation, and fortunately for the Earth is safe from that outcome - but that does not preclude an increasing climate sensitivity with increased temperature due to a strengthening WV feedback.
As noted by Dikran Marsupial, your evidence for the convenient ECS plateau we are supposed to occupy also has it wrong. The Earth has in fact experienced at least two, and probably more runaway cooling events. Further, our nearest neighbour, Venus, has experienced a runaway warming event (which unlike the cooling events are not, for practical purposes, reversible). Physics does not change between planets. If increasing temperatures drives increasing climate sensitivity from the WV feedback (necessary for a runaway warming event) in Venus, then they drive the same effect here. Fortunately we are protected from the final outcome of such an event by lower insolation, and had greater protection in the past when the Sun was cooler, though CO2 concentrations were higher.
That raises another point, for the strength of feedbacks also depends on the strength of insolation. Consequently, climate sensitivity would have been lower in the deep past than now with the same configuration of continents (the additional factor effecting climate sensitivity). That is something that should be born in mind when looking at paleoclimate results, particularly from the deep past (pre-tertiary).
To summarize, your comforting belief is the opposite of what would be expected from basic principles. Further, it is based on claims that runaway cooling and warming events do not happen, despite the fact that several runaway cooling events have occurred on Earth, and a runaway warming event has occurred on our nearest, and most physically similar planet. Rather than being at a local high in terms of climate sensitivity, we are likely at a local low, with higher climate sensitivities likely for both warmer and cooler conditions.
2) Despite my heavy emphasis on observational estimates of ECS in my preceding post, many of which are paleo estimates (for which estimates of anthropogenic aerosol forcing, and thermal inertia are irrelevant), you again focus solely on computer models. The evidence climate scientists present for their theories are not restricted to the evidence you feel you may be able to rebut. Simply ignoring contrary evidence as you are currently doing is no basis on which to form views about scientific facts.
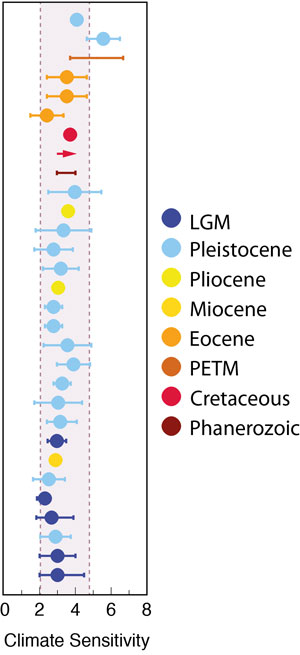
So, seeing you choose to ignore it, here is again a presentation of observational climate sensitivity estimates, in this case all from paleodata:
In addition to ignoring all the inconvenient empirical estimates, you again focus on Otto et al. The two main problems with Otto et al (IMO) are that they are only a partially observational estimate, and the method is erratic in its results, suggesting we should not place a large amount of weight on those results, and certainly not to the exclusion of other results.
First, to estimate ECS, Otto et al require an estimate of the increase in Global Heat Content (GHC) over the reference period from 1860-1879. There are no ocean heat content measures over that period on which to base an observational estimate. As they need a value for that period, they used model data to provide their baseline reference. Otto et al's result is critically dependent on this model determined value.
Further, Otto et al had no observational estimates of forcings over the period 2006-2010, and used the RCP 4.5 projections instead. Consequently their values for the final decade have even less of an empirical basis then the other values.
It is possible to eliminate the model dependence by applying their method, and using 1970-1979 as the reference period. The results for each decade is as follows:
1980s: 3.49 C/doubling
1990s: 2.70 C/doubling
2000s:2.58 C/doubling
The range of values obtained in that excercise also indicates the erraticness of the method. This method is heavilly influenced by decadal variations in the data, and effect partially concealed in their published results by the long time span used in the estimate, and by an odd discrepancy between their estimate of GHC in the 1970s and that obtained from other sources.
For completeness, two further problems with Otto et al are the use of HadCRUT4 which does not include the Arctic and hence underestimates recent warming. In addition, the HadCRUT4 record prior to 1880 consists effectively of the North Atlantic region (including the east coast of the US, and Western Europe), plus the sea routes to Brazil, South Africa, India and Australia. It is not a global record, and is heavily biased by data from the North Atlantic. There is a reason, a very good reason, why GISS and the NCDC start their temperature records in the 1880s (by which time temperature records are almost global, with the exclusion of Antarctica).
-
mgardner at 11:21 AM on 19 February 2014How we know the greenhouse effect isn't saturated
HK @43
A noble effort, but I already understand all this, and it doesn't answer my question or my concern about communicating it to others, which I thought was a major purpose of the blog. KR@44 is saying that it is possible to answer my question, but apparently I have to acquire and become proficient with MODTRANS, run my numbers, and whip up the graphics on my own time.
Here's an example of what I'm looking for:
A nice image and explanation, I think. If I were explaining this to someone, I would use it, and I think most sincere 'students' would get it. But if someone then asked me "what about that saturation thing I've heard about", I would like to be able to zoom in on the zone at the top of the troposphere, and show a similar diagram with some approximate values.
I could elaborate, but I'm not sure if there is any point if there's no source of information.
-
Rob Honeycutt at 11:07 AM on 19 February 20142014 SkS Weekly News Roundup #7
Russ... I have to ask you honestly when you read this...
"The most likely value of equilibrium climate sensitivity based on the energy budget of the most recent decade is 2.0 °C, with a 5–95% confidence interval of 1.2–3.9 °C,..."
Do you not get what they are talking about when they say "based on the energy budget of the most recent decade"?
They're not saying the most recent decade gives them a better estimation of ECS (which you seem to be implying). They state that that may not be the case, and that their estimations remain consistent with previous estimates of ECS.
-
Rob Honeycutt at 10:09 AM on 19 February 20142014 SkS Weekly News Roundup #7
Russ... But can you not see that you're doing exactly what Otto et al are cautioning against?
Their conclusion is not that ECS is lower that other estimates. They're saying their results are consistent with other estimates.
-
Russ R. at 09:10 AM on 19 February 20142014 SkS Weekly News Roundup #7
Rob Honeycutt,
"You might actually take the time to read Otto 2013 before making such assertions as that they estimate CS at 2C."
I did read Otto et al (2013).
Quote:
"The most likely value of equilibrium climate sensitivity based on the energy budget of the most recent decade is 2.0 °C, with a 5–95% confidence interval of 1.2–3.9 °C,..."
Moderator Response:[PS] It would save a lot of tedious detail if you would spell out why you think a CS of 2 is nothing to worry about, preferably with reference to impacts in the IPCC WG2. Since I would assume that you reject the Stern review, it would also help discussion if you spell out what sources inform your opinion when discussing impacts and costs. Thank you.
-
Russ R. at 08:47 AM on 19 February 20142014 SkS Weekly News Roundup #7
Dikran Marsupial,
In one post @49 you managed the trifecta of: a) quoting me out of context, b) making a strawman argument, and then c) accusing me of trolling.
First, you ignored the first half of my comment, thereby distorting my argument. If you hadn't selectively quoted me you would have seen that my full comment was:
" I would make a case that climate sensitivity was both higher and lower at different points in our planet's history, and will diminish if temperatures continue to rise. Were this not the case, the planet would have experienced runaway warming (or cooling) in the past when temperatures and CO2 levels were much higher (and lower) than they are today."
You only quoted the second part, starting at "Were this not the case..." Then you linked to a reference that has nothing to do with the point I was making.
Why do I say the post had nothing to do with my argument? Because it concluded:
"Thus arguments that Ordovician glaciation disproves the warming effect of CO2 are groundless. On the contrary, the CO2 record over the late Ordovician is entirely consistent with the notion that CO2 is a strong driver of climate."
Since I'd already acknowledged above that "the forcing component of increased GHG concentrations is straightforward enough," I'm already on-the-record as being in agreement with this article's conclusion.
I wasn't arguing that CO2 doesn't impact temperatures. I was arguing that sensitivity is not a constant across all climactic states. An argument which you selectively omitted.
Lastly, you accused me of trolling because before responding to Tom Curtis I failed to consult with a 3+ year old SkS post on the Late Ordovician, which refuted a claim I never made. Really?
Moderator Response:[PS] Snark, accusations, some attitude issues and a failure to read comments and responses carefully by both sides are creating unnecessary heat in an otherwise useful discussion. Could everyone please dial it back and focus the issues? kudos to Russ R for spelling out his position in @41 and to Tom Curtis for a considered response. More like this please.
-
How we know the greenhouse effect isn't saturated
mgardner - The interception probabilities are due to the total GHGs above the emission point and atmospheric temperatures, which are entirely quantitative but not reducible to a simple expression. That's why tools such as MODTRAN are used, running line-by-line computations with discretization over many layers.
-
How we know the greenhouse effect isn't saturated
mgardner & others:
Let’s try another approach and see if it helps:
1. The Earth receives 240 watts of solar energy per square metre on average when its spherical shape and albedo is taken into account.
2. To maintain a stable temperature, each square metre has to lose 240 watts back to space. This heat loss can only be in the form of infrared radiation because convection (dominant within the troposphere) and conduction is impossible in a vacuum.
3. The Earth’s average surface temperature is about 288 K (15oC), which corresponds to an IR emission of 390 watt/m2. That’s 150 watt/m2 more than needed to balance the energy received from the sun.
4. In order to avoid a dramatic cooling, the Earth’s heat loss to space has to occur from a level in the atmosphere where the emission equals 240 watt/m2. By using the Stefan-Boltzmann law (j* = T4 x 5.67x10-8) one find that this emission intensity corresponds to a temperature of 255 K (-18oC).
5. This means that the average altitude of heat loss to space is (288-255)/6.5 ≈ 5 kilometres above the sea level. Note that this altitude depends very strongly on the frequency of the emission. Some frequencies are hardly absorbed at all and therefore able to escape directly to space from the surface (see image in my post @23), while others can’t escape before they reach the lower or middle stratosphere because CO2 absorbs so strongly even in very low concentrations.
6. More CO2 and other greenhouse gases make the atmosphere at the altitude of heat loss more opaque to infrared, so the IR emissions from this altitude can’t escape to space so easily any more. As a result, the altitude of heat loss is pushed upwards to a thinner part of the atmosphere with fewer CO2 molecules above.
7. This new altitude of heat loss is colder and emits less heat to space, meaning that the Earth as a whole loses less heat to space than it receives from the sun.
8. As a result, the Earth has to warm until its heat loss to space increases enough to restore the balance between incoming and outgoing energy.
Did this help, or did I just create more confusion?
-
sidd at 06:43 AM on 19 February 20142014 SkS Weekly News Roundup #7
Re:Climate sensitivity as a function of CO2
from
Climate Sensitivity, Sea Level, and Atmospheric CO2
James Hansen, Makiko Sato, Gary Russell and Pushker Kharecha
NASA Goddard Institute for Space Studies and Columbia University Earth Institute, New YorkFig 7b)

-
Rob Honeycutt at 06:31 AM on 19 February 2014Customizable Global Warming Widget Metrics
Maurice... The temperature has gone up at a rate of something around 0.11C per decade since 1998. So, you're wrong from the outset here. Add to that the increase in ocean heat content and you have quite a lot of heat accumulating in the climate system.
If you believe the figures are in error then it is incumbent upon you to demonstrate how you would calculate the figures and show how they are correct.
-
Composer99 at 06:28 AM on 19 February 2014CO2 was higher in the past
eric7866:
First, solar output, on the largest scale, changes extremely slowly over geological timescales, but is extremely significant when it changes. A few % increase in solar output will, in a billion years or so, render the Earth uninhabitable. So it's no surprise that a few % decrease in solar output going back into the geological past requires an immense amount of atmospheric greenhouse gases to compensate. That said, geologically-significant changes in solar output are not something that has the effects consistent with what we have seen of global warming over the last 150 years.
Second, today's global mean surface temperatures are cold compared to most of the Phanerozoic. (Although given sufficient unabated warming our species may yet have the opportunity to experience surface temperatures consistent with, say, the Late Cretaceous).
Third, if you think that scientists studying present and paleoclimates are "discounting" any forcing agent in any situation, you are simply mistaken.
-
Rob Honeycutt at 06:11 AM on 19 February 2014CO2 was higher in the past
eric... Next, you need to consider what 4% actually means relative to solar output.
Our sun is a relatively stable star which varies only ~0.1% over the 11 year solar cycle. Solar irradiance is measured at around 1361W/m^2. Four percent of that is 55W/m^2, which is a significant difference of forcing on the climate system.
The change in solar forcing since ~1900 is on the order of 0.5W/m^2. So, we're talking about 2 orders of magnitude difference.
Others can check, but I think I have my figures correct.
-
Rob Honeycutt at 06:03 AM on 19 February 2014CO2 was higher in the past
Eric... One simple question. Do you honestly think the entire scientific community is fitting science to a desired result? Or, perhaps, might it be that you haven't yet grasped what the science says relative to your question?
The first act of skepticism should be to ask a question, as you've done, and then see if you can find the answer.
Your comment seems more leading than "just an observation." It sounds more like you're headed off into territory where you are forming conclusions based on a lack of knowledge.
-
eric7866 at 05:42 AM on 19 February 2014CO2 was higher in the past
If high CO2 levels of the past ages can be discounted by claiming the sun was 4% cooler back then, couldn't the slightly higher temps today be attributed to the sun being that much warmer than in the past? And not necessarily due to the CO2 levels? To discount levels in one scenario and not the current one? That seems like making the science fit a desired result rather than analysing the science to find the results...just an observation...
-
Dave Evans at 05:15 AM on 19 February 20142013 Among Top Ten Warmest on Record
Good article John. Are you going to add the first graph to your resources page? I'd find it very useful.
Moderator Response:[JH] No. The two graphs embedded in the OP were produced by the WMO, not SkS.
-
Rob Painting at 05:13 AM on 19 February 2014Extreme weather isn't caused by global warming
Cedders - the simple answer is that there isn't a linear relationship between the two - the moisture-holding capacity of the air increases faster for any given increase in atmospheric temperature. See the Clausius-Clapeyron relation.
-
Rob Honeycutt at 04:13 AM on 19 February 2014IPCC overestimate temperature rise
Just to further clarify DM...
You can't do this (red circle):
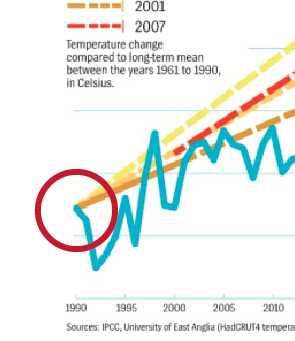
That is a single year, cherry picked, baseline. It's something you see Chris Monckton constantly doing in his presentations.
-
Dikran Marsupial at 03:56 AM on 19 February 2014IPCC overestimate temperature rise
Here is an example of what I mean (vai woodfortrees.org):
Here I've shown the HADCRUT4 datase, along with two lines representing completely accurate representations of the rate of warming, but only differing in the vertical offset introduced by the choice of baseline year.
The green line represents a "skeptics" presentation, where the observations and projection were baselined to a peak in the observations so that the observations are then generally below the projection. "IPCC models over predict warming" is the headline.
The blue line represents an "alarmist" presentation, where the observations and projections were baselined to a trough in the observations, so that the observations are generally higher than the projection. "IPCC models underpredict warming" is the headline.
The magenta line represents the scientific presentation (in this case it is just the OLS trend line), where the offset hasn't been cherry picked to support the desired argument.
-
mgardner at 03:49 AM on 19 February 2014How we know the greenhouse effect isn't saturated
KR@40
Please note: I'm the one who wasn't comfortable with the whole "layers" thing in the first place. Maybe you could take a look at my @41; I think that's the best I can do at posing the question.
-
Dikran Marsupial at 03:43 AM on 19 February 2014IPCC overestimate temperature rise
jsmith, the image you have shown there is not actually "unadjusted". The model projections used in the 1990 IPCC report do not all agree exactly on the temperature in 1990, and they definitely didn't predict the observations exactly either. The thing that is wrong with the picture is that they have used a baseline of year (whci happened to be a peak in the observations), rather than the proper procedure of a 30 year baseline. The problem with a single year baseline is that you can make it give any result you want, you can make it look like the models over-predict temperatures by baselining to a warm year, or you can make them look as if they are running cooler by baselining to a cold year. Sadly this sort of thing is done all the time, but that doesn't mean that it is correct - far from it.
-
jsmith at 03:35 AM on 19 February 2014IPCC overestimate temperature rise
Just out of curiosity, how do you "adjust" the IPCC's predictions to reflect observed GHG forcings? Because it seems as though there's a big difference between doing that (which results in the images shown above) and not doing it (which results in images like the one below).

In other words, what's wrong with this picture?
Also, I hate to sound like a broken record (as I said this about the "Southern sea ice is increasing" page too), but I don't see why we need both this page and the one called "IPCC global warming projections were wrong," as they both seem to cover the same topic.
Moderator Response:[Dikran Marsupial] Please can you limit your images to no more than 500 pixels wide. I have made the adjustment this time.
-
Dikran Marsupial at 03:33 AM on 19 February 20142014 SkS Weekly News Roundup #7
Russ R wrote "Were this not the case, the planet would have experienced runaway warming (or cooling) in the past when temperatures and CO2 levels were much higher (and lower) than they are today."
Please take the time to see if your arguments have been discussed before on skeptical science. In the past, when CO2 levels were higher and lower, there was no runaway warming because the other forcings were different (principally solar brightening), runaway cooling actually did happen and runaway warming is pretty difficult to achieve as CO2 radiative forcing only increases logarithmically with concentration, but e.g. ocean degassing only rises linearly with temperature and the radiation of energy from the earth proportional to the fourth power of temperature (Stefan Boltzman law).
I suggest we DNFTT until Russ actually starts checking up on whether his arguments have any merit before he uses them.
-
jja at 03:32 AM on 19 February 2014Vision Prize: scientists are worried the IPCC is underestimating sea level rise
The Vision Project results are revealing. It is clear that there is a very conservative bias in the attribution of effect of poorly understood, but potentially significant feedbacks.The following image static.visionprize.s3.amazonaws.com/Q4.jpg shows that a significant portion of the polled scientists expect a warming signal that would necessarily result in a final 2100 TCR of over 4'C.
In this case, there is indication for the Ross ice sheet dynamics that were present during MIS-31 to reoccur due to hemispheric climate changes associated with a slowdown of the MOC. adsabs.harvard.edu//abs/2010agufmpp43d..03b
This is a poorly understood dynamic that has a potentially high probability within the next 85 years. www.nature.com/ngeo/journal/v5/n3/full/ngeo1391.html
-
mgardner at 03:26 AM on 19 February 2014How we know the greenhouse effect isn't saturated
DM @39 or anyone who can contribute:
I'll give it one more try; perhaps I'm not communicating very well, or I'm completely wrong in my understanding.
1) The probability of a photon being emitted depends on the temperature, which depends on the altitude.
2) The probability of that photon escaping absorption and re-radiation (meaning attentuation statistically) is dependent on the altitude and the density of CO2 above it.
So, there are some photons that escape completely, and there is some attenuation of the total transport from that level through absorption and re-radiation in the atmosphere above the level of emission. What I'm trying to find is the quantitative relationship between those effects. I don't require great certainty, just some relative values.
If this is something we don't know, that's fine, but does anyone know if we know or don't know? (No, I'm not Rumsfeld in disguise.)
-
How we know the greenhouse effect isn't saturated
mgardner - Discretization of a continuous system is a useful approach for analysis, but one must always keep in mind that it is an approximation of a continuous reality.
There are certainly qualitative dividing lines that can be drawn - the top of the troposphere where convection ends and the still air of the stratosphere begins, for example. But the boundary for IR emission for each greenhouse gas (different for each) is a probabilistic one due to concentration based chances of interception - with < 50% of upward IR from slightly below that altitude escaping to space along with > 50% of upward IR from slightly above.
-
Rob Honeycutt at 03:22 AM on 19 February 20142014 SkS Weekly News Roundup #7
Russ @41... You might actually take the time to read Otto 2013 before making such assertions as that they estimate CS at 2C. They state:
"Using up-to-date data on radiative forcing, global mean surface temperature and total heat uptake in the Earth system, we find that the global energy budget implies a range of values for the equilibrium climate sensitivity that is in agreement with earlier estimates, within the limits of uncertainty."
They very specifically argue that caution needs to be taken in doing exactly what you've done.
"We note, too, that caution is required in interpreting any short period, especially a recent one for which details of forcing and energy storage inventories are still relatively unsettled: both could make significant changes to the energy budget."
Otto et al are not making an argument against the current central estimates of 3C for ECS. In fact, they are saying quite clearly their estimates support those earlier figures.
-
Russ R. at 03:15 AM on 19 February 20142014 SkS Weekly News Roundup #7
Tom Curtis,
Glad to see we agree on most of the issues. That leaves only two... climate sensitivity and the magnitude (and sign) of expected net costs for given amounts of warming.
Each of these is a subject weighty enough to be it's own PhD thesis, so a blog post won't really do justice to either. Plus, I'm tight on time this morning, being at work, so this will have to be brief.
Let's start with climate sensitivity (we'll get to net cost/benefits later). I have two main issues that cause me to be skeptical of arguments for high sensitivity.
1. Fundamentally, climate sensitivity is a combination of forcing, feedbacks and thermal inertia. The forcing component of increased GHG concentrations is straightforward enough, the planet's thermal inertia is a bit less straighforward (since nobody seems to know exactly when all the supposed "warming in the pipeline" should appear), but the feedbacks are most assuredly not straightforward at all. There are countless feedback mechanisms in operation at any point, some positive and some negative. The magnitude of each will vary under different climactic conditions (e.g. ice albedo feedback can be a factor only at the margin of ice extent, which is of much greater magnitude when ice sheets extend down to 45N latitude instead of 70N). I wouldn't treat the sum total of all feedbacks as a linear multiplier and extrapolate it into the future. (Which is exactly what is being done when using ECS to forecast temperature changes.)
I would make a case that climate sensitivity was both higher and lower at different points in our planet's history, and will diminish if temperatures continue to rise. Were this not the case, the planet would have experienced runaway warming (or cooling) in the past when temperatures and CO2 levels were much higher (and lower) than they are today. Instead, geological evidence points to a planet see-sawing between two relatively stable equilibrium climate conditions, which suggests high sensitivity in the middle of the range, and low sensitivity at either end of the range. We can get into this in greater detail if you like.
2. Second, the model-derived estimates of sensitivity are a function of the assumptions relating to aerosol forcings, which vary significantly. Rather than retype the whole argument, I'll link to a post that summarizes it: http://www.coyoteblog.com/coyote_blog/tag/ecs. I agree with Meyer on this specific issue, with one exception... where he estimates ECS at 1.2C, I'd go with 2.0C based on Otto et al (2013).
-
gws at 02:55 AM on 19 February 2014Methane emissions from oil & gas development
Two new, contrasting studies addressing air pollution from shale areas have been published:
1. A study published by a Houston company in Science of the Total Environment found no significant impact from oil and gas extraction activities in the Barnett shale region of Texas for a selected subgroup of air toxics (the paper title is thus somewhat misleading).
2. An investigation by a 3-member consortium (Center for Public Integrity, InsideClimate News and The Weather Channel) found that, in the Eagle Ford shale region of Texas, an ever increasing amount of emission permits given to frackers and limited state oversight suggests that air toxics emissions have strongly increased in a previously low emissions region, leading to very significant impacts.
-
Dikran Marsupial at 01:57 AM on 19 February 2014How we know the greenhouse effect isn't saturated
I don't think I am saying anything substantially different from KR, I was just giving the caveat that there probably isn't a clear boundary between the "opaque layer" and the "translucent layer", just that the probability of an IR photon escaping into space depends on the height at which it is emitted, and that as more CO2 is added, the higher the mean altitude will be. The boundary between the layers is equivalent to the height at which the p.d.f. starts rising quickly, but it isn't a distinct boundary. If it makes more sense to think of a p.d.f. than in terms of layers, then think of a p.d.f.
Layers are often useful in explaining concepts about the atmosphere, but they layers don't always correspond to physically distinct layers in the atmosphere (like the trophosphere and stratosphere). Like all analogies/models, there comes a point in the discussion where you need to move onto a lower level of abstraction. IIRC layered models are often used in practice (atmosphere and ocean) as it is easier to model a continuously varying atmosphere as a number of thin homogenous layers.
-
mgardner at 01:42 AM on 19 February 2014How we know the greenhouse effect isn't saturated
KR and DM
Thanks; I do understand the principles as described. I guess my problem is with this language of 'layers'. It seems that even you guys aren't quite in agreement on how to characterize what's happening when you try to employ it.
The analogy I used @28 fails in a strict sense because it is restricted to radiative transport; there would have to be some other metaphor for mass effects (convection), to account for the gradient or thermocline through this upper zone of the troposphere where the action is. (I'm still hoping someone can refer me to a source that gives a higher-resolution picture of that area.)
But maybe the real source of confusion is that opacity to 'original photons' makes us think of 'layers' when there are no layers with respect to radiative transport? Or do I have that wrong?
-
PluviAL at 01:13 AM on 19 February 2014Customizable Global Warming Widget Metrics
Thanks for the restatement of what would seem to be obvious but is not. I started to put this on my website, now I am motivated to finish. Just to be sure, the terms are very generous. I understand that it can even be put into an e-book. Please correct me if that is not correct. I'll read terms again, but I don't want to missinform.
-
Cedders at 01:09 AM on 19 February 2014Extreme weather isn't caused by global warming
Please excuse a very basic question, prompted by the flooding here in the UK and a report on it at <http://www.metoffice.gov.uk/research/news/2014/uk-storms-and-floods>. I understand (a) CO2 etc will raise the temperature and moisture content of warm air; (b) precipitation generally occurs when warm moist air meets colder air. Is the strength of precipitation proportional to the difference in temperature between the two air masses (that causes water vapour to condense)? If so, will not the colder air mass on average also be warmer, so the differential remains roughly constant with rising SST, and precipitation is not necessarily heavier? (If the answer requires maths, please include.) Thanks.
Prev 755 756 757 758 759 760 761 762 763 764 765 766 767 768 769 770 Next


